
Peipei Zhou, Qinghai Ding, Haibo Luo, Xinglin Hou. Anomaly Detection and Location in Crowded Surveillance Videos[J]. Acta Optica Sinica, 2018, 38(8): 0815007
- Acta Optica Sinica
- Vol. 38, Issue 8, 0815007 (2018)
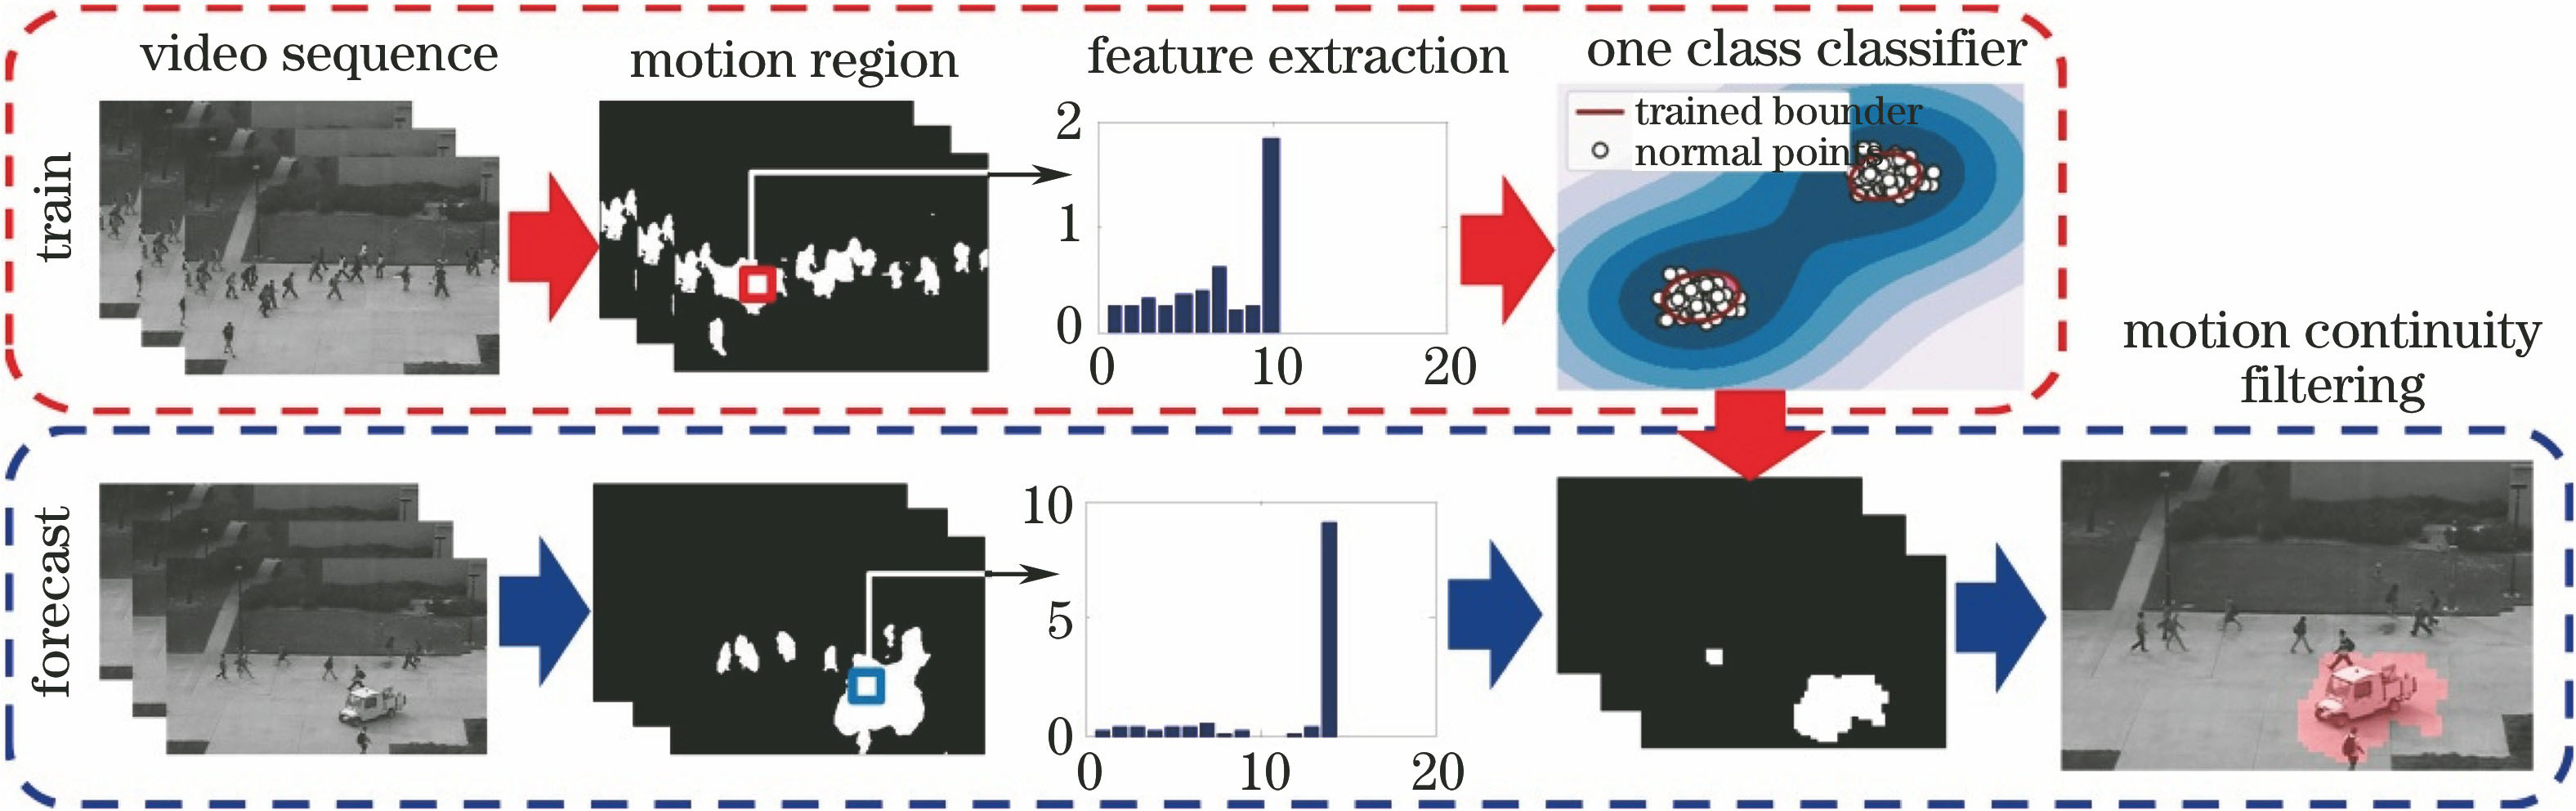
Fig. 1. Flow chart of abnormal behavior detection and location
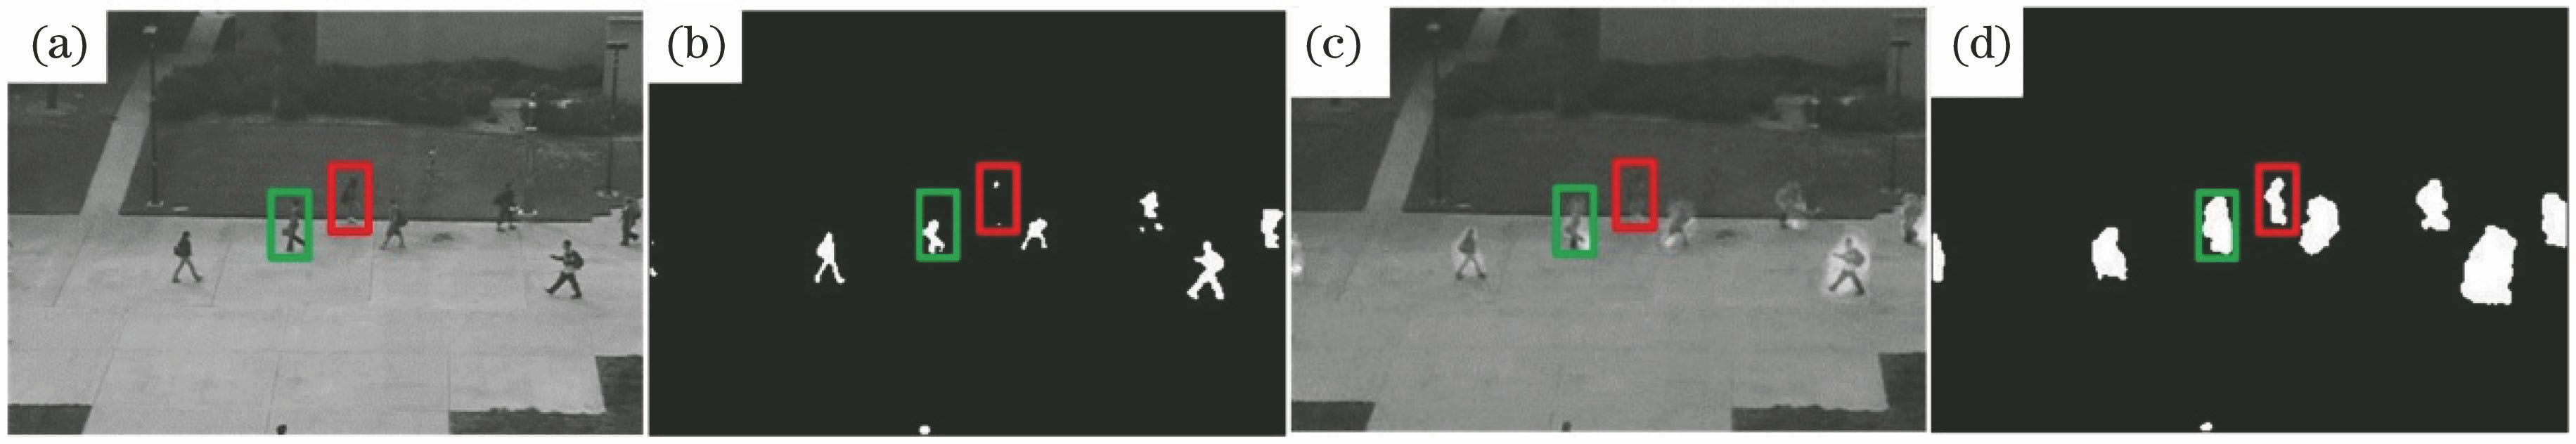
Fig. 2. Segmented motion-region images. (a) Original image; (b) motion regions achieved by the ViBE method; (c) image with motion magnitude; (d) motion regions achieved by the proposed algorithm
Fig. 3. Filtering results according to motion continuity for the abnormal regions which are predicted by the classifiers
Fig. 4. Examples of normal and abnormal crowed activities in UMN dataset. (a) Normal behaviors; (b) abnormal behaviors
Fig. 5. ROC curves of different methods in two criterions on the UCSD ped2 dataset. (a) Frame-level; (b) pixel-level
Fig. 6. Pixel-level detection results with different methods on the UCSD ped2 dataset. (a) Social Force; (b) MPPCA; (c) T-MDT; (d) S-MDT; (e) proposed method
Fig. 7. ROC curves of different methods for frame-level detection on the UMN dataset
Fig. 8. Detection and location results of three different scenes on UMN dataset
Fig. 9. Relationship curves between the parameter k and the system performance on two datasets
| |||||||||||||||||||||||||||||||||||||||||||||||||||||||||||||||
Table 1. Comparison results of different methods on the UCSD ped2 dataset for frame-level and pixel-level detection
|
Table 2. Comparison results of different methods on the UMN dataset in AUC and EER criterion for frame-level detection

Set citation alerts for the article
Please enter your email address
© Copyright 2018-2021 | Chinese Laser Press. All Rights Reserved 沪ICP备15018463号-20