
Miguel López-Ripa, Íñigo J. Sola, Benjamín Alonso. Bulk lateral shearing interferometry for spatiotemporal study of time-varying ultrashort optical vortices[J]. Photonics Research, 2022, 10(4): 922
- Photonics Research
- Vol. 10, Issue 4, 922 (2022)
Abstract
1. INTRODUCTION
During the last decades, the development of laser technology has evolved drastically. At present, it can be used to generate complex ultrashort laser pulses [1,2] for different applications such as high harmonic generation [3,4], micromachining [5–7], optical communications [8], or biomedicine [9].
As ultrashort laser technology evolved, so did the development of new techniques to characterize it and, depending on the process under study, different characterization techniques can be used. If the temporal/spectral properties do not depend spatially, then purely temporal characterization techniques can be used to characterize the electric field (amplitude and phase). Some examples of these techniques are FROG (frequency-resolved optical gating), SPIDER (spectral phase interferometry for direct electric field reconstruction), d-scan (dispersion scan), and amplitude-swing [10–12].
Nevertheless, in a general case the temporal/spectral properties can vary spatially and, in that case, using only a purely temporal characterization technique is usually not enough to correctly measure it, so a spatiotemporal characterization technique is needed. These techniques have multiple applications as mentioned before, but especially, they are the key stone for measuring beam distortions [13–15], which is crucial for the optimization of the emission of high intensity ultrashort laser systems. Throughout the years a broad range of spatiotemporal characterization techniques with different schemes have been proposed to correctly characterize ultrashort laser beams with spatiotemporal dependences. These techniques include SEA-TADPOLE (spatially encoded arrangement for temporal analysis by dispersing a pair of light E-fields) [16], STRIPED FISH (spatially and temporally resolved intensity and phase evaluation device: full information from a single hologram) [17], shackled FROG [18], STARFISH (spatio-temporal amplitude-and-phase reconstruction by Fourier-transform of interference spectra of highly-complex-beams) [19], and TERMITES (total E-field reconstruction using a Michelson interferometer temporal scan) [20], among others [21,22].
Sign up for Photonics Research TOC. Get the latest issue of Photonics Research delivered right to you!Sign up now
The motivation to develop this work is that some of these techniques require complex set-ups or scans with sub-cycle precision that could be difficult to implement. Moreover, some of them are not able to correctly characterize the wavefront of the pulsed beams due to their high sensitivity to external perturbations associated with the schemes based on non-common path interferometers. In order to tackle this problem, we have implemented a bulk lateral shearing interferometer for ultra-stable spatiotemporal characterization of ultrashort beams based on the combination of spectral interferometry (SI) and polarization interferometry (PI) using anisotropic elements, as it was hinted in Ref. [23].
PI takes advantage of the properties of uniaxial birefringent crystals to obtain two laterally sheared parallel replicas of the initial beam with a certain temporal delay between them [24]. This technique is usually applied with continuous emission light sources, and over time they have been proposed with different configurations [24–27]. Polarization interferometers have been widely used in microscopy [24] and have also been used to characterize the wavefront thermal distortions with a continuous wave laser [28] or to generate complex polarization structures [29].
The bulk lateral shearing interferometer implemented in this paper forms a simple and compact in-line spatiotemporal characterization system that can be used to characterize ultrashort laser beams. Due to the monolithic common-path configuration, the spectral interferograms present high stability, enabling the system to correctly measure the wavefront of ultrashort laser beams. Moreover, our system, unlike the majority of other spatiotemporal techniques, is not limited by the spectral range of beam-splitting elements or fiber couplers and, provided the reference pulse, it can operate in all the transparency range of the birefringent crystals opening the opportunity to operate in spectral ranges such as visible or ultraviolet.
This technique could be used to characterize complex spatiotemporal pulses. Here, we have applied it to optical vortices because they have gained great interest in the last decades due to their diverse applications: optical tweezers for particle trapping, optical communications, and optical machining, among others [30]. Essentially, optical vortices consist of beams with a phase singularity and an azimuthal variation of the phase associated with an orbital angular momentum (OAM or ) defined as , where is the azimuthal angle. There are different ways of making and characterizing optical vortices using ultrashort laser pulses. For example, in Ref. [31] optical vortices were generated using a spatial light modulator and characterized with a Hartmann–Shack and a FROG system. Instead, in Ref. [32] a multi-pinhole plate was used as a vortex generator, where the characterization was done through the common fork interference pattern with a plane wave. Another way, particularly interesting for ultra-intense lasers, consists of using plasma holograms [33] or the reflection of a defocused intense vortex in a plasma mirror [34] to imprint the azimuthal phase variation in an ultra-intense beam and also to generate high harmonics. Another widespread technique is discussed in Ref. [35], in which a few-cycle optical vortex was generated using a spiral phase plate (i.e., a glass plate with angularly increasing thickness) and characterized with spatially resolved Fourier transform spectrometry. In addition to the previous standard scalar vortices, other groups generated vortices with interesting properties such as vector beam vortices [36] or spatiotemporal optical vortices [37].
In this paper, we implement a simple, compact, and ultra-stable spatiotemporal characterization technique based on bulk lateral shearing spectral interferometry using birefringent uniaxial crystals. The system’s common-path interferometer scheme enables the possibility of retrieving frequency-resolved wavefronts with accuracy. Moreover, we have used it to measure ultrashort optical vortices that present constant and time varying OAM, demonstrating that the technique is a robust system able to characterize complex spatiotemporal structures.
2. MATERIAL AND METHODS
A. Principles of the Spatiotemporal Characterization Technique
The proposed technique exploits the properties of the birefringent uniaxial crystals to develop a simple in-line and ultra-stable characterization system based on SI and PI that is able to characterize the spatiotemporal structure of ultrashort laser beams.
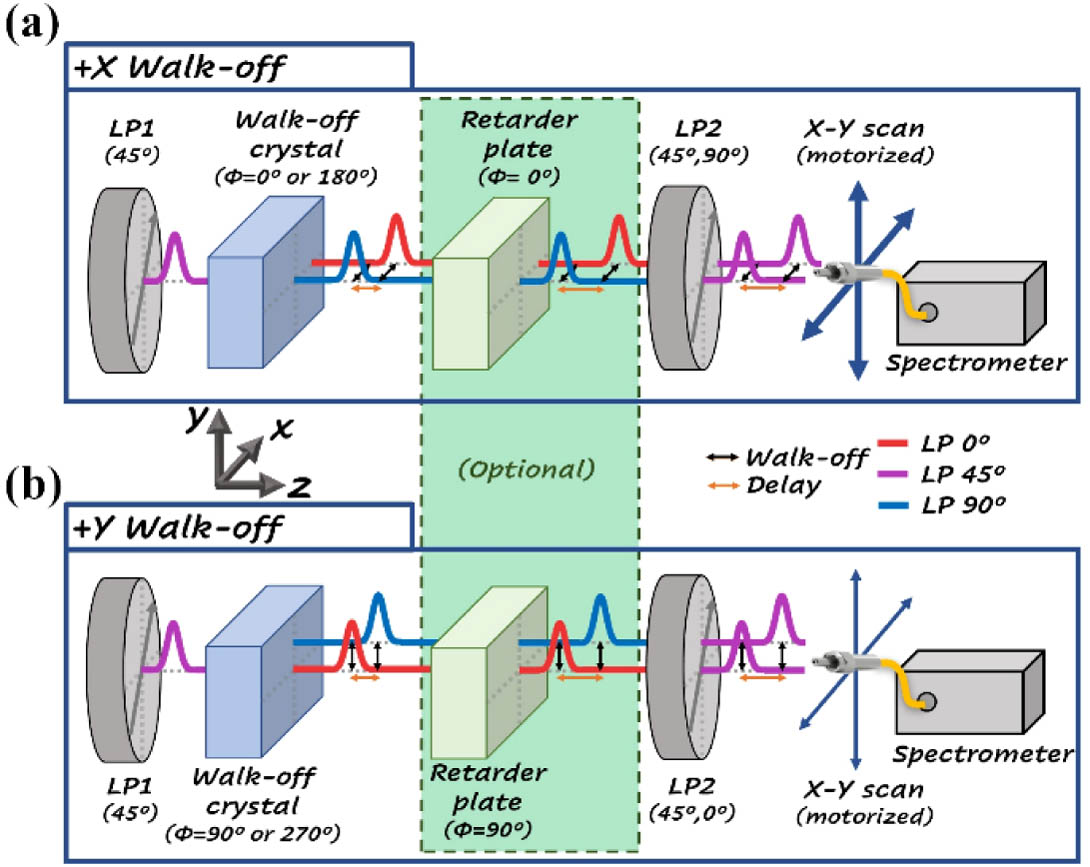
Figure 1.General scheme of the proposed technique for a 2D measurement introducing the walk-off in the (a)
It is well known that the orientation of the optical axis (OA) of a birefringent uniaxial crystal with respect to the incident radiation influences how the light propagates through the medium (e.g., the introduction of delay, spatial shear, or birefringence). We consider normal incidence of the beam onto the crystal and define the -axis as the propagation direction. We define as the angle between the projection of the OA in the plane (the face of the crystal) and the -axis, whereas is the angle of the OA with respect to the -axis (see the definition of axes in Fig. 1). Note that the crystal can be rotated about the -axis to different angles . If we use an input beam linearly polarized at 45° in the -plane, then this leads to two interesting situations.
Notice that the ordinary and extraordinary components have orthogonal polarizations in both situations. The delay and walk-off introduced in both cases depend on the angle and the crystal parameters (e.g., the birefringent refractive indices and crystal thickness) and can be obtained by theoretically studying the propagation of a plane wave in a uniaxial birefringent crystal following the formalisms explained in Refs. [38,39].
We are applying the technique to collimated beams with normal incidence to the crystals because it is the simplest way of retrieving the complete spatiospectral dependence. It could also be performed in oblique incidence, but other effects such as the phase walk-off (i.e., the lateral shear of the extraordinary beam phase with respect to the ordinary beam phase) should be considered during the retrieval, implying that the reconstruction process will be more complex.
For simplicity, we are going to explain the fundamentals of our technique in a 1D spatial approach, and later we will extrapolate it into a 2D spatial approach. Our technique takes advantage of property II in order to measure the SI of two delayed beams laterally sheared a small distance equal to the walk-off (if necessary, it can also be combined with property I to adjust a suitable delay for the SI). Those beams have orthogonal linear polarizations. We are going to refer to the beam that experiences lateral shear as “walk-off beam” (WB) and the one that does not experience the lateral shear as “ordinary beam” (OB). Moreover, we have chosen the criterion that the walk-off beam is the one which always arrives before in the SI. In the case that the ordinary beam is the first arriving to detection, the same equations proposed here can be used to retrieve the phase, but the Fourier-transform spectral interferometry (FTSI) must conjugate the phase or select the side peak centered at .
Taking into mind the definitions of the latest paragraph and projecting both beams in a common polarization direction with a linear polarizer, the resulting spectrum of the SI in one spatial point, , is
The main point of the proposed technique is that the walk-off beam is basically the same as the ordinary beam but laterally displaced by the amount of the walk-off and with a delay. Thus, setting the initial polarizer into 45°, if we measure the spatial profile in steps of the same size as the walk-off introduced by the crystal and supposing the walk-off is introduced in the positive direction of the axis, then we can express Eq. (1) as
The crucial point is that, if the measurement is done in walk-off steps, then the phase term without the relative phase term [] in Eq. (2) contains the gradient of the spatial phase in the walk-off direction of the pulse under study.
Using an FTSI algorithm [40] and knowing , the phase term of the SI can be extracted. Therefore, with the proposed technique we can measure the spatial gradient of the spatiospectral phase. So, if the walk-off is introduced in the positive direction of the axis, then we are going to have a phase array (), and each position () will contain the following phase difference . It is important to point out that the obtained phase array () not only contains the information of the spatial phase gradient in the walk-off direction of the pulse under study, but also contains the information of the phase added by the characterization system elements. Thus, the system must be calibrated in order to extract the phase information of the beam under study (Beam): . On one hand, the calibration can be done using a flat wavefront (pulsed) beam. Moreover, we have observed that with this approach it is interesting to perform an average of the calibration in different points in order to compensate for small wavefront fluctuations of a possibly non-perfect beam, so the calibration beam can be an average flat-pulsed beam, which is more realistic and less restrictive. We have used the latter strategy for the calibration, but there can also be other different approaches to perform it, such as using a continuous wavelength diode laser and a conventional wavefront sensor (although with this approach, the monochromatic response should be extrapolated for the whole pulse bandwidth).
With this information, we obtain the relative spatiospectral phase (equivalent to the wavefront for the different frequencies). In order to know the full beam information (the absolute spatiospectral phase needed for the spatiotemporal characterization), it is necessary to know the spectral (or temporal) phase in one point of our spatial measurement (), which can be measured with any conventional temporal characterization technique. The absolute spatiospectral phase of the pulse under study can be extracted iteratively from the known point following these equations (spectral dependence is not indicated to simplify the expressions):
In case the walk-off is introduced in the negative direction of the axis an analogous analytical development for the retrieval could be done but considering that the phase difference measured with the SI will be .
Once the spatiospectral phase is obtained, it is also required to know the spatiospectral amplitude in order to obtain the complete characterization. If the spectrum varies smoothly from point to point, implying that , then the spatiospectral amplitude can be extracted from the interference measurement by filtering the central peak in the FTSI. If the approximation were not possible, then the spectrum could be directly measured by scanning, for example, the ordinary beam. The latest approach is possible because walk-off and ordinary beams have orthogonal polarizations, so the ordinary beam can be easily selected using the last linear polarizer. The walk-off beam could be scanned instead of the ordinary beam, but it should be considered that it is laterally displaced.
The extraction of the spatiospectral information of the pulse in a 1D approach can be extrapolated to a 2D characterization. The 2D approach requires two interferential measurements with the walk-off introduced in different directions. For simplicity in our case, we choose perpendicular directions ( and in our set-up). The interferential measurement with the walk-off in the -axis is used to connect the information of each 1D section (-axis) at different values of
If it is necessary, then more complex paths can be followed to avoid singularities or spatial points without signals, but in that case, it is usually needed to measure the 2D arrays for both walk-off directions. For example, we have developed a strategy that retrieves the grid in 2 quadrants (2D2Quad) or in 4 quadrants (2D4Quad) using 2DMx or 2DMy and combining all of them in one retrieval. The latter is useful to avoid singularities at the center of the grid, as it usually happens with optical vortices. During the development of the technique, we have implemented different strategies to retrieve the phase, and we select the most appropriate depending on the beam structure.
B. Experimental Set-up for Measurement and Generation of the Optical Vortices
This section is focused on the implementation and application of the bulk lateral shearing interferometric technique in the laboratory and the generation of the optical vortices that we measure.
The scheme of the general set-up of the proposed technique is shown in Fig. 1. First, a linear polarizer (LP1) selects the pulse polarization projection of 45° in order to have the same amplitude in the horizontal () and vertical () polarization projections. Second, the pulse travels through the walk-off crystal after normal incidence. Following this element, we have two delayed beams spatially sheared in the -direction if the walk-off crystal OA is or 180° or in the -direction if or 270°. The selection of each depends on the desired sign of the walk-off crystal birefringence and the walk-off direction. Third, another linear polarizer (LP2) is used to select the spectral interference between the ordinary and the walk-off beams (LP2 at 45°) or the ordinary beam spectrum (LP2 at 90° or 0° if the walk-off is introduced in the - or -axis, respectively). Finally, a 2D motorized stage is used to spatially scan the signal using an optical fiber connected to a spectrometer. If the delay introduced by the walk-off crystal is not optimal for the spectral interferometry (either too low to filter the signal or too high to be resolved by the spectrometer), then an additional retarder plate with the appropriate orientation can be placed between the walk-off crystal and LP2 in order to adapt the delay between the ordinary and walk-off beams.
The laser source used in the experiments presented in this paper was a Spectra-Physics laser, model Spitfire ACE, which provides pulses centered at 798 nm with a Fourier-transform limit of 64-fs FWHM and a repetition rate of 5 kHz. The experimental set-up of the spatiotemporal technique implemented in the laboratory, shown in Fig. 2(c), used two polarizing beam splitter cubes as LP1 and LP2 (Thorlabs), a 3-mm calcite, with its fast axis in the direction as retarder plate (introduces a 1.8-ps delay at 798 nm), a spectrometer (AvaSpec 2048-USB1, from Avantes Inc.), and a walk-off crystal. One configuration used with walk-off crystal with a 1.12-mm-thick BBO cut with that introduces a 71-μm walk-off and 120-fs delay at 798 nm. The other walk-off crystal was a 1.06-mm-thick calcite cut with that introduces a 113-μm walk-off and 350-fs delay at 798 nm.
![]()
Figure 2.Scheme of the experimental set-up. (a) Configuration to generate a single optical vortex with an OAM of
Moreover, the temporal reference was obtained by taking the beam after the LP1, using a flip mirror, and selecting a spatial point using a diaphragm before guiding it into an amplitude swing system [12]. This technique is an in-line compact system that extracts the spectral phase of a pulse encoded in a second harmonic (SH) trace obtained from the interference of two replicas of the pulse for different azimuthal angles () of a rotating retarder plate. The system used in the paper consists of a 2-mm rotating quartz plate, a 10-μm Type I BBO, and a spectrometer (HR4000, from Ocean Optics) to measure the SH trace.
First, a proof of concept of the technique was carried out (shown in the next section), consisting of measuring an ultrashort optical vortex with two completely different walk-off crystals. The optical vortex was generated using an S-waveplate (SP2), as was done in Ref. [41]. Specifically, SP2 operates as quarter-waveplate with a spatially varying fast axis and converts input circular polarization into a radial polarization vortex of . These pulses can be interpreted as the combination of a right-handed circular polarization (RCP) vortex of and a left-handed circular polarization (LCP) vortex of [41].
In the proof of concept, Fig. 2(a), we used a zero-order quarter-waveplate (L40, CVI) at 45° to convert the horizontal linear polarization pulses from the laser into RCP pulses. Then, they were propagated through the SP2 and using a zero-order quarter-waveplate (QWP0, Eksma Optics) at 45°, the RCP and the LCP vortices were converted into linearly polarized vortices at 0° and 90°, respectively. Then, using a linear polarizer (LP3, Newport, series 10GL08), the vortex was selected to be studied.
Second, in order to exploit the technique capabilities, the spatiotemporal structure of a vortex pulse with time-dependent OAM has been studied. For this purpose, two delayed optical vortices were generated combining the S-waveplate with a retarder plate. Using our technique, we measured the combined spatiotemporal structure. It is similar to how it was done in Ref. [42], but in our case we have modified the set-up to study scalar collimated beams using a linear polarizer to project the combination of the delayed vortices, obtaining a pulse with a time-dependent topological charge.
The set-up of this experiment is shown in Fig. 2(b). First, the horizontal polarized beam from the laser traverses a zero-order quarter-waveplate (QWP0, Eksma Optics) at 45° that converts it into an RCP beam. As said before, the SP2 converts the beam into a combination of an RCP vortex of and an LCP vortex of . After that, we used a zero-order quarter-waveplate (L40, CVI) at 45° to convert the RCP and LCP pulses into horizontal and vertical linear polarization, respectively. Afterwards, the two crossed polarization vortices traveled through a 2-mm quartz retarder plate with its fast axis at the horizontal axis, in order to introduce a delay of 65 fs (of the order of the input pulse duration) between those vortices. Finally, the linear polarizer LP3 is used to project the orthogonal delayed vortices into a common polarization direction of 45°. We will see that the spatiotemporal structure produced with this scheme will be an optical vortex with at the beginning and at the end of the pulse (where the pulses do not overlap), while we will observe their superposition (interference) in the central region of the delayed pulses.
3. RESULTS AND DISCUSSION
A. Proof of Concept: Ultrashort Optical Vortex
Following the procedure described in Subsection 2.B, we generated a linearly polarized optical vortex and characterized it using the proposed technique with two different walk-off crystals (BBO and calcite). The measurements were done with steps equal to the walk-off introduced by each walk-off crystal and scanning approximately the same range (). In the case of the BBO, we performed grid scans with a spatial step of 71 μm, while in the case of the calcite, we performed size scans with a spatial step of 113 μm.
The temporal reference of the beam was measured using the amplitude swing in the lateral of the vortex at position by selecting it with a pinhole. As the reference points can be freely selected, we avoided performing the temporal characterization at the center of the vortex because the signal is lower. Figure 3 shows the amplitude swing experimental trace and the retrieval obtained (retrieved trace and the electric field).
![]()
Figure 3.Amplitude swing measurement for the optical vortex of the proof of concept at position
The spatiotemporal retrieval with the proposed technique was performed with the 2D4Quad approach, measuring the spatial spectrum of the ordinary beam and using the temporal reference of Fig. 3.
Figure 4 shows the comparison of the reconstructed spatiospectral intensity and phase for the wavelength 798 nm, obtained using the BBO [Figs. 4(a1) and 4(b1)] and the calcite [Figs. 4(a2) and 4(b2)] as walk-off crystals.
![]()
Figure 4.(a) Retrieved spatiospectral intensity and (b) phase at 798 nm of the same optical vortex using the algorithm 2D4Quad and measuring the spatial spectrum of the ordinary beam with two walk-off crystals: (a1), (b1) BBO and (a2), (b2) calcite. Note that the retrievals are shown spatially interpolated with a spatial step of 10 μm.
The measurements of the spectral intensity and phase distributions using different walk-off crystals show very good comparison, where slight differences could be associated to the different spatial resolutions, i.e., 71 μm for the BBO and 113 μm for the calcite.
As said before, the spatiospectral phase (the wavefront for the selected wavelength) retrieved in both cases [Figs. 4(b1) and 4(b2)] corroborates the generation of an optical vortex with an OAM of , of which the intensity is associated to a spatial ring [Figs. 4(a1) and 4(a2)], as expected. Since the vortex generation is achromatic, this has also been observed for the different wavelengths of the pulse, as shown in
![]()
Figure 5.Azimuthal phase comparison for a 600-μm-radius ring for each walk-off crystal (BBO and calcite) and the theoretical azimuthal phase (Theo.).
We consider that the results presented in this section, where we have obtained similar reconstructions of the beam with two completely different walk-off crystals and corroborated them against the theory, constitute a validation of the technique.
B. Time-Varying Ultrashort Optical Vortices
After the validation of the technique shown in the previous section, we decided to study a more complex and interesting situation. We chose the calcite walk-off crystal (instead of the BBO) because the walk-off introduced is enough to correctly characterize the spatial variations of the generated vortices, while having fewer points in the scanning grid and, therefore, a shorter measurement time.
Using the combination of the S-waveplate and a retarder plate (as it was explained at the end of Subsection 2.B), we generated two delayed optical vortices of different OAMs, and using our system, we characterized their superposition. The temporal retrieval at the reference point was done using amplitude swing at position , obtaining Fig. 6.
![]()
Figure 6.Amplitude swing measurement for the two delayed optical vortices at position
In this case, we performed size scans with a spatial step of 113 μm (similar to before) and retrieved the spatiospectral phase using the 2D2Quad strategy. The spectral amplitude was directly measured by selecting the ordinary beam projection. Figure 7 shows the spatiotemporal characterization for three different times that corresponds to the center () and the tails of the average pulse ( and ).
![]()
Figure 7.(a) Retrieved spatiotemporal intensity and (b) phase of the average pulse for three different times using the 2D2Quad approach: (a1), (b1)
According to the spatiotemporal phase [Fig. 7(b)], we can observe the OAM change along with the pulse. In the leading edge of the pulse (), the spatial phase corresponds to , while in the trailing edge (), it evolves into . These pure values are consistent with having the contribution of a single vortex. Note that what we are observing is in fact the superposition of two delayed optical vortices with different OAMs. In the temporal range where the pulses overlap, the OAM contributions depend on the relative amplitude of the delayed vortices.
To corroborate our experimental results, we have simulated the combination of two delayed ultrashort beams with spatial Laguerre–Gauss modes ( and ), the temporal profile retrieved in Fig. 6, and the phase introduced by the 2-mm quartz retarder plate. Also, we have imposed that the energy of each spatial mode is similar, and the waist of the mode is defined as the waist of the mode to have a better spatial overlap, as it corresponds to the experimental situation. The spatiotemporal dependence of this simulation is shown in Fig. 8 for three different times that correspond to the center () and the edges of the average pulse ( and ). Furthermore,
![]()
Figure 8.(a) Simulated spatiotemporal intensity and (b) phase of the combination of two ultrashort optical vortices with different OAMs (
On the one hand, the experimental spatiotemporal phase dependence, shown in Fig. 7, fits well with the numerical simulation, shown in Fig. 8, and presents the same behavior regarding the OAM variation. Moreover, the spatiotemporal phase of the superposition at the central pulse time () observed experimentally, Fig. 7(b2), fits with the theoretically simulated, Fig. 8(b2). On the other hand, the evolution of the experimental spatiotemporal intensity agrees with the simulations. The possible origins of the deviations can be related to imperfections in the vortex generation using the S-waveplate and the fact that the vortex is not a perfect mode due to the minimum at the center of the S-waveplate because of the design and manufacturing constraints. Another possible source of deviations is the lack of homogeneity of the input laser source.
C. Operability and Discussion about the Spatiotemporal Technique
In this work, we have shown the capability of the bulk lateral shearing interferometric spatiotemporal technique to correctly characterize pulses with complex spatiotemporal dependences. In this section, we will explain the operability and key points concerning the operation of the technique.
The most important parameter of the technique is the walk-off, so it must be correctly determined. From our experience, the walk-off crystal thickness must be calibrated to calculate the walk-off value correctly. In our case, we used an interferential method measuring the delay due to the birefringence.
When dealing with ultrashort laser pulses, it is important to consider the spectral dependence. In this technique, the user must ensure that the walk-off variation along the pulse bandwidth is not significant when compared to the mean walk-off value and the size of the signal collection element. For example, in our case we are using a single mode optical fiber with a 4 μm core to collect the signal. Actually, the walk-off variation in our spectral range was lower than 1 μm, which, in our case, is much lower than the mean value (71 μm for the BBO or 113 μm for the calcite), so we neglect the effect of the spectral dependence for the walk-off. Nevertheless, further studies should be done to adapt this technique to the few-cycle regime due to the large bandwidth of the pulses. We expect that achromatization schemes already established in PI [26,27] will help to minimize the effect. Moreover, if the beam presents a strong spatially dependent spectrum, it is necessary to extract the spatiospectral phase from the gradient following a path from higher to lower spectral content.
The angular dependence of the energy walk-off is also important to consider. The experiments reported in this paper involve collimated beams. Even so, a collimated Gaussian beam can be decomposed by a Fourier transform into a combination of plane waves with different wavevector orientations. Following the formalism of Refs. [38,39], we have developed a code to study the propagation of plane waves through uniaxial birefringent crystals, and we have used it to study the propagation of the decomposition of a monochromatic collimated Gaussian beam. The simulations performed showed that the angular walk-off variations when using collimated Gaussian beams are negligible. However, further studies are required to study the effect of the angular dependence for non-collimated beams with high numerical apertures. In previous works on PI, some authors have studied the angular dependence, obtaining different solutions to mitigate it [25,27], and further studies may be needed to adapt those approaches to the present technique.
Another key point of the technique is the calibration of the system using a flat wavefront reference. The simplest way to calibrate is to measure the collimated beam from the laser source over a 2D array and average the calibration at all the points. This procedure of calibration can reduce problems due to non-perfectly flat wavefronts of the laser source or imperfections in the elements that form the system (mirrors, plates, etc.). Another possibility would be to calibrate it theoretically if all the crystal parameters were well known.
Concerning the temporal pulse duration range of operation, the lower limit is set by the spectral dependence of the walk-off, and the upper limit is determined by the spectral resolution required for the FTSI algorithm. Essentially, it could be adapted by using the appropriate spectrometer.
Moreover, since our technique is based on SI, the spatial phase from point to point cannot change more than . Thus, the walk-off must be small enough to correctly scan the beam under test. Regardless, this is not a limitation because it can be easily solved using thinner walk-off crystals that are commercially available.
Regarding the beam size, here we have characterized approximately 2-mm beam diameters with a spatial resolution around 100 μm, but larger or smaller beams can also be characterized. On the one hand, the possibility to characterize larger beams is of great interest in high intensity laser systems. For larger beams, the simplest way is to use larger elements, but other recurrent approaches can be used, such as an aberration-free imaging system, to reduce the beam size before the characterization system. On the other hand, for smaller beams the key point is to have enough spatial resolution. Since the spatial resolution of the technique is the introduced walk-off, it can be appropriately set by using a different crystal (e.g., thinner or with a lower birefringence) or, alternatively, the beam can be magnified. If the walk-off crystal were reduced, then the limit would be the spatial resolution of the collection, in our case, the fiber spectrometer (4-μm core). In all cases, larger and smaller beams, it could be interesting to adapt the walk-off to obtain the best balance among grid size, spatial resolution, and measurement time. The measurement time can be considerably reduced using an imaging spectrometer so an grid could be reduced to N measurements at different lateral or vertical positions.
Computationally, the algorithm based on FTSI used in the spatiotemporal retrieval is direct and fast and can obtain the gradient and the complete retrieval for the grids used in this paper in only a few minutes. Moreover, once the gradient is obtained and a reference point phase is known, it is necessary to follow a path to integrate the gradient, avoiding null signal points (if existing) that could introduce noise to the complete spatiospectral retrieval.
Although the reference phase can be obtained using any temporal characterization technique, it is quite interesting to use amplitude swing because it is a self-referenced method with common-path interference, thus, being very robust against external perturbation. This fact combined with the ultra-stable spatiotemporal technique presented in the paper, establishes a whole compact and robust system with potential applications outside laboratory conditions.
Furthermore, in this paper we have explained how to obtain the spatiotemporal retrieval using measurement steps equal to the walk-off shear, but this is not mandatory. Different measurement steps could be used at the expense of using a modified retrieval algorithm, and further studies will be focused on this concept.
Considering the previous points appropriately, the technique is very useful because it is a compact in-line system that is quite simple to use. Moreover, it solves the stability problem of other spatiotemporal characterization techniques and enables the possibility of measuring with precision the wavefront resolved in the wavelength.
4. CONCLUSIONS
In conclusion, we have implemented a simple, compact, spatiotemporal characterization technique based on in-line bulk spectral interferometry using uniaxial birefringent crystals. We have applied our technique to characterized collimated ultrashort beams with complex spatiotemporal couplings. Its compactness provides high stability and grants the possibility of accurately measuring the wavefront of the pulses for the different wavelengths of the pulse.
We have successfully used it to characterize ultrashort optical vortices generated using S-waveplates. First, we have validated our technique by using two different configurations and measuring an optical vortex with constant orbital angular momentum. Moreover, we have combined the concepts of retarder plates and S-waveplates to generate two delayed optical vortices, which we have measured with the technique. The resulting beam presents an interesting evolution that corresponds to an optical vortex with time-varying orbital angular momentum, as discussed and verified through simulations.
The implemented technique can operate in all the transparency range of the birefringent crystals, opening the possibility of measuring spatiotemporal couplings with a simple system in different spectral ranges such as infrared, visible, or ultraviolet. Furthermore, it could possibly be adapted to characterize large bandwidth beams (such as few-cycle pulses) without the bandwidth limitations of the beam-splitting elements present in other techniques.
Acknowledgment
Acknowledgment. M. López-Ripa thanks the University of Salamanca for the Ph.D. contract.
References
[1] Q. Cao, J. Chen, K. Lu, C. Wan, A. Chong, Q. Zhan. Sculpturing spatiotemporal wavepackets with chirped pulses. Photon. Res., 9, 2261-2264(2021).
[2] Y. Zhao, L. Wang, W. Chen, P. Loiko, X. Mateos, X. Xu, Y. Liu, D. Shen, Z. Wang, X. Xu, U. Griebner, V. Petrov. Structured laser beams: toward 2-μm femtosecond laser vortices. Photon. Res., 9, 357-363(2021).
[3] B. K. McFarland, J. P. Farrell, P. H. Bucksbaum, M. Gühr. High harmonic generation from multiple orbitals in N2. Science, 322, 1232-1235(2008).
[4] S. Ghimire, D. A. Reis. High-harmonic generation from solids. Nat. Phys., 15, 10-16(2019).
[5] R. R. Gattass, E. Mazur. Femtosecond laser micromachining in transparent materials. Nat. Photonics, 2, 219-225(2008).
[6] F. Chen, J. R. Vázquez de Aldana. Optical waveguides in crystalline dielectric materials produced by femtosecond-laser micromachining. Laser Photon. Rev., 8, 251-275(2014).
[7] J. Lin, Y. Xu, Z. Fang, M. Wang, J. Song, N. Wang, L. Qiao, W. Fang, Y. Cheng. Fabrication of high-
[8] W. H. Knox. Ultrafast technology in telecommunications. IEEE J. Sel. Top. Quantum Electron., 6, 1273-1278(2000).
[9] K. I. Willig, S. O. Rizzoli, V. Westphal, R. Jahn, S. W. Hell. STED microscopy reveals that synaptotagmin remains clustered after synaptic vesicle exocytosis. Nature, 440, 935-939(2006).
[10] I. A. Walmsley, C. Dorrer. Characterization of ultrashort electromagnetic pulses. Adv. Opt. Photon., 1, 308-437(2009).
[11] I. Sytcevich, C. Guo, S. Mikaelsson, J. Vogelsang, A.-L. Viotti, B. Alonso, R. Romero, P. T. Guerreiro, Í. J. Sola, A. L’Huillier, H. Crespo, M. Miranda, C. L. Arnold. Characterizing ultrashort laser pulses with second harmonic dispersion scans. J. Opt. Soc. Am. B, 38, 1546-1555(2021).
[12] B. Alonso, W. Holgado, Í. J. Sola. Compact in-line temporal measurement of laser pulses with amplitude swing. Opt. Express, 28, 15625-15640(2020).
[13] Z. Bor. Distortion of femtosecond laser pulses in lenses. Opt. Lett., 14, 119-121(1989).
[14] Z. Sacks, G. Mourou, R. Danielius. Adjusting pulse-front tilt and pulse duration by use of a single-shot autocorrelator. Opt. Lett., 26, 462-464(2001).
[15] A. Jeandet, S. W. Jolly, A. Borot, B. Bussière, P. Dumont, J. Gautier, O. Gobert, J.-P. Goddet, A. Gonsalves, A. Irman, W. P. Leemans, R. Lopez-Martens, G. Mennerat, K. Nakamura, M. Ouillé, G. Pariente, M. Pittman, T. Püschel, F. Sanson, F. Sylla, C. Thaury, K. Zeil, F. Quéré. A survey of spatio-temporal couplings throughout high-power ultrashort lasers. Opt. Express, 30, 3262-3288(2022).
[16] P. Bowlan, P. Gabolde, A. Shreenath, K. McGresham, R. Trebino, S. Akturk. Crossed-beam spectral interferometry: a simple, high-spectral-resolution method for completely characterizing complex ultrashort pulses in real time. Opt. Express, 14, 11892-11900(2006).
[17] P. Gabolde, R. Trebino. Single-shot measurement of the full spatio-temporal field of ultrashort pulses with multi-spectral digital holography. Opt. Express, 14, 11460-11467(2006).
[18] F. Bonaretti, D. Faccio, M. Clerici, J. Biegert, P. Di Trapani. Spatiotemporal amplitude and phase retrieval of Bessel-X pulses using a Hartmann-Shack sensor. Opt. Express, 17, 9804-9809(2009).
[19] B. Alonso, Í. J. Sola, Ó. Varela, J. Hernández-Toro, C. Méndez, J. San Román, A. Zaïr, L. Roso. Spatiotemporal amplitude-and-phase reconstruction by Fourier-transform of interference spectra of high-complex-beams. J. Opt. Soc. Am. B, 27, 933-940(2010).
[20] G. Pariente, V. Gallet, A. Borot, O. Gobert, F. Quéré. Space–time characterization of ultra-intense femtosecond laser beams. Nat. Photonics, 10, 547-553(2016).
[21] C. Dorrer. Spatiotemporal metrology of broadband optical pulses. IEEE J. Sel. Top. Quantum Electron., 25(2019).
[22] S. W. Jolly, O. Gobert, F. Quéré. Spatio-temporal characterization of ultrashort laser beams: a tutorial. J. Opt., 22, 103501(2020).
[23] C. Dorrer, I. A. Walmsley. Simple linear technique for the measurement of space–time coupling in ultrashort optical pulses. Opt. Lett., 27, 1947-1949(2002).
[24] M. Françon. Polarization apparatus for interference microscopy and macroscopy of isotropic transparent objects. J. Opt. Soc. Am., 47, 528-535(1957).
[25] C. Zhang, B. Zhao, B. Xiangli. Wide-field-of-view polarization interference imaging spectrometer. Appl. Opt., 43, 6090-6094(2004).
[26] T. Mu, C. Zhang, Q. Li, L. Zhang, Y. Wei, Q. Chen. Achromatic Savart polariscope: choice of materials. Opt. Express, 22, 5043-5051(2014).
[27] N. Quan, C. Zhang, T. Mu. Modified Savart polariscope with wide field of view and achromatic lateral displacement. Opt. Commun., 382, 392-398(2017).
[28] P. Beyersdorf, M. Cordier. Measurement of thermo-elastic deformation of an optic using a polarization-based shearing interferometer. Appl. Opt., 51, 7426-7433(2012).
[29] F. Flossmann, U. T. Schwarz, M. Maier, M. R. Dennis. Stokes parameters in the unfolding of an optical vortex through a birefringent crystal. Opt. Express, 14, 11402-11411(2006).
[30] Y. Shen, X. Wang, Z. Xie, C. Min, X. Fu, Q. Liu, M. Gong, X. Yuan. Optical vortices 30 years on: OAM manipulation from topological charge to multiple singularities. Light Sci. Appl., 8, 90(2019).
[31] R. Grunwald, T. Elsaesser, M. Bock. Spatio-temporal coherence mapping of few-cycle vortex pulses. Sci. Rep., 4, 7148(2014).
[32] L. Ma, P. Zhang, Z. Li, C. Liu, X. Li, Y. Zhang, R. Zhang, C. Cheng. Spatiotemporal evolutions of ultrashort vortex pulses generated by spiral multi-pinhole plate. Opt. Express, 25, 29864-29873(2017).
[33] A. Leblanc, A. Denoeud, L. Chopineau, G. Mennerat, Ph. Martin, F. Quéré. Plasma holograms for ultrahigh-intensity optics. Nat. Phys., 13, 440-443(2017).
[34] A. Denoeud, L. Chopineau, A. Leblanc, F. Quéré. Interaction of ultraintense laser vortices with plasma mirrors. Phys. Rev. Lett., 118, 033902(2017).
[35] M. Miranda, M. Kotur, P. Rudawski, C. Guo, A. Harth, A. L’Huillier, C. L. Arnold. Spatiotemporal characterization of ultrashort optical vortex pulses. J. Mod. Opt., 64, S1-S6(2017).
[36] A. Zdagkas, V. Nalla, N. Papasimakis, N. I. Zheludev. Spatio-temporal characterization of ultrashort vector pulses. APL Photon., 6, 116103(2021).
[37] S. W. Hancock, S. Zahedpour, A. Goffin, H. M. Milchberg. Free-space propagation of spatiotemporal optical vortices. Optica, 6, 1547-1553(2019).
[38] M. C. Simon, K. V. Gottschalk. Waves and rays in uniaxial birefringent crystals. Optik, 118, 457-470(2007).
[39] F. E. Veiras, L. I. Perez, M. T. Garea. Phase shift formulas in uniaxial media: an application to waveplates. Appl. Opt., 49, 2769-2777(2010).
[40] L. Lepetit, G. Chériaux, M. Joffre. Linear techniques of phase measurement by femtosecond spectral interferometry for applications in spectroscopy. J. Opt. Soc. Am. B, 12, 2467-2474(1995).
[41] I. Lopez-Quintas, W. Holgado, R. Drevinskas, P. G. Kazansky, Í. J. Sola, B. Alonso. Optical vortex production mediated by azimuthal index of radial polarization. J. Opt., 22, 095402(2020).
[42] B. Alonso, I. Lopez-Quintas, W. Holgado, R. Drevinskas, P. G. Kazansky, C. Hernández-García, Í. J. Sola. Complete spatiotemporal and polarization characterization of ultrafast vector beams. Commun. Phys., 3(2020).

Set citation alerts for the article
Please enter your email address
© Copyright 2018-2021 | Chinese Laser Press. All Rights Reserved 沪ICP备15018463号-20