• Spectroscopy and Spectral Analysis
  • Vol. 42, Issue 3, 713 (2022)
Nai-yun FAN*, Gui-shan LIU*;, Jing-jing ZHANG, Rui-rui YUAN, You-rui SUN, and Yue LI
Author Affiliations
  • School of Food & Wine, Ningxia University, Yinchuan 750021, China
  • show less
    DOI: 10.3964/j.issn.1000-0593(2022)03-0713-06 Cite this Article
    Nai-yun FAN, Gui-shan LIU, Jing-jing ZHANG, Rui-rui YUAN, You-rui SUN, Yue LI. Rapid Determination of TBARS Contents in Tan Mutton Using Hyperspectral Imaging[J]. Spectroscopy and Spectral Analysis, 2022, 42(3): 713 Copy Citation Text show less
    Linear fitting diagrams of measured and predicted values of TBARS contents(a): Raw-PLSR; (b): SG-PLSR; (c): De-trending-PLSR; (d): SG+De-trending-PLSR
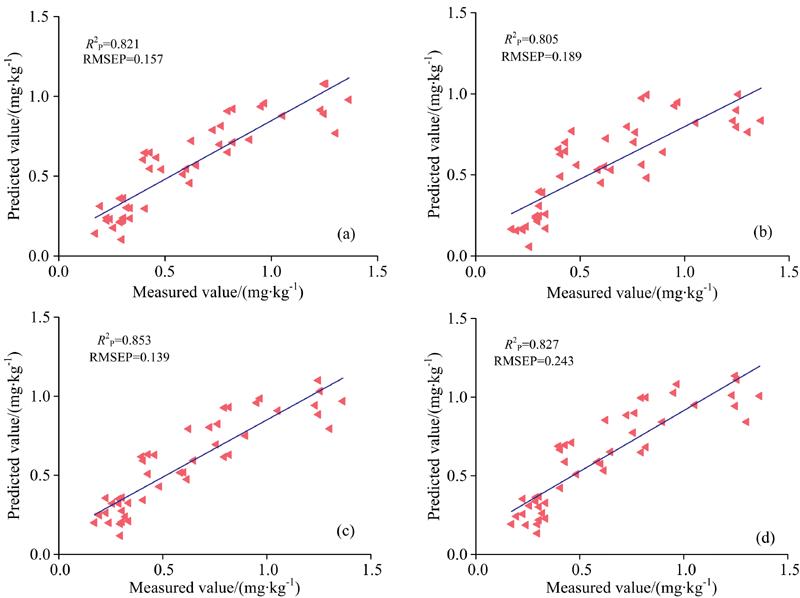
    Fig. 1. Linear fitting diagrams of measured and predicted values of TBARS contents
    (a): Raw-PLSR; (b): SG-PLSR; (c): De-trending-PLSR; (d): SG+De-trending-PLSR
    Two-dimensional correlation spectra and its slice spectra(a): Synchronous contour map; (b): Slice spectra
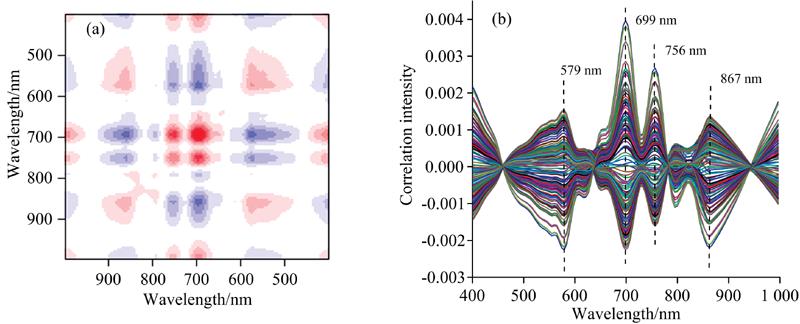
    Fig. 2. Two-dimensional correlation spectra and its slice spectra
    (a): Synchronous contour map; (b): Slice spectra
    Characteristic wavelength extracted by variable selection algorithm(a): VCPA algorithm; (b): SPA algorithm
    Fig. 3. Characteristic wavelength extracted by variable selection algorithm
    (a): VCPA algorithm; (b): SPA algorithm
    Data setSamplesTBARS contents/(mg·kg-1)
    MaxMinMeanStandard
    deviation
    Calibration set1351.470.160.670.30
    Prediction set451.370.170.610.35
    Table 1. Statistics of measured TBARS contents in Tan mutton
    Pretreatment
    method
    No.
    LV
    Calibration setCross-validationPrediction set
    RC2RMSEC/(mg·kg-1)RCV2RMSECV/(mg·kg-1)RP2RMSEP/(mg·kg-1)
    Raw170.8300.1230.7220.1590.8210.157
    SG200.8290.1230.7060.1640.8050.189
    de-trending200.8740.1060.7700.1440.8530.139
    SG+de-trending200.8500.1150.7490.1500.8270.243
    Table 2. PLSR modeling results of TBARS content with different pretreatment methods
    Wavelength/nm579699756867
    Synchronous
    579+--+
    699++-
    756+-
    867+
    Table 3. Signs of cross-peaks generated from two-dimensional correlation analysis
    Wavelength extraction methodVariable numberCharacteristic wavelength/nm
    FS+VCPA7636, 641, 646, 660, 675, 694, 915
    FS+CARS16415, 713, 727, 732, 751, 756, 785, 862, 895, 915, 924, 939, 958, 972, 977, 982
    FS+SPA20401, 449, 458, 468, 492, 516, 559, 593, 603, 631, 675, 723, 795, 819, 843, 852, 943, 953, 972, 987
    2DCOS+VCPA8631, 641, 646, 651, 660, 675, 689, 761
    2DCOS+CARS24588, 593, 598, 603, 612, 622, 631, 636, 646, 655, 675, 684, 689, 703, 713, 727, 742, 751, 775, 780, 790, 799, 809, 819
    2DCOS+SPA14593, 598, 603, 612, 622, 631, 641, 651, 660, 675, 689, 785, 809, 823
    Table 4. The results of extracting characteristic wavelengths
    Extraction
    method
    No.
    LV
    Calibration setCross-validationPrediction set
    RC2RMSEC/(mg·kg-1)RCV2RMSECV/(mg·kg-1)RP2RMSEP/(mg·kg-1)
    FS200.8740.1060.7700.1440.8530.139
    FS+VCPA70.7940.1350.7700.1430.8580.139
    FS+CARS150.8210.1260.7710.1430.8060.148
    FS+SPA190.7920.1360.7170.1590.8420.140
    2DCOS200.8500.1150.7510.1500.8540.139
    2DCOS+VCPA80.7950.1350.7690.1430.8390.146
    2DCOS+CARS190.8570.1130.7900.1370.8620.132
    2DCOS+SPA140.8150.1280.7710.1430.8450.143
    Table 5. Comparison of PLSR models based on different wavelength extraction methods
    Nai-yun FAN, Gui-shan LIU, Jing-jing ZHANG, Rui-rui YUAN, You-rui SUN, Yue LI. Rapid Determination of TBARS Contents in Tan Mutton Using Hyperspectral Imaging[J]. Spectroscopy and Spectral Analysis, 2022, 42(3): 713
    Download Citation