
Peng SUN, Shaoning ZHANG, Hui BI, Wujie DONG, Fuqiang HUANG. Tuning Nitrogen Species and Content in Carbon Materials through Constructing Variable Structures for Supercapacitors [J]. Journal of Inorganic Materials, 2021, 36(7): 766
- Journal of Inorganic Materials
- Vol. 36, Issue 7, 766 (2021)
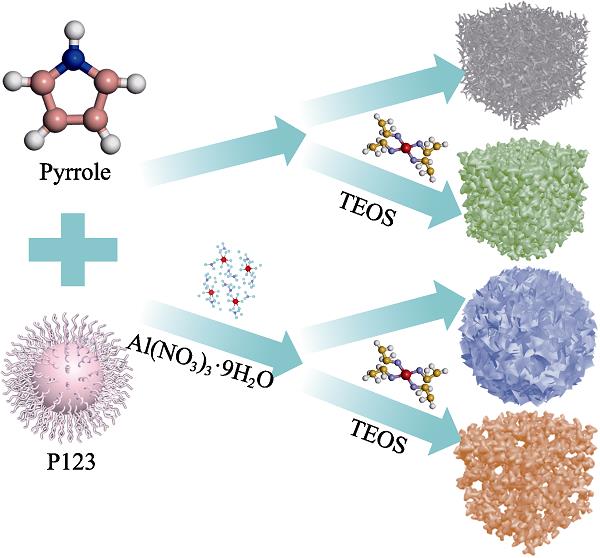
1. Schematic processing route from precursors to variable-structure carbon materials
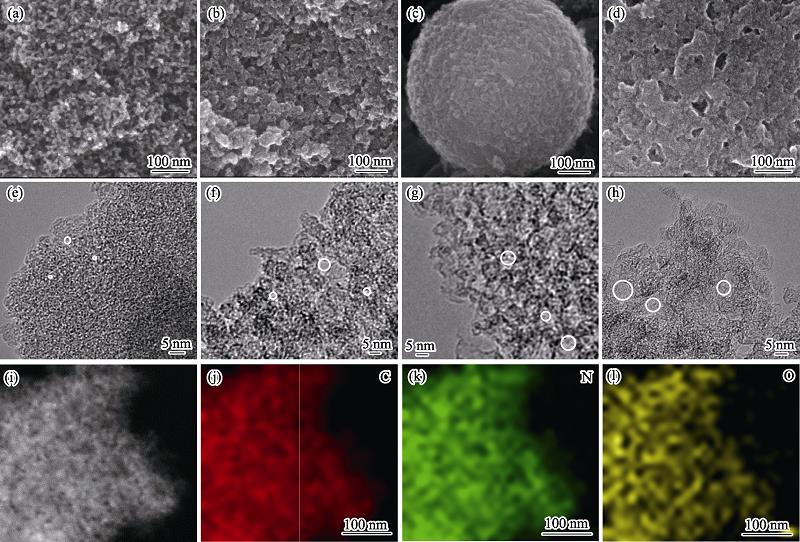
2. (a-d) SEM and (e-h) HRTEM images of (a, e) NC, (b, f) SiO-NC, (c, g) AlO-NC and (d, h) SiAlO-NC, and (i-l) energy dispersive spectroscopy (EDS) elemental mappings of SiAlO-NC
3. (a) Nitrogen adsorption-desorption isotherms and (b) pore size distributions of NC, SiO-NC, AlO-NC, SiAlO-NC (after removing templates), N1s XPS spectra of (c) NC, SiO-NC, AlO-NC, SiAlO-NC (after removing templates) and (d) SiO-NC, AlO-NC, SiAlO-NC (without removing templates)
4. (a) CV curves at 10 mV·s-1 and (b) galvanostatic charge/discharge (GCD) curves of NC, SiO-NC, AlO-NC, SiAlO-NC at 1 A·g-1 in three-electrode configuration; (c) CV curve of symmetric cell with SiAlO-NC, and (d) Ragone plots for SiAlO-NC and other nitrogen-carbon materials
S1. (a) Raman spectra and (b) XRD patterns of NC, SiO-NC, AlO-NC and SiAlO-NC
S2. C1s XPS spectrum of SiAlO-NC
S3. N1s XPS spectra of NC and SiAlO-NC at (a) 900 and (b) 1100 ℃
S4. (a) CV curve at 100 mV·s-1 and (b) GCD curve at 120 A·g-1 of SiAlO-NC in three-electrode configuration
S5. Specific capacitances calculated from GCD curves vs . current density for NC, SiO-NC, AlO-NC and SiAlO-NC
S6. Histograms of specific capacitance for SiAlO-NC at 1 A·g-1vs. the heating temperature
S7. Cycling performance of SiAlO-NC electrode measured in three-electrode configuration
S8. CV curve of SiAlO-NC electrode measured in symmetric electrochemical cell at 100 mV·s-1
S9. GCD curves of SiAlO-NC electrode measured in symmetric electrochemical cells at (a) different current densities and (b) 40 A·g-1
S10. Nyquist plots over 0.01 to 105 Hz of NC, SiO-NC, AlO-NC and SiAlO-NC based on the fittings using equivalent Randles circuit model(inset) in three-electrode configuration
S11. Electrochemical performance of the SiAlO-NC sample(a) Capacitance versus discharge time, t 1/2. Hollow symbols: CC test data, solid symbols: CV test data from 2 to 100 mV·s-1; Extrapolation of capacitance to t =0 gives a rate-independent capacitance; Instantaneous current of the SiAlO-NC sample at (b) 2 and (c) 50 mV·s-1, giving the shaded loop is the capacitive capacitance, and the region outside is the pseudocapacitance; (d) Fraction of capacitive capacitance C c in total capacitance C t
|
Table 1.
Characteristic summary of NC and SiAlO-NC
|
Table 1.
BET and elemental parameters of samples
|
Table 2.
Comparison of the specific capacitances, rate capabilities and cycling performances for previously reported N-doped porous carbon materials

Set citation alerts for the article
Please enter your email address
© Copyright 2018-2021 | Chinese Laser Press. All Rights Reserved 沪ICP备15018463号-20