• Photonics Research
  • Vol. 9, Issue 12, 2454 (2021)
Shibiao Wei1、2, Guiyuan Cao1、2, Han Lin2, Haoran Mu2, Wenbo Liu2, Xiaocong Yuan1, Michael Somekh1, and Baohua Jia2、3、*
Author Affiliations
  • 1Nanophotonics Research Center, Shenzhen Key Laboratory of Micro-Scale Optical Information Technology, Shenzhen University, Shenzhen 518060, China
  • 2Centre for Translational Atomaterials, Faculty of Engineering, Science and Technology, Swinburne University of Technology, Hawthorn, VIC 3122, Australia
  • 3The Australian Research Council (ARC) Industrial Transformation Training Centre in Surface Engineering for Advanced Materials (SEAM), Swinburne University of Technology, Hawthorn, VIC 3122, Australia
  • show less
    DOI: 10.1364/PRJ.434599 Cite this Article Set citation alerts
    Shibiao Wei, Guiyuan Cao, Han Lin, Haoran Mu, Wenbo Liu, Xiaocong Yuan, Michael Somekh, Baohua Jia. High tolerance detour-phase graphene-oxide flat lens[J]. Photonics Research, 2021, 9(12): 2454 Copy Citation Text show less
    Flexible lens design based on detour phase holography. (a) The principle of detour phase holography. (a1) Each slit in an infinite one-dimensional grating with periodically repeating apertures of period D acts as a quasi-point-source from which light propagates in all directions. First-order diffraction rays leaving adjacent grating apertures have a path difference of one wavelength; this wavefront is known as a plane wave. (a2) For a converging planar lens, a line-structure is designed to shape the wavefront as an off-axis converging wavefront. (b) Phase distribution along the radial direction of a converging lens. If one aperture of the grating is imperfectly located, the wavefront from the first diffraction order will be deformed. This is undesirable for an ordinary diffraction grating, but it provides a simple way to modify the relative phase value point by point of the first-order diffraction field to form the desired wavefront. (c) Schematic diagram of the flexible lens design. Detour phase holography lenses with the same focal length but different annular parameters (c1) and (c2) could be designed for different applications and fabrication capabilities.
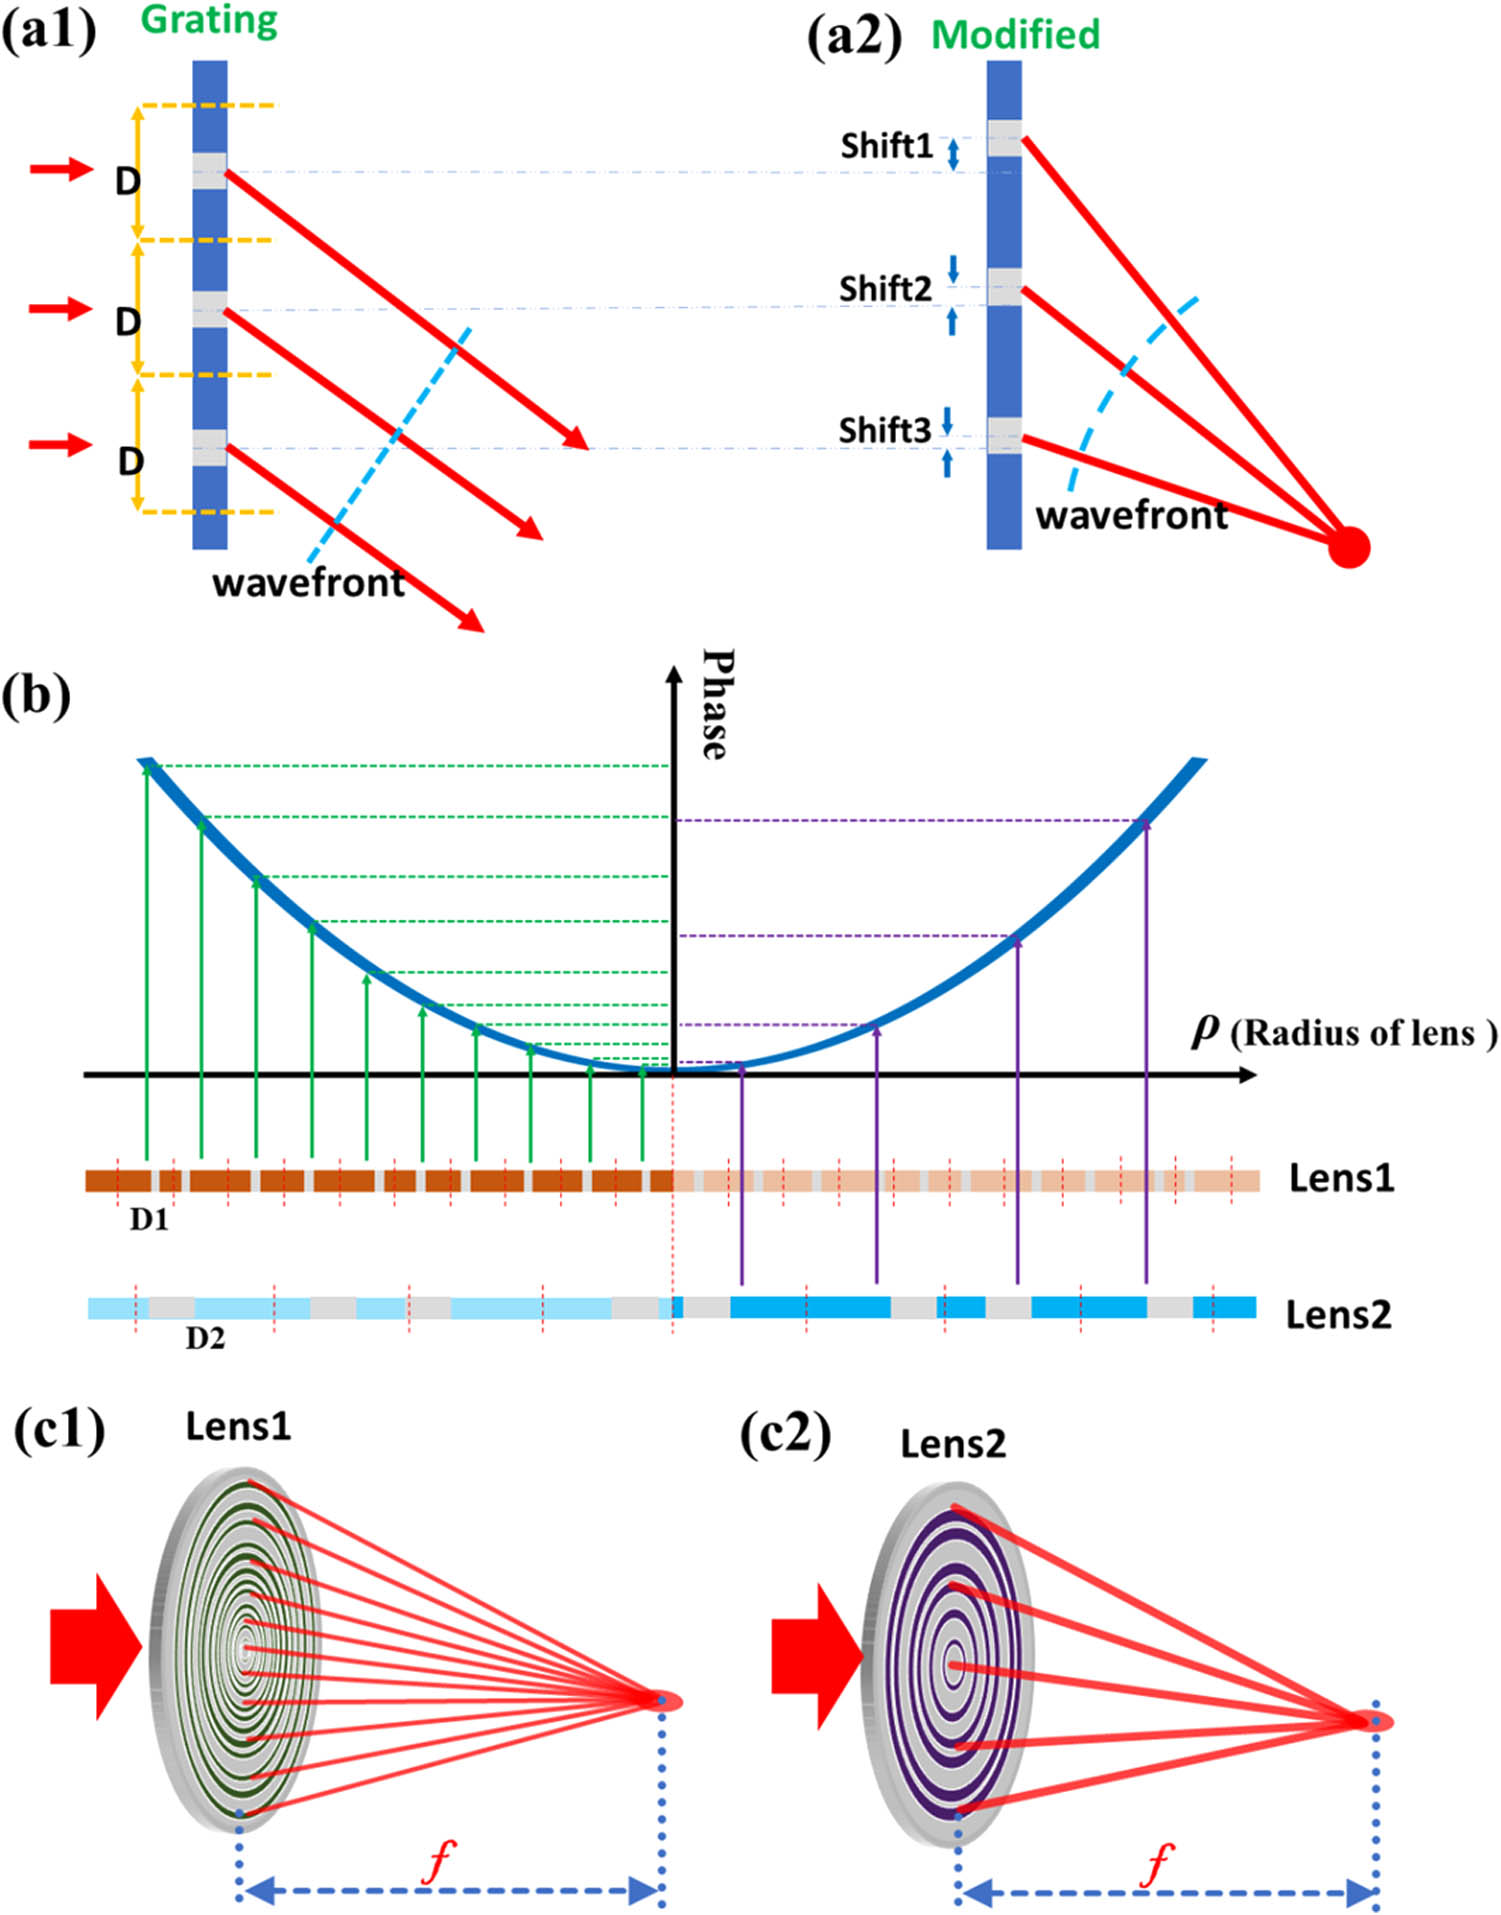
    Fig. 1. Flexible lens design based on detour phase holography. (a) The principle of detour phase holography. (a1) Each slit in an infinite one-dimensional grating with periodically repeating apertures of period D acts as a quasi-point-source from which light propagates in all directions. First-order diffraction rays leaving adjacent grating apertures have a path difference of one wavelength; this wavefront is known as a plane wave. (a2) For a converging planar lens, a line-structure is designed to shape the wavefront as an off-axis converging wavefront. (b) Phase distribution along the radial direction of a converging lens. If one aperture of the grating is imperfectly located, the wavefront from the first diffraction order will be deformed. This is undesirable for an ordinary diffraction grating, but it provides a simple way to modify the relative phase value point by point of the first-order diffraction field to form the desired wavefront. (c) Schematic diagram of the flexible lens design. Detour phase holography lenses with the same focal length but different annular parameters (c1) and (c2) could be designed for different applications and fabrication capabilities.
    Flexible GML fabrication. (a) Schematics for GML fabrication: (a1) a GO film was prepared on the glass substrate, followed by (a2) GML patterning of the GO using a mask-free femtosecond laser direct writing system. (b1)–(b5) Different lens designs with the same focal length, but with linewidths of the annular apertures of 0.5, 1.0, 1.5, 2.0, and 2.5 μm; the total number of annular apertures for these lenses is 74, 37, 23, 18, and 13, respectively. (c1)–(c5) The bright-field microscopic images of the fabricated GMLs corresponding to (b1)–(b5). (d) Optical profiler measurements of the GML in (c3), where the thickness of the GML film is 200 nm.
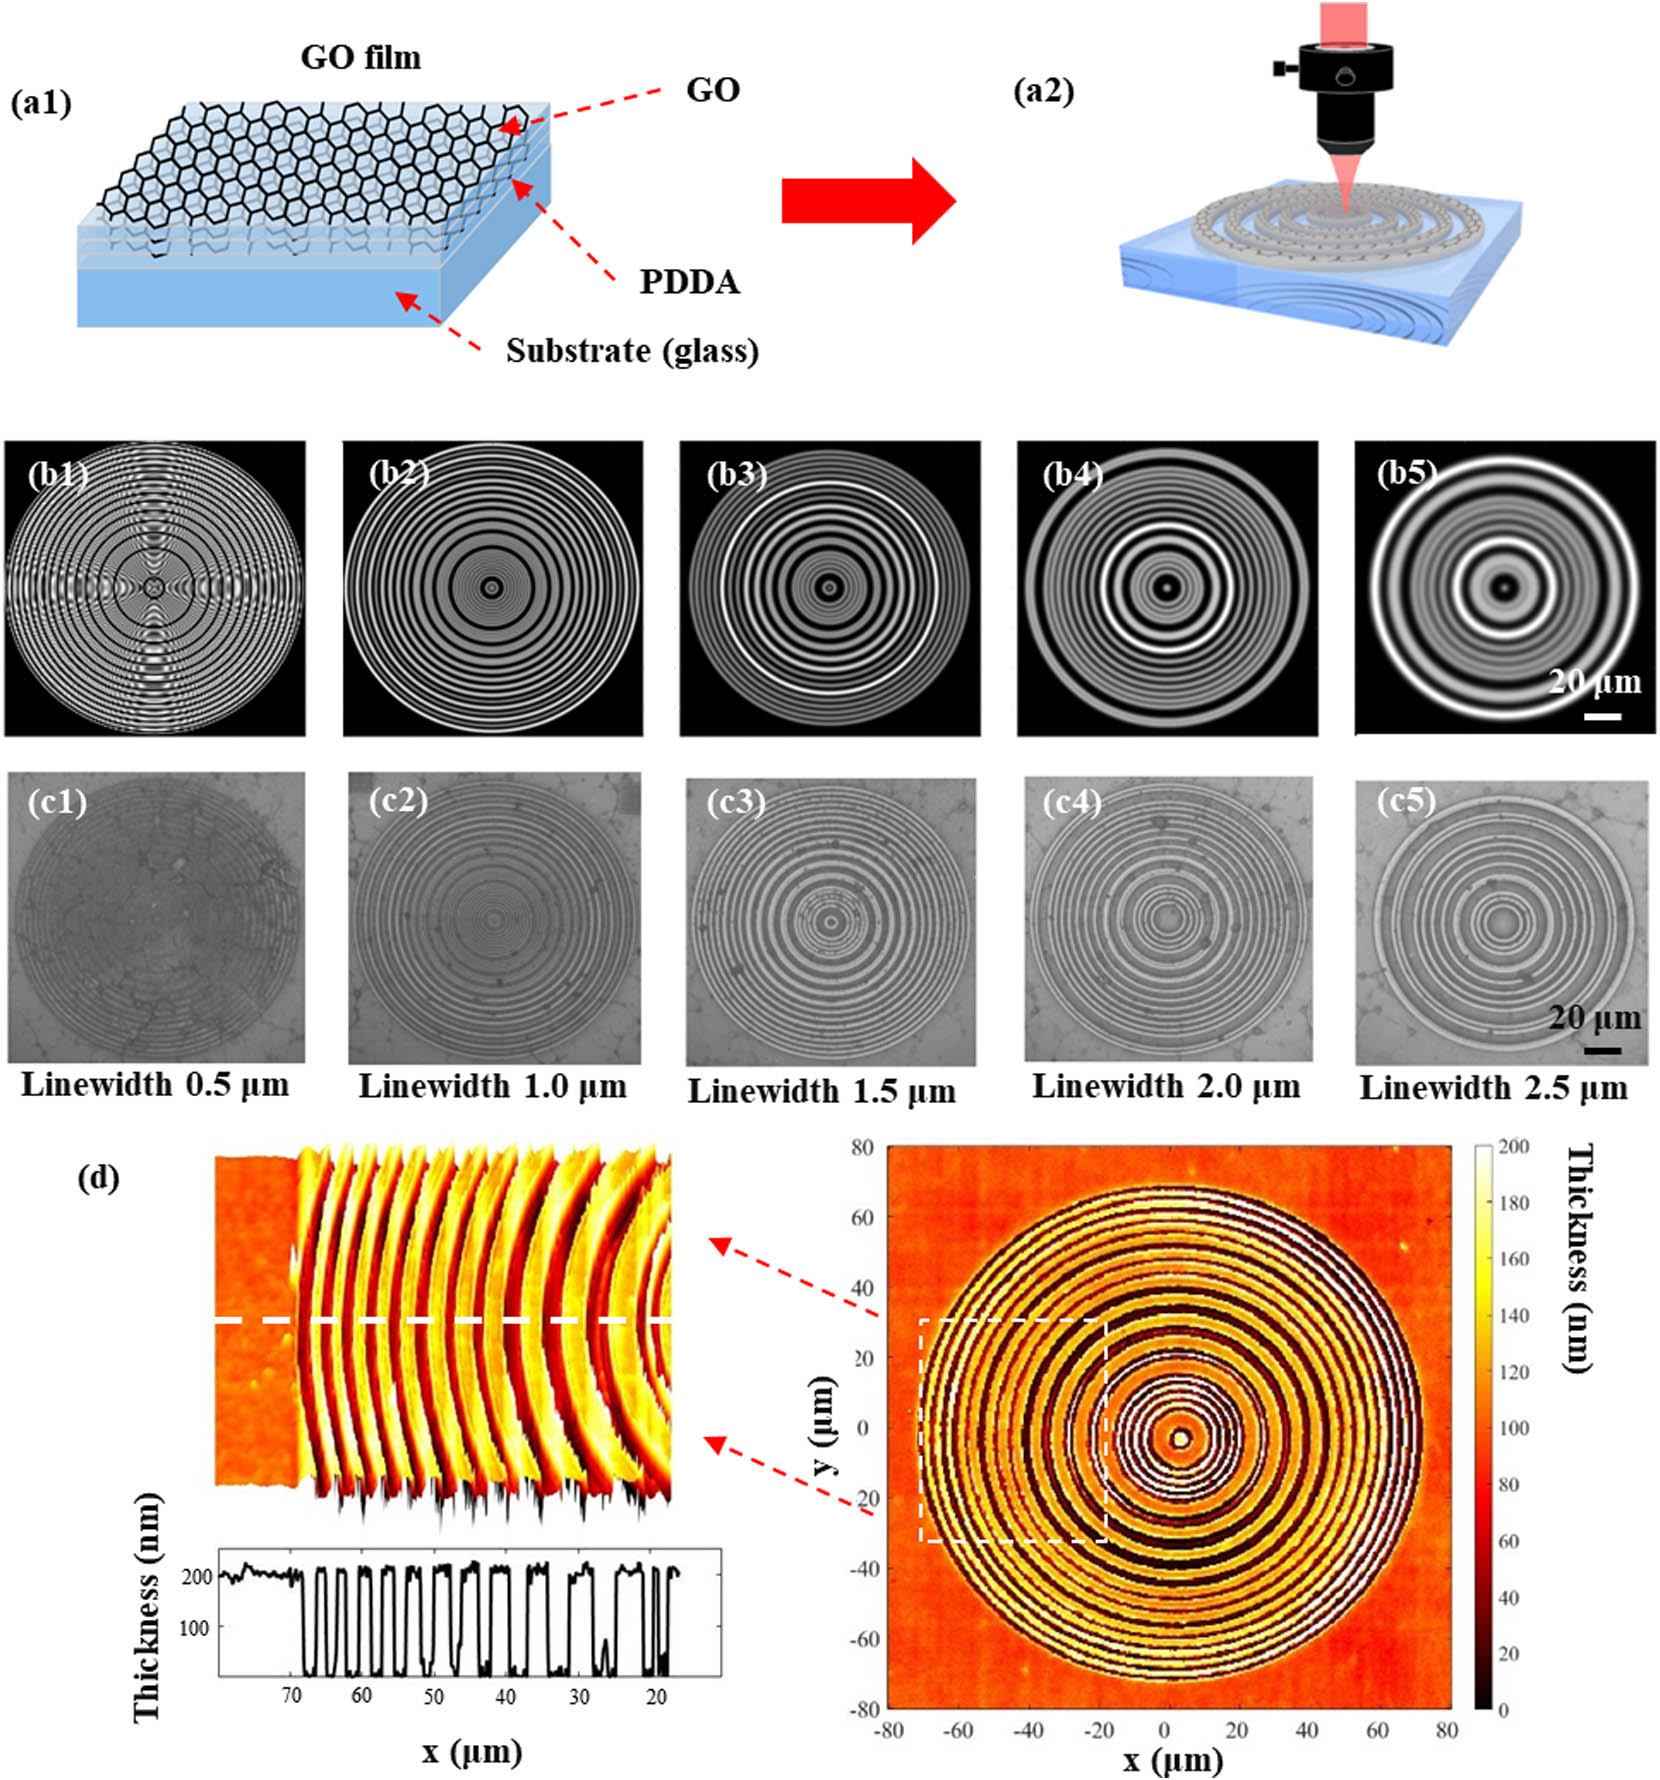
    Fig. 2. Flexible GML fabrication. (a) Schematics for GML fabrication: (a1) a GO film was prepared on the glass substrate, followed by (a2) GML patterning of the GO using a mask-free femtosecond laser direct writing system. (b1)–(b5) Different lens designs with the same focal length, but with linewidths of the annular apertures of 0.5, 1.0, 1.5, 2.0, and 2.5 μm; the total number of annular apertures for these lenses is 74, 37, 23, 18, and 13, respectively. (c1)–(c5) The bright-field microscopic images of the fabricated GMLs corresponding to (b1)–(b5). (d) Optical profiler measurements of the GML in (c3), where the thickness of the GML film is 200 nm.
    Schematic of the experimental setup. A 633 nm collimated He–Ne laser was used as the incident light source. A beam expansion (BE) lens group was used to expand the laser beam to obtain an approximate plane wave. An objective (OBJ) with NA=0.8 was used to collect the beam into a CCD camera. The objective was mounted on a controllable one-dimensional piezo stage. By scanning along the optical axis, the 3D focal intensity distributions of the GMLs were obtained.
    Fig. 3. Schematic of the experimental setup. A 633 nm collimated He–Ne laser was used as the incident light source. A beam expansion (BE) lens group was used to expand the laser beam to obtain an approximate plane wave. An objective (OBJ) with NA=0.8 was used to collect the beam into a CCD camera. The objective was mounted on a controllable one-dimensional piezo stage. By scanning along the optical axis, the 3D focal intensity distributions of the GMLs were obtained.
    Experimental characterization. (a1)–(a5) Experimental measurements of longitudinal intensity distribution results of GMLs with different linewidths of the ring-shaped aperture ranging from 0.5 to 2.5 μm. (b1)–(b5) The corresponding theoretical focusing intensity distributions of (a1)–(a5). (c1)–(c5) The experimental and calculated cross-sectional intensity distributions on the focal planes of the five GMLs. (d1)–(d5) The experimental and calculated cross-sectional intensity distributions along the optical axis. The lateral sizes of the focal spot show good agreement between the experimental and theoretical results. The maximal deviation of the focusing position is approximately 5 μm, which is about 1.6% of the focal length (300 μm). All intensity values are normalized to the peak value of intensity.
    Fig. 4. Experimental characterization. (a1)–(a5) Experimental measurements of longitudinal intensity distribution results of GMLs with different linewidths of the ring-shaped aperture ranging from 0.5 to 2.5 μm. (b1)–(b5) The corresponding theoretical focusing intensity distributions of (a1)–(a5). (c1)–(c5) The experimental and calculated cross-sectional intensity distributions on the focal planes of the five GMLs. (d1)–(d5) The experimental and calculated cross-sectional intensity distributions along the optical axis. The lateral sizes of the focal spot show good agreement between the experimental and theoretical results. The maximal deviation of the focusing position is approximately 5 μm, which is about 1.6% of the focal length (300 μm). All intensity values are normalized to the peak value of intensity.
    Phase controlling of the focal spot. (a), (b) The intensity and phase distribution of the focusing field for a GML (lens 1) with the focal length of 500 μm. (c), (d) The intensity and phase distribution of the focusing field for another lens (lens 2), which was obtained by adding a uniform phase value to lens 1. The focal spots of lenses 1 and 2 are the same for the intensity distribution, but the phase distributions crossing the focal plane are slightly modified. (e), (f) The phase distributions of lenses 1 and 2 across the focal plane along the optical axis. (g) The corresponding phase values of (e) (blue) and (f) (red). There is a 0.1π shift of phase value between lenses 1 and 2. (h) The relationship of the additional phase shift of the lens and the phase shift of the focal plane. 0 to 2π phase value shifts of focal spot could be obtained by considering the additional phase shift in the lens design.
    Fig. 5. Phase controlling of the focal spot. (a), (b) The intensity and phase distribution of the focusing field for a GML (lens 1) with the focal length of 500 μm. (c), (d) The intensity and phase distribution of the focusing field for another lens (lens 2), which was obtained by adding a uniform phase value to lens 1. The focal spots of lenses 1 and 2 are the same for the intensity distribution, but the phase distributions crossing the focal plane are slightly modified. (e), (f) The phase distributions of lenses 1 and 2 across the focal plane along the optical axis. (g) The corresponding phase values of (e) (blue) and (f) (red). There is a 0.1π shift of phase value between lenses 1 and 2. (h) The relationship of the additional phase shift of the lens and the phase shift of the focal plane. 0 to 2π phase value shifts of focal spot could be obtained by considering the additional phase shift in the lens design.
    Focusing efficiencies of GMLs at different linewidths. The focusing efficiency changed when the linewidth of the GO structure changed. Both too dense sampling and too sparse sampling processes of the convergent wavefront will reduce the focusing efficiency of the lens. In the green area, the focusing efficiency of the GMLs did not change significantly.
    Fig. 6. Focusing efficiencies of GMLs at different linewidths. The focusing efficiency changed when the linewidth of the GO structure changed. Both too dense sampling and too sparse sampling processes of the convergent wavefront will reduce the focusing efficiency of the lens. In the green area, the focusing efficiency of the GMLs did not change significantly.
    Shibiao Wei, Guiyuan Cao, Han Lin, Haoran Mu, Wenbo Liu, Xiaocong Yuan, Michael Somekh, Baohua Jia. High tolerance detour-phase graphene-oxide flat lens[J]. Photonics Research, 2021, 9(12): 2454
    Download Citation