• Infrared and Laser Engineering
  • Vol. 50, Issue 11, 20210546 (2021)
Qiang Luo, Fang Bo, Yongfa Kong, Guoquan Zhang, and Jingjun Xu
Author Affiliations
  • MOE, Key Laboratory of Weak-Light Nonlinear Photonics, TEDA Institute of Applied Physics and School of Physics, Nankai University, Tianjin 300457, China
  • show less
    DOI: 10.3788/IRLA20210546 Cite this Article
    Qiang Luo, Fang Bo, Yongfa Kong, Guoquan Zhang, Jingjun Xu. Research progresses of microcavity lasers based on lithium niobate on insulator (Invited)[J]. Infrared and Laser Engineering, 2021, 50(11): 20210546 Copy Citation Text show less
    (a) Structure and concentration distribution of erbium doped by ion implantation[27]; (b) Structure and concentration distribution of ytterbium doped by ion implantation[28]; (c) Schematic diagram of Er-YSO bonding doping structure[30]; (d) Schematic diagram of thulium doped structure[26]
    Fig. 1. (a) Structure and concentration distribution of erbium doped by ion implantation[27]; (b) Structure and concentration distribution of ytterbium doped by ion implantation[28]; (c) Schematic diagram of Er-YSO bonding doping structure[30]; (d) Schematic diagram of thulium doped structure[26]
    Schematic diagram of preparation of Er-LNOI wafer by "smart cut" technology
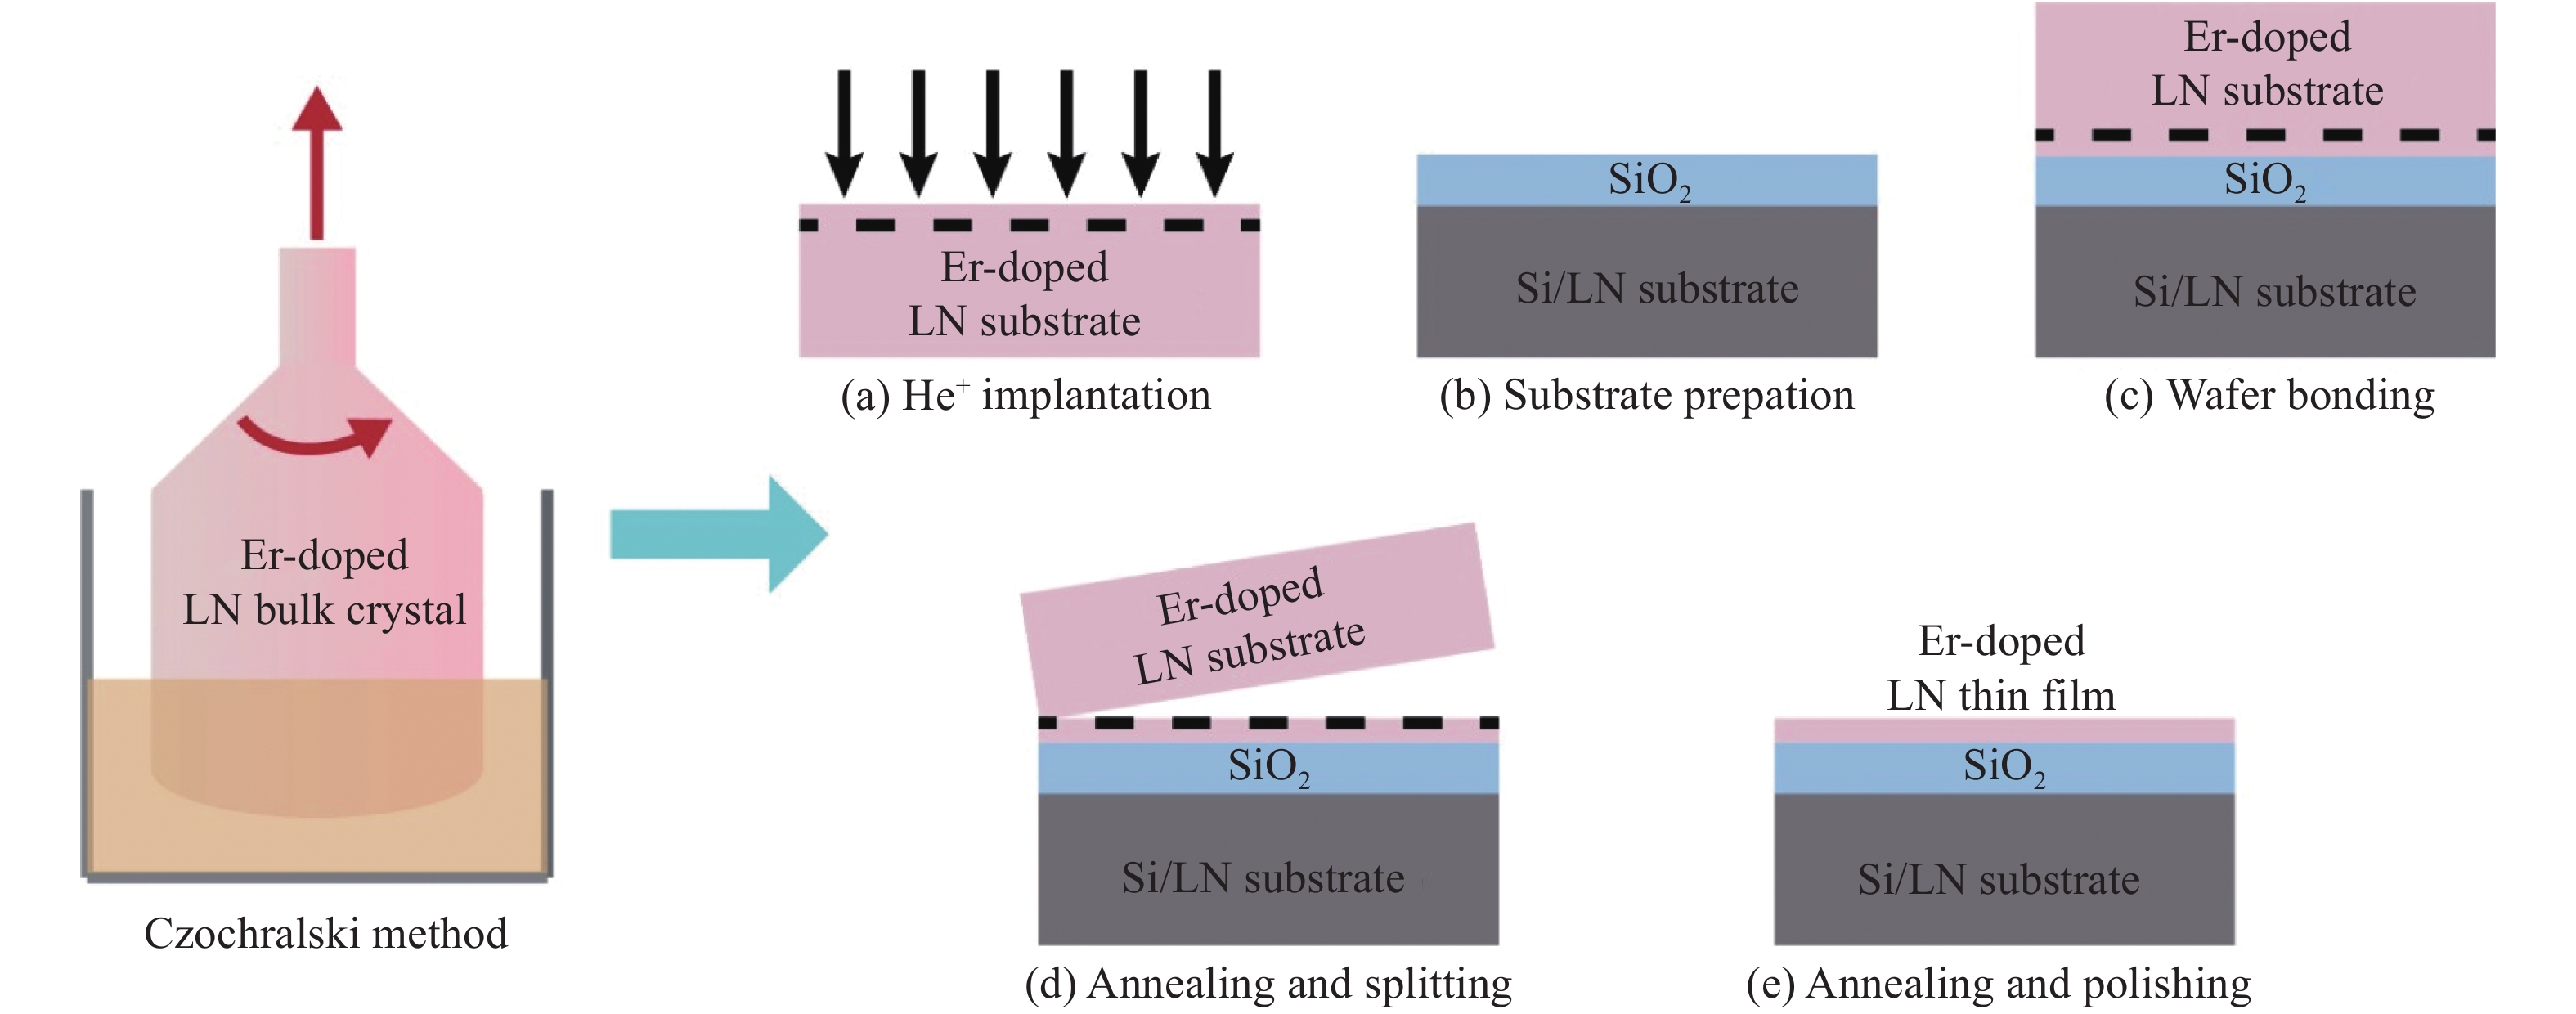
    Fig. 2. Schematic diagram of preparation of Er-LNOI wafer by "smart cut" technology
    (a) Schematic diagram of Er-LNOI microdisk cavity prepared by femtosecond laser photolithography assisted chemo-mechanical etching technique;(b) Relationship between the emitted laser power and the 976 nm pump power[34]
    Fig. 3. (a) Schematic diagram of Er-LNOI microdisk cavity prepared by femtosecond laser photolithography assisted chemo-mechanical etching technique;(b) Relationship between the emitted laser power and the 976 nm pump power[34]
    (a)-(c) Observed laser signal and linewidth with the 974 nm pump; (d) Relationship between the emitted laser power and the 974 nm pump power (Inset: the observed green up-conversion fluorescence); (e)-(g) Observed laser signal and linewidth with the 1 460 nm pump; (h) Relationship between the emitted laser power and the 1 460 nm pump power (Inset: the observed green up-conversion fluorescence)[35]
    Fig. 4. (a)-(c) Observed laser signal and linewidth with the 974 nm pump; (d) Relationship between the emitted laser power and the 974 nm pump power (Inset: the observed green up-conversion fluorescence); (e)-(g) Observed laser signal and linewidth with the 1 460 nm pump; (h) Relationship between the emitted laser power and the 1 460 nm pump power (Inset: the observed green up-conversion fluorescence)[35]
    (a) Spectrum evolution of the signal mode at different pump power; (b) Relationship between the signal power and the pump power[36]
    Fig. 5. (a) Spectrum evolution of the signal mode at different pump power; (b) Relationship between the signal power and the pump power[36]
    (a) Schematic diagram of the preparation process of the Er-LNOI micro-ring cavity and waveguide coupling structure; (b)-(d) Scanning electron microscope image of the coupling structure of microring and waveguide[37]
    Fig. 6. (a) Schematic diagram of the preparation process of the Er-LNOI micro-ring cavity and waveguide coupling structure; (b)-(d) Scanning electron microscope image of the coupling structure of microring and waveguide[37]
    (a) Collected signal spectrum in the range of 1 531.50-1 532.65 nm at 46.4 μW pump power; (b) Multi-peak lasing signal observed at a pump power of ~1 mW (Inset: the observed green up-conversion fluorescence); (c) Power and (d) linewidth of the signal mode under different pump powers[37]
    Fig. 7. (a) Collected signal spectrum in the range of 1 531.50-1 532.65 nm at 46.4 μW pump power; (b) Multi-peak lasing signal observed at a pump power of ~1 mW (Inset: the observed green up-conversion fluorescence); (c) Power and (d) linewidth of the signal mode under different pump powers[37]
    [in Chinese]
    Fig. 7. [in Chinese]
    (a) Spectral evolution of the Er-LNOI racetrack microring resonator with increasing input pump powers; (b) Relationship between the emitted laser output power and the input pump power; (c) Laser signal wavelength by varying the electric voltage between −300 V and +300 V[38]
    Fig. 8. (a) Spectral evolution of the Er-LNOI racetrack microring resonator with increasing input pump powers; (b) Relationship between the emitted laser output power and the input pump power; (c) Laser signal wavelength by varying the electric voltage between −300 V and +300 V[38]
    [in Chinese]
    Fig. 8. [in Chinese]
    (a) Increasing single-mode lasing signal with increasing pump power; (b) Spectrum of pump laser (Inset: optical micrograph of coupled microdisks with pump laser); (c) Relationship between signal output power and pump power (Inset: optical micrograph of coupled microdisks when lasing)[40]
    Fig. 9. (a) Increasing single-mode lasing signal with increasing pump power; (b) Spectrum of pump laser (Inset: optical micrograph of coupled microdisks with pump laser); (c) Relationship between signal output power and pump power (Inset: optical micrograph of coupled microdisks when lasing)[40]
    (a) Single mode emission of Er-LNOI optical molecules in the range of 1500-1560 nm under different pump powers; (b) Output power and mode linewidth of single-mode laser at different pump powers; (c) Observed high side-mode suppression ratio signal (~26.3 dB) at a pump power of 900 μW (Inset: the observed green up conversion fluorescence)[41]
    Fig. 10. (a) Single mode emission of Er-LNOI optical molecules in the range of 1500-1560 nm under different pump powers; (b) Output power and mode linewidth of single-mode laser at different pump powers; (c) Observed high side-mode suppression ratio signal (~26.3 dB) at a pump power of 900 μW (Inset: the observed green up conversion fluorescence)[41]
    (a)-(b) Schematic diagram of Er-LNOI dual cavity structure and vernier effect[42]; (c) SEM of prepared Er-LNOI single microring cavity; (d) Mode field distribution of the first four modes supported in microring cavity waveguide[43]
    Fig. 11. (a)-(b) Schematic diagram of Er-LNOI dual cavity structure and vernier effect[42]; (c) SEM of prepared Er-LNOI single microring cavity; (d) Mode field distribution of the first four modes supported in microring cavity waveguide[43]
    (a) Spectra of the output power of the Er-LNOI single mode laser at different pump powers; (b) Optical micrograph of the square lasing modes at 1 546 nm wavelength (Inset: the optical micrographs of the square modes of the up-conversion fluorescence around 550 nm wavelength (Left) and the pump light (Right))[44]
    Fig. 12. (a) Spectra of the output power of the Er-LNOI single mode laser at different pump powers; (b) Optical micrograph of the square lasing modes at 1 546 nm wavelength (Inset: the optical micrographs of the square modes of the up-conversion fluorescence around 550 nm wavelength (Left) and the pump light (Right))[44]
    StructurePump wavelength/nmThresholdConversion efficiencyMaximum powerLinewidthModelReferences
    Microdisk9742.99 mW4.117×10−4% ~40 nW0.12 nmMultimode[35]
    14609.31 mW3.15×10−3% ~500 nW0.14 nmMultimode
    Microdisk976<400 μW1.92×10−2% ~140 nW0.024 nmMultimode[34]
    Microdisk974292 μW6.5×10−5% ~0.4 nW~0.01 nmMultimode[36]
    Microring974~20 μW6.61×10−5% ~0.1 nW~0.01 nmMultimode[37]
    Microring~980~3.5 mW4.38×10−3% ~35 nW-Multimode[38]
    Coupling microrings977.7~200 μW7×10−3% ~50 nW348 kHzSingle mode[40]
    Coupling microrings979.6~200 μW4.4×10−3% ~40 nW~0.005 nmSingle mode[41]
    Coupling microrings148413.54 mW1.45×10−2% 0.31 μW1.2 MHzSingle mode[42]
    Microring148414.5 mW1.2×10−2% 2.1 μW1.27 MHzSingle mode[43]
    Microdisk968~25 μW1.3×10−2% 2 μW98 HzSingle mode[44]
    Table 1. Comparison of performance parameters of the reported LNOI microcavity lasers
    Qiang Luo, Fang Bo, Yongfa Kong, Guoquan Zhang, Jingjun Xu. Research progresses of microcavity lasers based on lithium niobate on insulator (Invited)[J]. Infrared and Laser Engineering, 2021, 50(11): 20210546
    Download Citation