
Yuansheng Tao, Haowen Shu, Xingjun Wang, Ming Jin, Zihan Tao, Fenghe Yang, Jingbo Shi, Jun Qin. Hybrid-integrated high-performance microwave photonic filter with switchable response[J]. Photonics Research, 2021, 9(8): 1569
- Photonics Research
- Vol. 9, Issue 8, 1569 (2021)
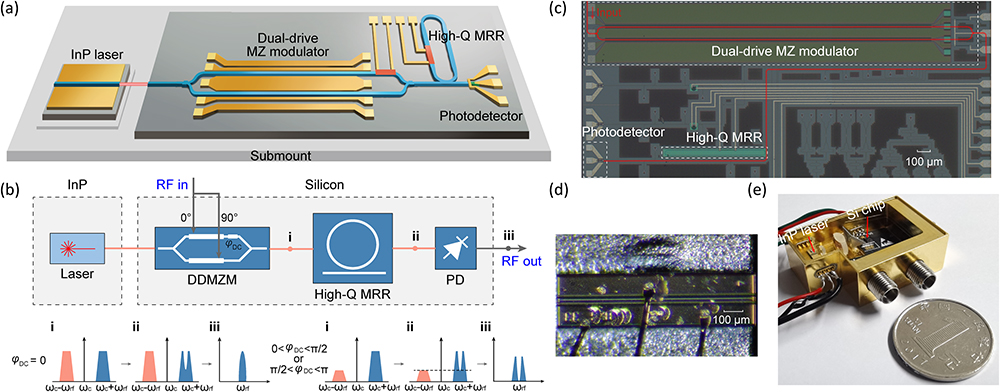
Fig. 1. (a) Schematic diagram of the hybrid integrated MPF. (b) The operation principles for the bandpass/band-stop switchable filtering response of the integrated MPF. (c) Optical image of the fabricated silicon chip. (d) Optical image of the InP laser diode chip. (e) Photograph of the packaged hybrid integrated MPF that comprises an InP laser, a silicon chip, and auxiliary microlenses and prism.
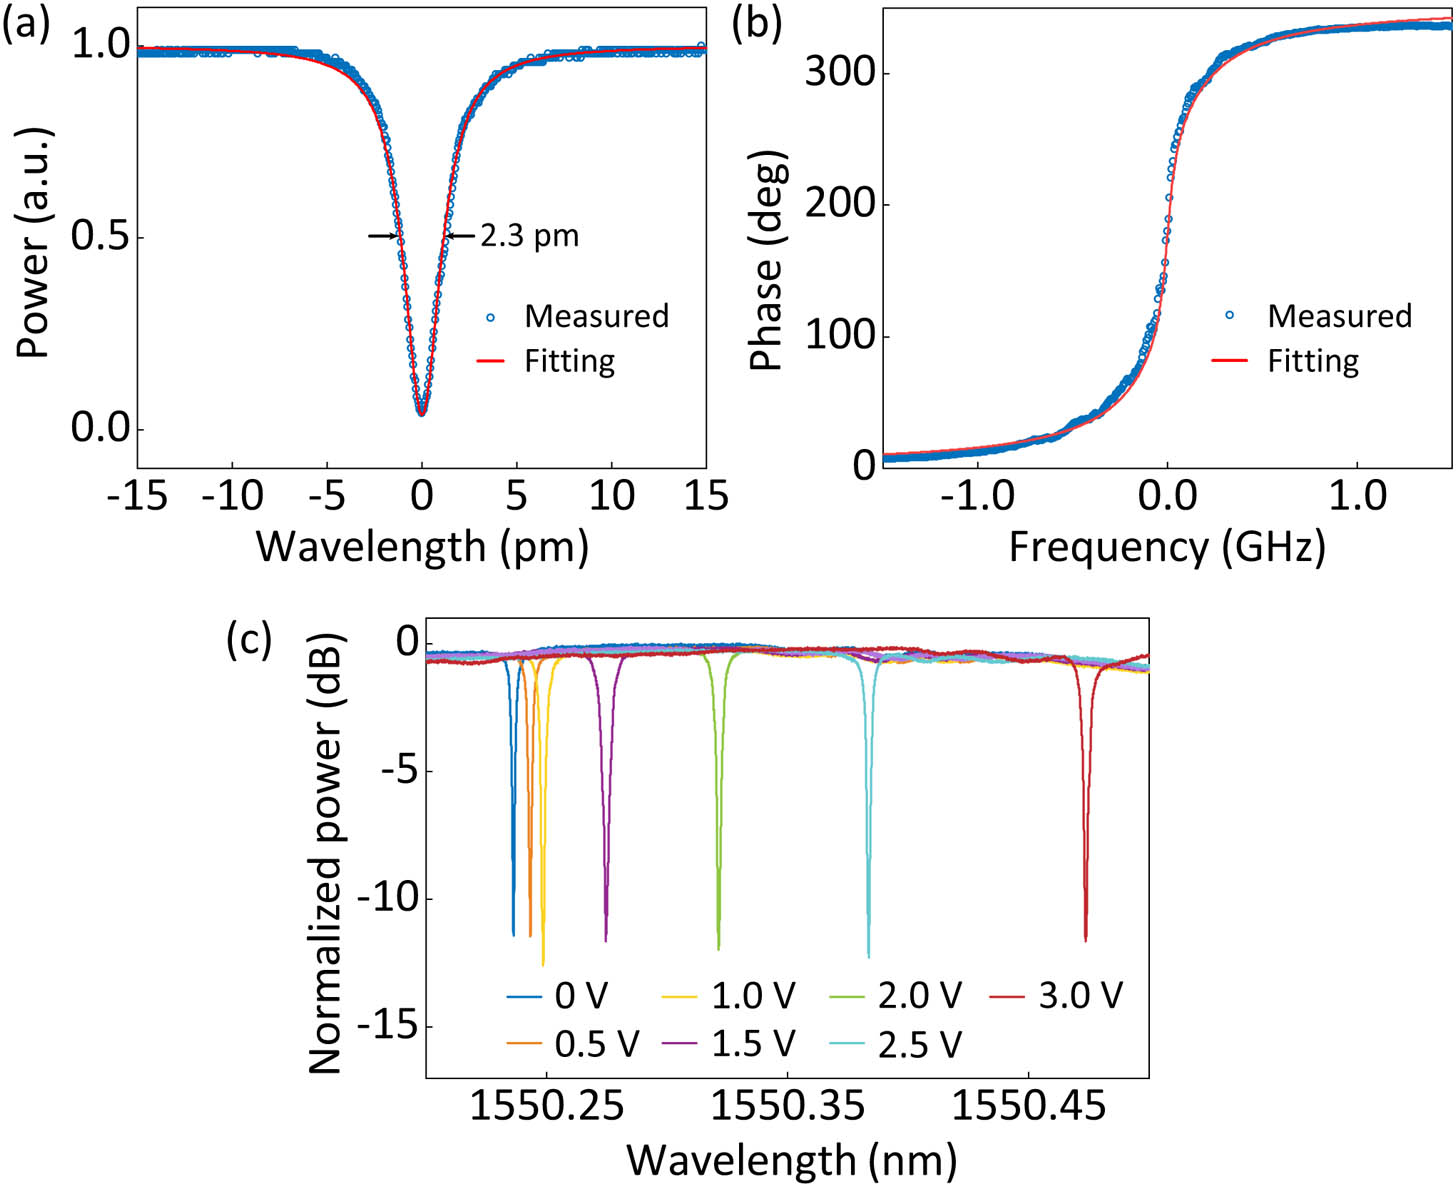
Fig. 2. (a) Measured transmission spectrum of the high-Q Q
Fig. 3. (a) Measured output spectra of the InP-based laser chip under different operation temperatures. (b) DSH linewidth measurement (blue dots) and a Voigt curve fit (red line) show a 3 dB Lorentzian linewidth of 150 kHz.
Fig. 4. Experimental setup to measure the band-stop/bandpass filtering response of the integrated MPF.
Fig. 5. (a) Measured RF responses of the band-stop filtering at various center frequencies. (b) 3 dB bandwidths and rejection ratios are plotted versus RF frequencies.
Fig. 6. (a) Measured RF responses of the bandpass filtering at different center frequencies. (b) 3 dB bandwidths and rejection ratios are plotted versus RF frequencies.
Fig. 7. Experimental results for the hybrid all-integrated MPF with package. (a) Measured RF spectra of the band-stop filtering. (b) Measured RF spectra of the bandpass filtering. (c) Measured S 21
Fig. 8. (a) Measured RF link gain and noise figure over the whole tunable frequency range. (b) Measured power of the fundamental (FUND) component and the third-order intermodulation (IMD3) component versus different input RF power.
Fig. 9. High-resolution RF filtering using the integrated MPF as a band-stop filter. The input contains two frequency components (signal at 15 GHz and interferer at 15.25 GHz). (a) Measured RF spectrum when the input is located outside the stopband. (b) Measured RF spectrum when the interferer is filtered by the stop band.
Fig. 10. High-resolution RF filtering using the integrated MPF as a bandpass filter. The input contains two channel signals, i.e., channel 1 (CH1, 11 GHz) and channel 2 (CH2, 13 GHz). (a) Measured RF spectrum when the CH1 is located at the passband. (b) Measured RF spectrum when the CH2 is located at the passband.
Fig. 11. (a) Beam propagation simulation for the hybrid integration of the InP laser and Si chip utilizing micro-optics. (b) Measured total coupling loss between these two chips. Green line: InP laser output subtracting all link propagation loss except coupling loss. Orange line: optical power measured from the monitor grating located behind the DDMZM.
Fig. 12. (a) Measured S 21 S 21
Fig. 13. (a) Measurement of the band-stop filter rejection ratio over 1 h continuous operation. (b) Measurement of the 3 dB bandwidth over 1 h continuous operation.
Fig. 14. Time-domain measurement of the TiN microheater placed on the DDMZM. (a) Temporal waveform of the applied square-wave electrical signal. (b) Measured temporal response with a rise/fall time of 15 and 48 μs.
|
Table 1. Performance Comparison of State-of-the-Art Integrated MPFs and Electronic Microwave Filters

Set citation alerts for the article
Please enter your email address
© Copyright 2018-2021 | Chinese Laser Press. All Rights Reserved 沪ICP备15018463号-20