Author Affiliations
College of Electrical and Electronic Engineering, North China Electric Power University, Baoding, Hebei 071003, Chinashow less
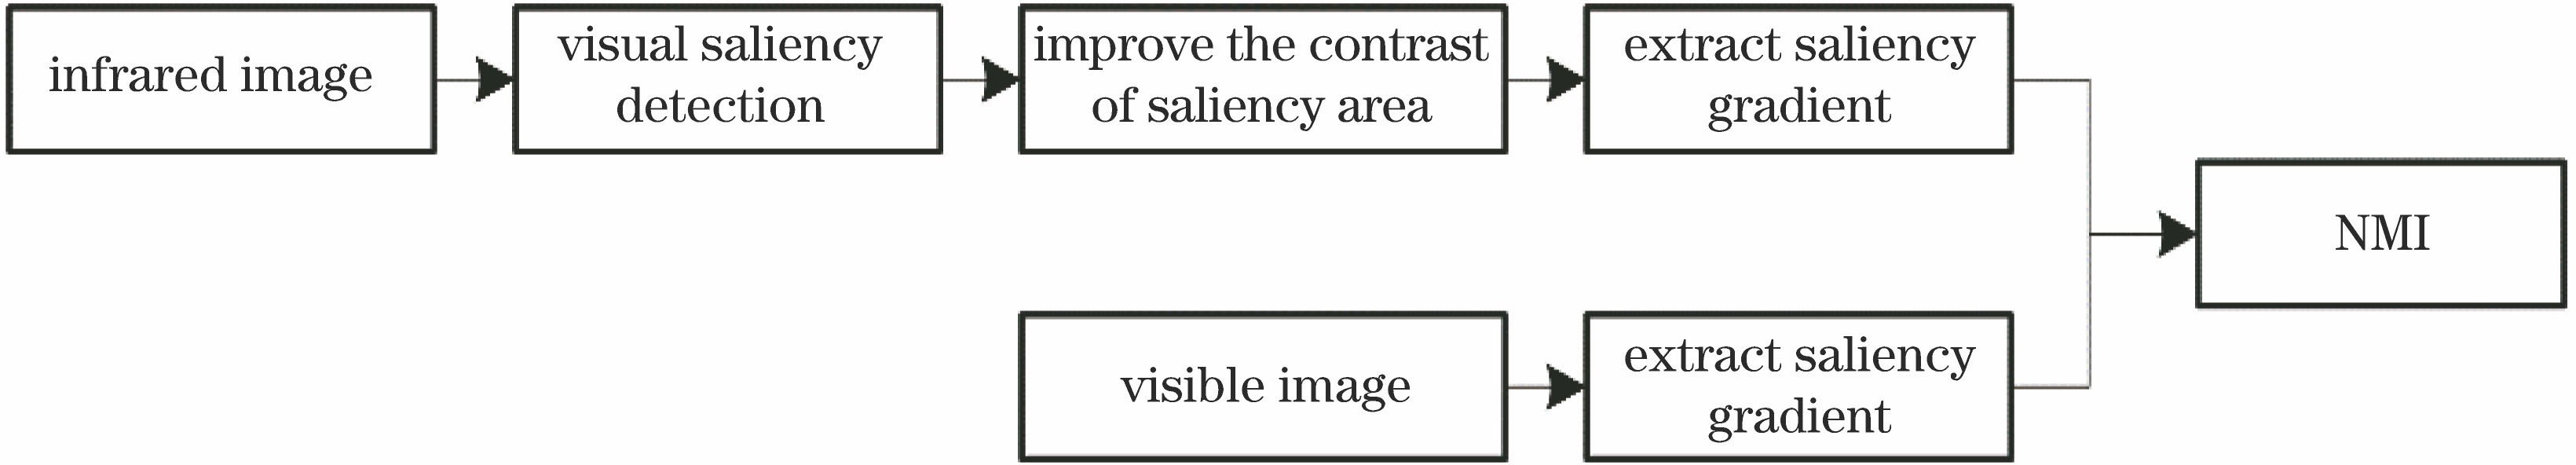
Fig. 1. Flow chart of SGNMI measurement algorithm
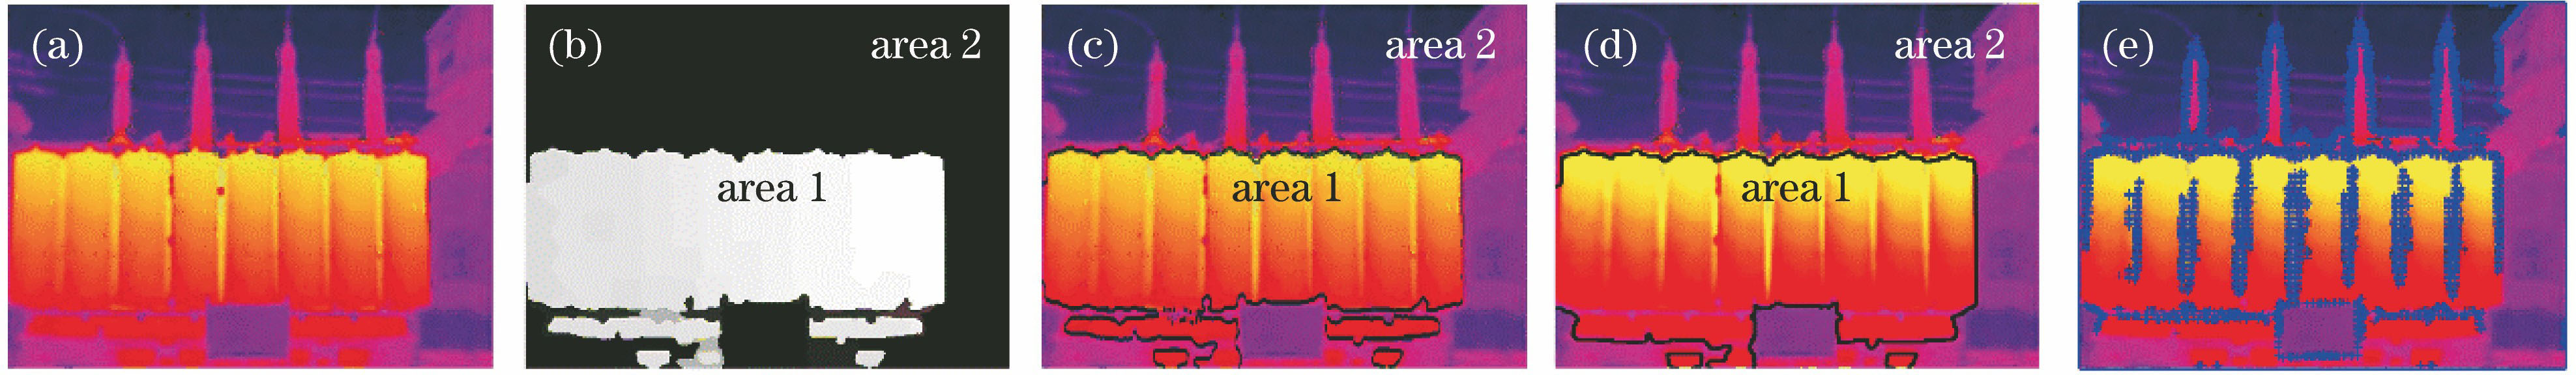
Fig. 2. Saliency gradient of infrared image. (a) Original image; (b) image after saliency detection; (c) infrared image after division; (d) image after enhancing the saliency area; (e) image of saliency gradient
Fig. 3. Saliency gradient of visible image. (a) Visible image; (b) image of saliency gradient
Fig. 4. Schematic diagram of CWPA
Fig. 5. Experimental sample of standard registration data set. (a) Visible image; (b) infrared image
Fig. 6. Comparison results of different algorithms. (a) SMI; (b) GWW-NMI; (c) SGNMI
Fig. 7. Part of the standard registration test image set. (a) Visible image; (b) infrared image
Fig. 8. Test results of blurred images. (a) MAE; (b) RMSE
Fig. 9. Visible image set and infrared image set. (a) Visible image; (b) infrared image
Fig. 10. Test results of the actual data set. (a) Registration time; (b) MAE; (c) RMSE
Fig. 11. Experimental results of actual data set. (a) σTRE; (b) registration time
| Registration parameter | h | v | q | r |
|---|
| Solution space | [-1000,1000] | [-1000,1000] | [-10,10] | [0,360] |
|
Table 1. Solution space of registration parameters
| Algorithm | Parameter |
|---|
| CPSO | N=100, iter=2000, inertia weight ω=0.7, learning factor c1=c2=1.5, individual speed limit [-0.5, 0.5] | | WPA | N=100, ferocious wolves∶scout wolves=1∶1, iter=2000, Tmax=10, step factor S=0.1; judging distance d=0.08, update scale factor β=3 | | CWPA | N=100, ferocious wolves∶scout wolves=1∶1, Tmax=10, threshold parameter ε=0.5, update scale factor β=3 |
|
Table 2. Parameters of optimization algorithm
| Sample | MAE | RMSE | Registration time /s |
|---|
| GWW-NMI | SMI | SGNMI | GWW-NMI | SMI | SGNMI | GWW-NMI | SMI | SGNMI |
|---|
| 1 | 0.897 | 1.435 | 0.931 | 1.213 | 2.241 | 1.391 | 0.734 | 4.231 | 1.032 | | 2 | 1.293 | 1.692 | 1.125 | 1.479 | 2.693 | 1.592 | 0.823 | 3.328 | 1.143 | | 3 | 0.736 | 1.613 | 0.962 | 0.986 | 2.861 | 1.242 | 0.672 | 4.054 | 1.097 | | 4 | 1.043 | 1.973 | 0.947 | 1.435 | 3.173 | 1.374 | 0.743 | 4.426 | 0.969 |
|
Table 3. Registration result of standard test image set
| Mean MAE | Mean RMSE | Mean registration time /s |
|---|
| GWW-NMI | SMI | SGNMI | GWW-NMI | SMI | SGNMI | GWW-NMI | SMI | SGNMI | | 1.010 | 1.673 | 1.040 | 1.387 | 2.490 | 1.324 | 0.926 | 3.847 | 1.239 |
|
Table 4. Mean value of registration results of 50 sets of standard test image sets
| Parameter | Value |
|---|
| Resolution /pixel×pixel | 384×288 | | Scene temperature range /℃ | 0--200 | | Temperature accuracy /% | ±2 | | Wavelength /μm | 7--13 | | Focus range /m | >0.6 | | Frame rate /Hz | 8.7 |
|
Table 5. Parameters of infrared camera
| Function | Expression | Feature | Solution space | Global extremum |
|---|
| Sphere | | L/U | [-10,10]2 | 0 | | Sumsquares | | L/U | [-10,10]100 | 0 | | Booth | | L/M | [-10,10]2 | 0 | | Quadric | | L/M | [-30,30]100 | 0 | | Powersum | | H/U | [-10,10]2 | 0 | | Zakharov | | H/U | [-10,10]100 | 0 | | Griewank | | H/M | [-600,600]100 | 0 | | Ackley | | H/M | [-32,32]100 | 0 |
|
Table 6. Standard test functions
| Function | Algorithm | MEAN | STD | SR /% | AEN |
|---|
| Sphere | WPA | 6.31×10-91 | 8.13×10-87 | 100 | 111.30 | | CPSO | 7.8×10-188 | 2.1×10-185 | 100 | 34.70 | | CWPA | 2.45×10-91 | 8.97×10-88 | 100 | 102.10 | | Sumsquares | WPA | 2.16×10-96 | 8.57×10-96 | 100 | 88.46 | | CPSO | 1.03×10⁻⁸ | 1.05×10⁻⁸ | 100 | 33.64 | | CWPA | 4.84×10-96 | 2.17×10-95 | 100 | 77.56 | | Booth | WPA | 1.32×10⁻⁶ | 1.7×10⁻⁶ | 100 | 145.50 | | CPSO | 0 | 0 | 100 | 31.24 | | CWPA | 1.07×10⁻⁹ | 1.25×10⁻⁹ | 100 | 87.42 | | Quadric | WPA | 7.60×10-84 | 2.21×10-89 | 100 | 326.52 | | CPSO | 6.88×10+2 | 1.46×10+2 | 0 | 2000.00 | | CWPA | 6.82×10-90 | 3.12×10-90 | 100 | 226.60 | | Powersum | WPA | 6.63×10-95 | 2.30×10-95 | 100 | 113.30 | | CPSO | 1.09×10⁻⁶ | 1.01×10⁻⁶ | 100 | 1172.00 | | CWPA | 4.84×10-183 | 1.27×10-183 | 100 | 38.42 | | Zakharov | WPA | 3.18×10⁻² | 2.98×10⁻¹ | 100 | 391.80 | | CPSO | 1.20 | 2.20 | 0 | 2000.00 | | CWPA | 4.15×10⁻¹⁶ | 2.06×10⁻¹⁶ | 100 | 237.98 | | Griewank | WPA | 1.44×10-89 | 5.56×10-89 | 100 | 243.52 | | CPSO | 1.03×10+3 | 2.97×10+2 | 0 | 2000.00 | | CWPA | 6.63×10-90 | 1.88×10-89 | 100 | 221.94 | | Ackley | WPA | 9.33×10⁻¹ | 1.19 | 60 | 991.04 | | CPSO | 9.37×10+1 | 1.37 | 0 | 2000.00 | | CWPA | 4.62×10⁻¹⁰ | 3.29×10⁻¹² | 100 | 193.51 |
|
Table 7. Performance comparison of optimization algorithms