Henry C. Frankis, Hamidu M. Mbonde, Dawson B. Bonneville, Chenglin Zhang, Richard Mateman, Arne Leinse, Jonathan D. B. Bradley, "Erbium-doped TeO2-coated Si3N4 waveguide amplifiers with 5 dB net gain," Photonics Res. 8, 127 (2020)

Search by keywords or author
- Photonics Research
- Vol. 8, Issue 2, 127 (2020)

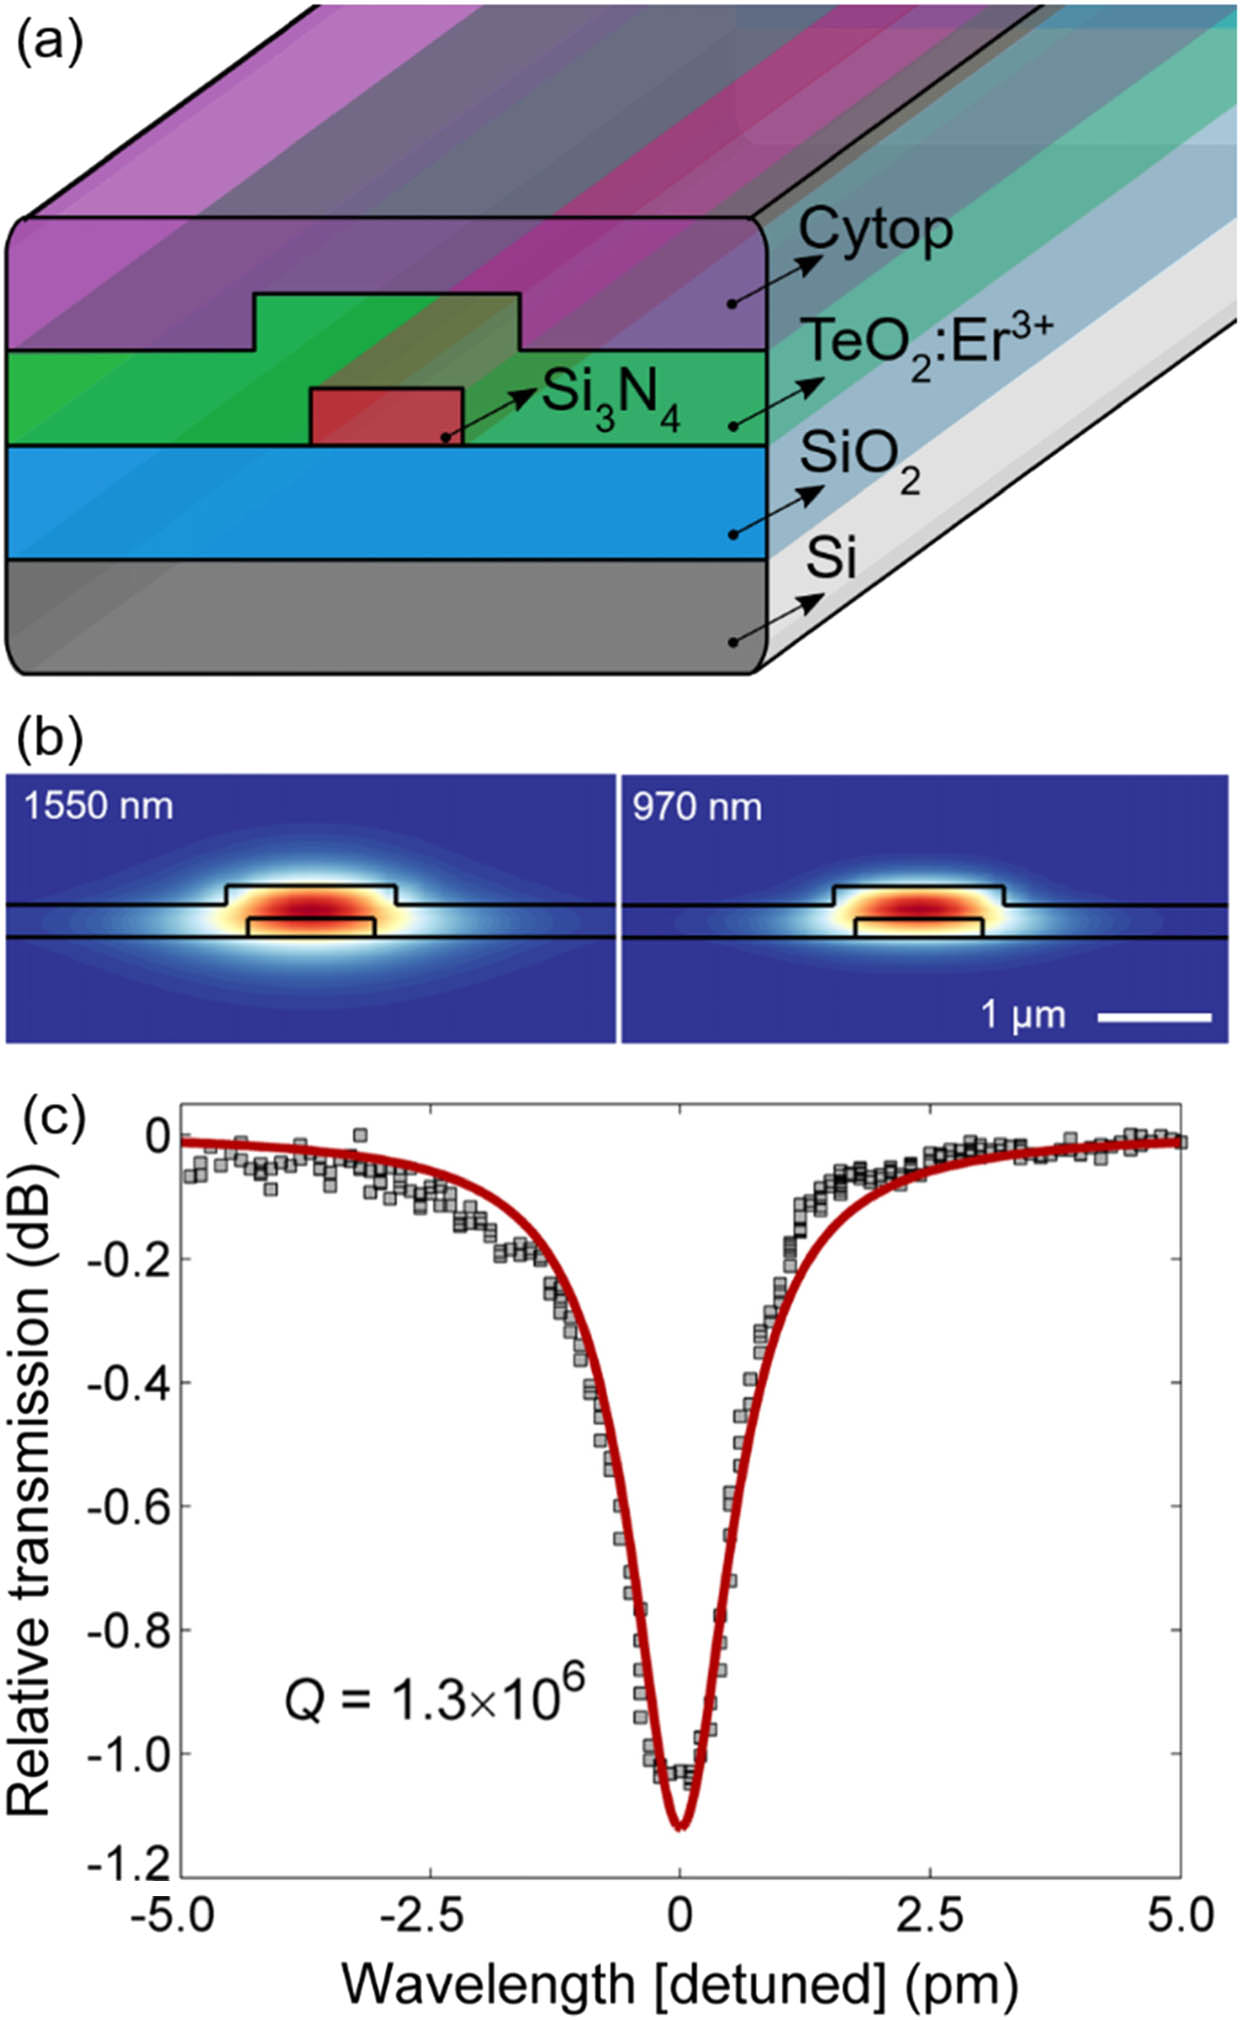
Fig. 1. (a) Diagram of the TeO 2 : Er 3 + -coated Si 3 N 4 waveguide structure. (b) Calculated optical electric-field profile for the fundamental 1550 and 970 nm TE waveguide modes. (c) Resonance spectrum of a TeO 2 : Er 3 + -coated Si 3 N 4 waveguide ring resonator with a 400 μm radius and 2.6 μm nominal gap at a wavelength of 1637 nm. The data is fit using coupled mode theory to extract an intrinsic Q factor of 1.3 × 10 6 corresponding to 0.25 dB/cm waveguide loss.

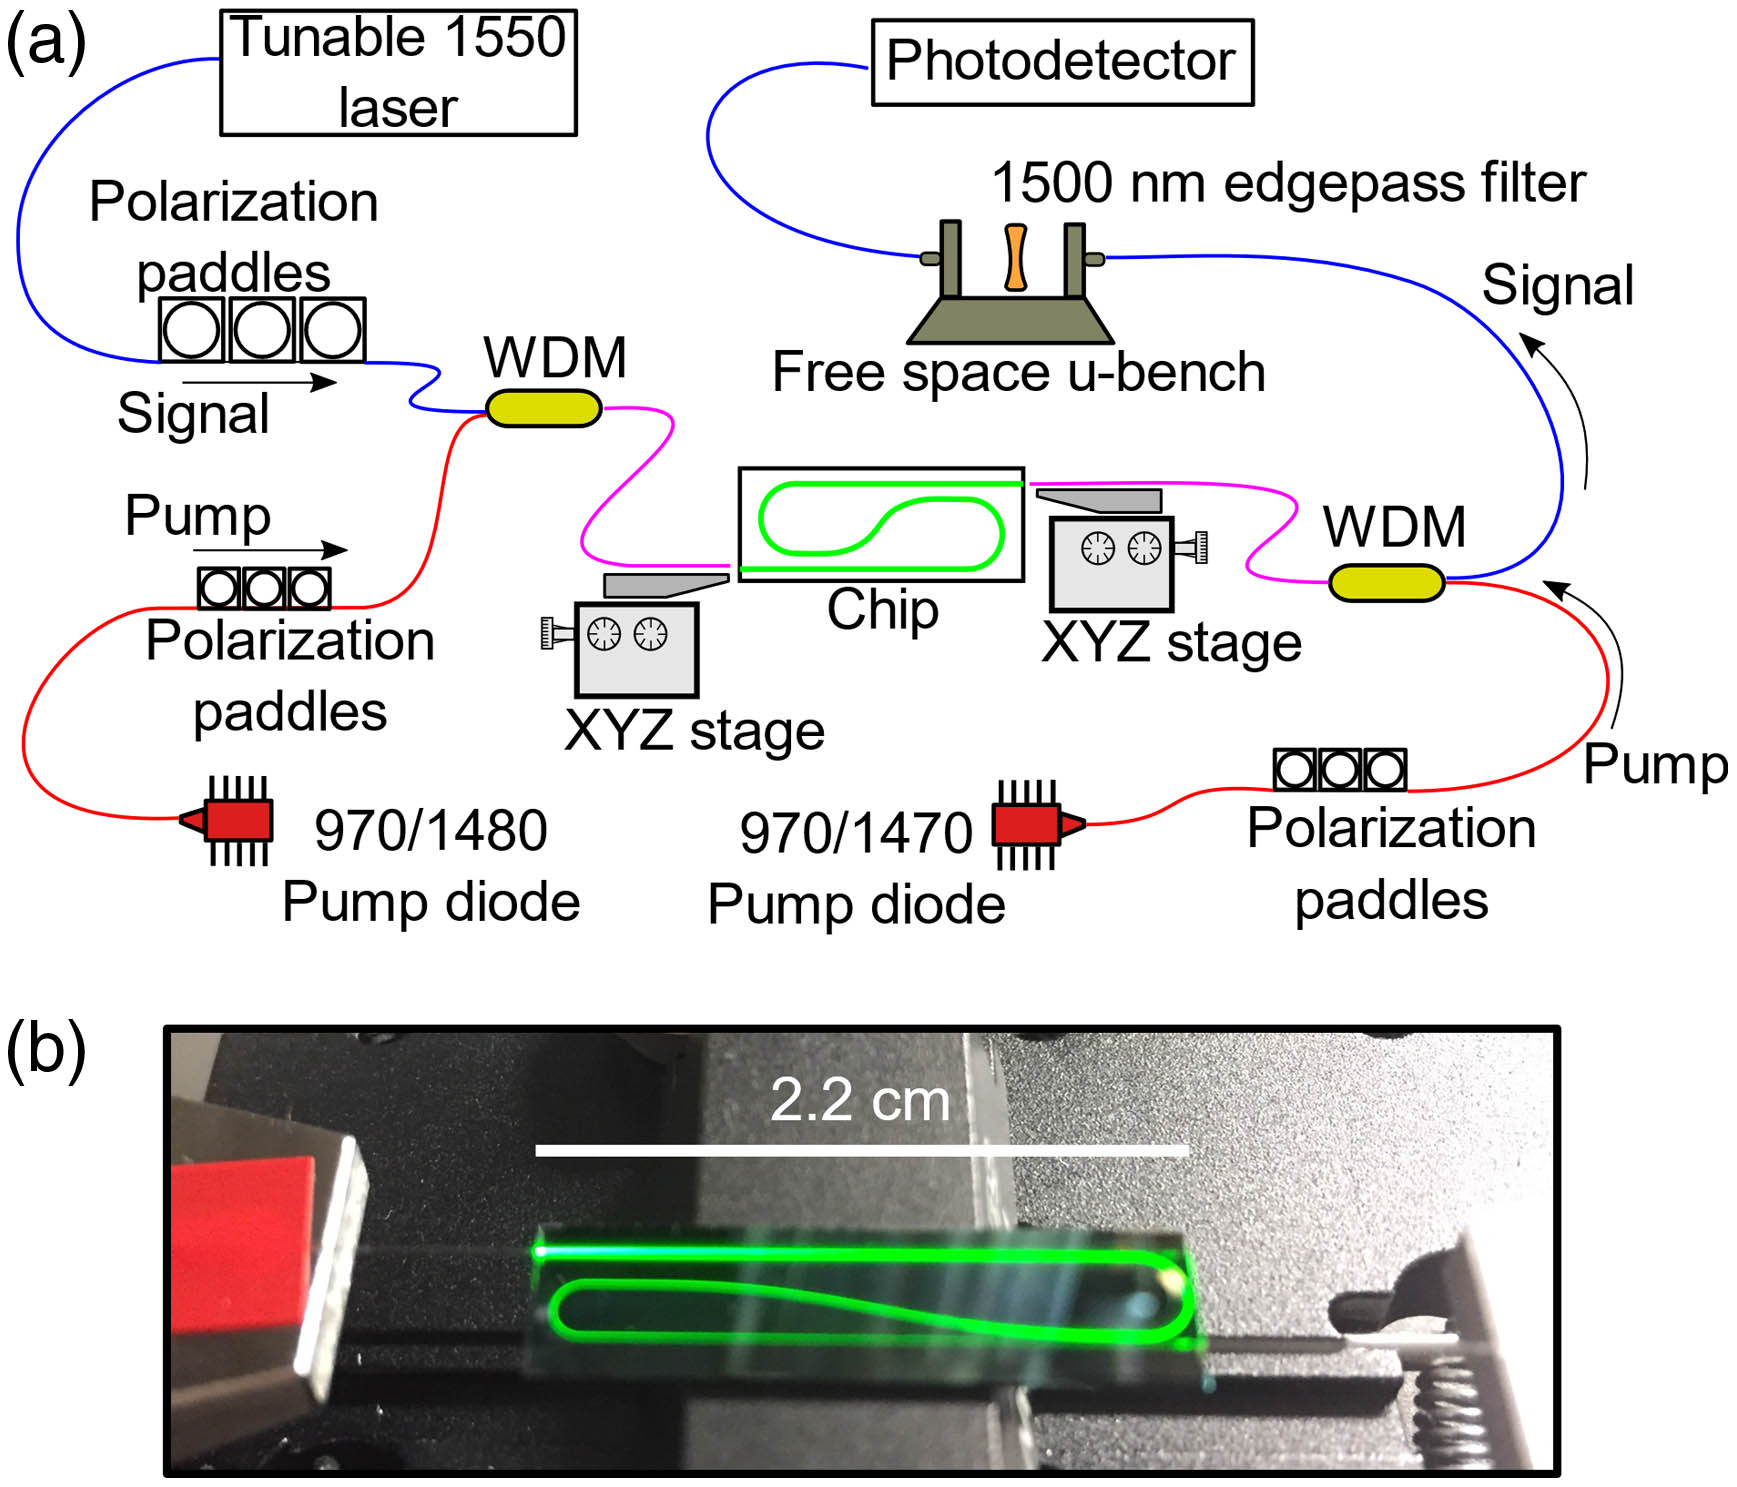
Fig. 2. (a) Diagram of the double-side pumping setup used to measure gain on the TeO 2 : Er 3 + -coated Si 3 N 4 chips. (b) Image of the chip showing the characteristic green light emission of erbium when pumping the paperclip waveguide.

Fig. 3. (a) Erbium absorption loss from 1460 to 1640 nm measured in 2.2 and 6.7 cm long TeO 2 : Er 3 + -coated Si 3 N 4 waveguides. Inset: Erbium absorption loss from 940 to 980 nm in a 2.2 cm long TeO 2 : Er 3 + -coated Si 3 N 4 waveguide. (b) Measured back-collected photoluminescence intensity from the waveguide after the 1470 nm pump source has been turned off, fit to have an excited-state lifetime of 480 μs. Inset: Amplified spontaneous emission spectrum measured in a TeO 2 : Er 3 + -coated Si 3 N 4 waveguide.

Fig. 4. Gain measurements in a 2.2 cm long TeO 2 : Er 3 + -coated Si 3 N 4 straight waveguide. (a) Internal net gain dependence on launched pump power for 970 and 1470 nm pump wavelengths and 1533 nm signal wavelength. (b) Internal net gain versus wavelength at maximum pump power for 970 and 1470 nm pump wavelengths.

Fig. 5. Gain measurements in a 6.7 cm long TeO 2 : Er 3 + -coated Si 3 N 4 paperclip waveguide. (a) Measured (dashed lines/circles) and simulated (solid lines) internal net gain versus launched pump power for 970 and 1470 nm pump wavelengths and 1558 nm signal wavelength. (b) Internal net gain versus wavelength at maximum pump power for 970 and 1470 nm pump wavelengths.

Fig. 6. (a) Three-level rate equation model diagram, showing processes of stimulated transitions (S), spontaneous decay (t), and energy transfer upconversion (W). (b) Measured net gain in 6.7 cm long waveguide, compared to simulated gain with 0%, 22.5%, and 40% quenched ions.

Fig. 7. Simulated net gain for TeO 2 : Er 3 + -coated Si 3 N 4 waveguides of 5, 10, and 15 cm length versus (a) launched 1470 nm pump power at a 1558 nm signal wavelength and (b) signal wavelength for 150 mW of launched 1470 nm pump power.
|
Table 1. Parameters Used for the Rate Equation Model

Set citation alerts for the article
Please enter your email address