• Acta Optica Sinica
  • Vol. 42, Issue 1, 0112002 (2022)
Zhibo Hao1、2、3, Huiqi Ye1、2、*, Liang Tang1、2, Jun Hao1、2、3, Jian Han1、2, Yang Zhai1、2, and Dong Xiao1、2
Author Affiliations
  • 1Nanjing Institute of Astronomical Optics & Technology, National Astronomical Observatories of the Chinese Academy of Sciences, Nanjing, Jiangsu 210042, China;
  • 2Chinese Academy of Sciences Key Laboratory of Astronomical Optics & Technology, Nanjing Institute of Astronomical Optics & Technology, Nanjing, Jiangsu 210042, China;
  • 3University of Chinese Academy of Sciences, Beijing 100049, China
  • show less
    DOI: 10.3788/AOS202242.0112002 Cite this Article Set citation alerts
    Zhibo Hao, Huiqi Ye, Liang Tang, Jun Hao, Jian Han, Yang Zhai, Dong Xiao. Improvement of Wavelength Calibration Accuracy of Astronomical High-Resolution Spectrometers with Fabry-Perot Etalons[J]. Acta Optica Sinica, 2022, 42(1): 0112002 Copy Citation Text show less
    Experimental setup for calibration tests
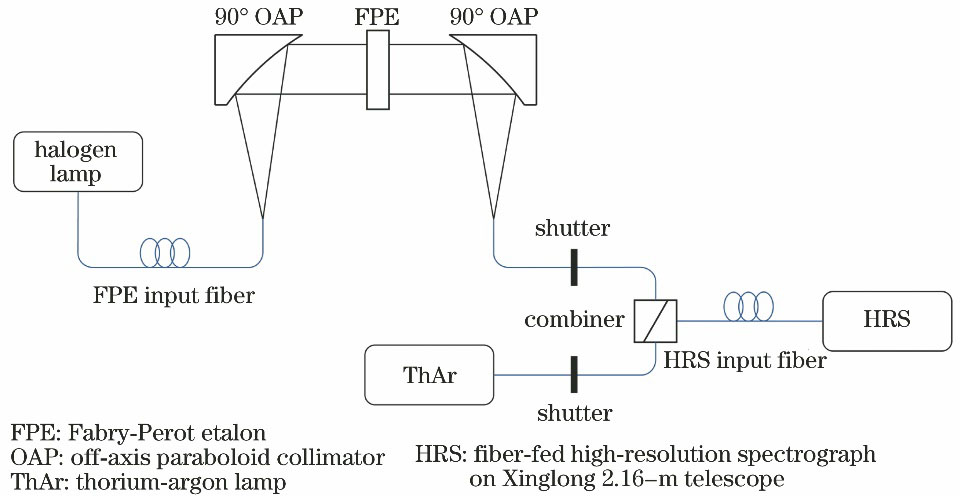
    Fig. 1. Experimental setup for calibration tests
    Diagram of 2D spectra acquired by HRS. (a) ThAr; (b) FPE
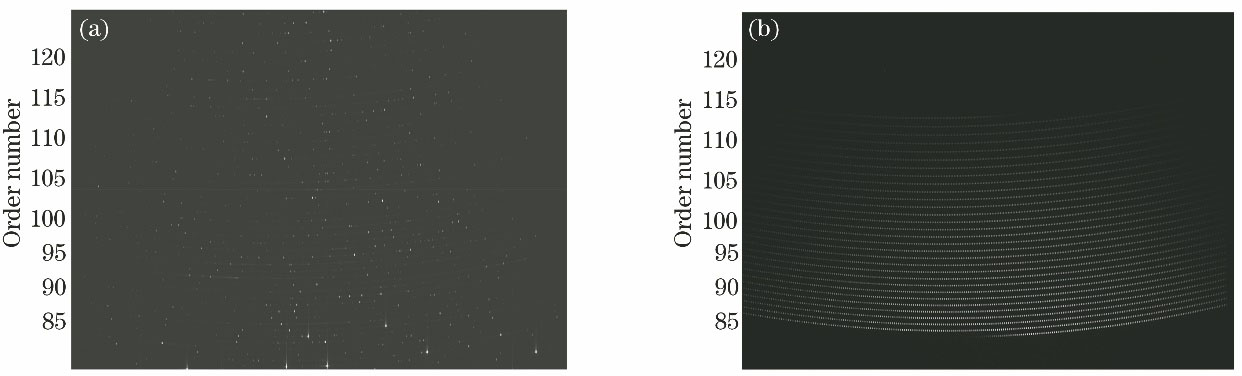
    Fig. 2. Diagram of 2D spectra acquired by HRS. (a) ThAr; (b) FPE
    Flow chart describing the principle of wavelength calibration by FPE
    Fig. 3. Flow chart describing the principle of wavelength calibration by FPE
    Refractive index of HPFS 7980 fused silica varying with the wavelength
    Fig. 4. Refractive index of HPFS 7980 fused silica varying with the wavelength
    Optical path compensation function fitting, which is derived from the measured 2D spectra of FPE and ThAr shown in Fig. 2. (a) Data and the fitted curve. The arrow and the big point show an example of the wavelength of an FPE transmission peak is corrected; (b) residuals in fitting
    Fig. 5. Optical path compensation function fitting, which is derived from the measured 2D spectra of FPE and ThAr shown in Fig. 2. (a) Data and the fitted curve. The arrow and the big point show an example of the wavelength of an FPE transmission peak is corrected; (b) residuals in fitting
    Residuals between the wavelength of spectral lines and the wavelength calculated by wavelength solutions, which are derived from the measured 2D spectra of FPE and ThAr shown in Fig. 2. (a) Residuals for spectral lines with different wavelength; (b) histogram showing the distribution of residuals
    Fig. 6. Residuals between the wavelength of spectral lines and the wavelength calculated by wavelength solutions, which are derived from the measured 2D spectra of FPE and ThAr shown in Fig. 2. (a) Residuals for spectral lines with different wavelength; (b) histogram showing the distribution of residuals
    Residuals between the locked wavelength of LFC spectral lines and the wavelength calculated by wavelength solutions, which are derived from the measured 2D spectra of FPE and ThAr shown in Fig. 2
    Fig. 7. Residuals between the locked wavelength of LFC spectral lines and the wavelength calculated by wavelength solutions, which are derived from the measured 2D spectra of FPE and ThAr shown in Fig. 2
    Optical path compensation functions for different (m0,d0) degenerate solutions
    Fig. 8. Optical path compensation functions for different (m0,d0) degenerate solutions
    FPE wavelength solution for S-2 minus that for S0 and FPE wavelength solution for S+2 minus that for S0
    Fig. 9. FPE wavelength solution for S-2 minus that for S0 and FPE wavelength solution for S+2 minus that for S0
    Degenerate solution namem0d0 /mm
    S-2139843.37358850
    S-1139853.37379883
    S0139863.37400911
    S+1139873.37421936
    S+2139883.37442972
    Table 1. Part of (m0,d0) degenerate solutions
    Zhibo Hao, Huiqi Ye, Liang Tang, Jun Hao, Jian Han, Yang Zhai, Dong Xiao. Improvement of Wavelength Calibration Accuracy of Astronomical High-Resolution Spectrometers with Fabry-Perot Etalons[J]. Acta Optica Sinica, 2022, 42(1): 0112002
    Download Citation