
Zirui Li, Huiqin Wang, Yan Hu, Ying Lu. Flame Image Detection Method Based on Deep Learning with Maximal Relevance and Minimal Redundancy[J]. Laser & Optoelectronics Progress, 2020, 57(10): 101015
- Laser & Optoelectronics Progress
- Vol. 57, Issue 10, 101015 (2020)
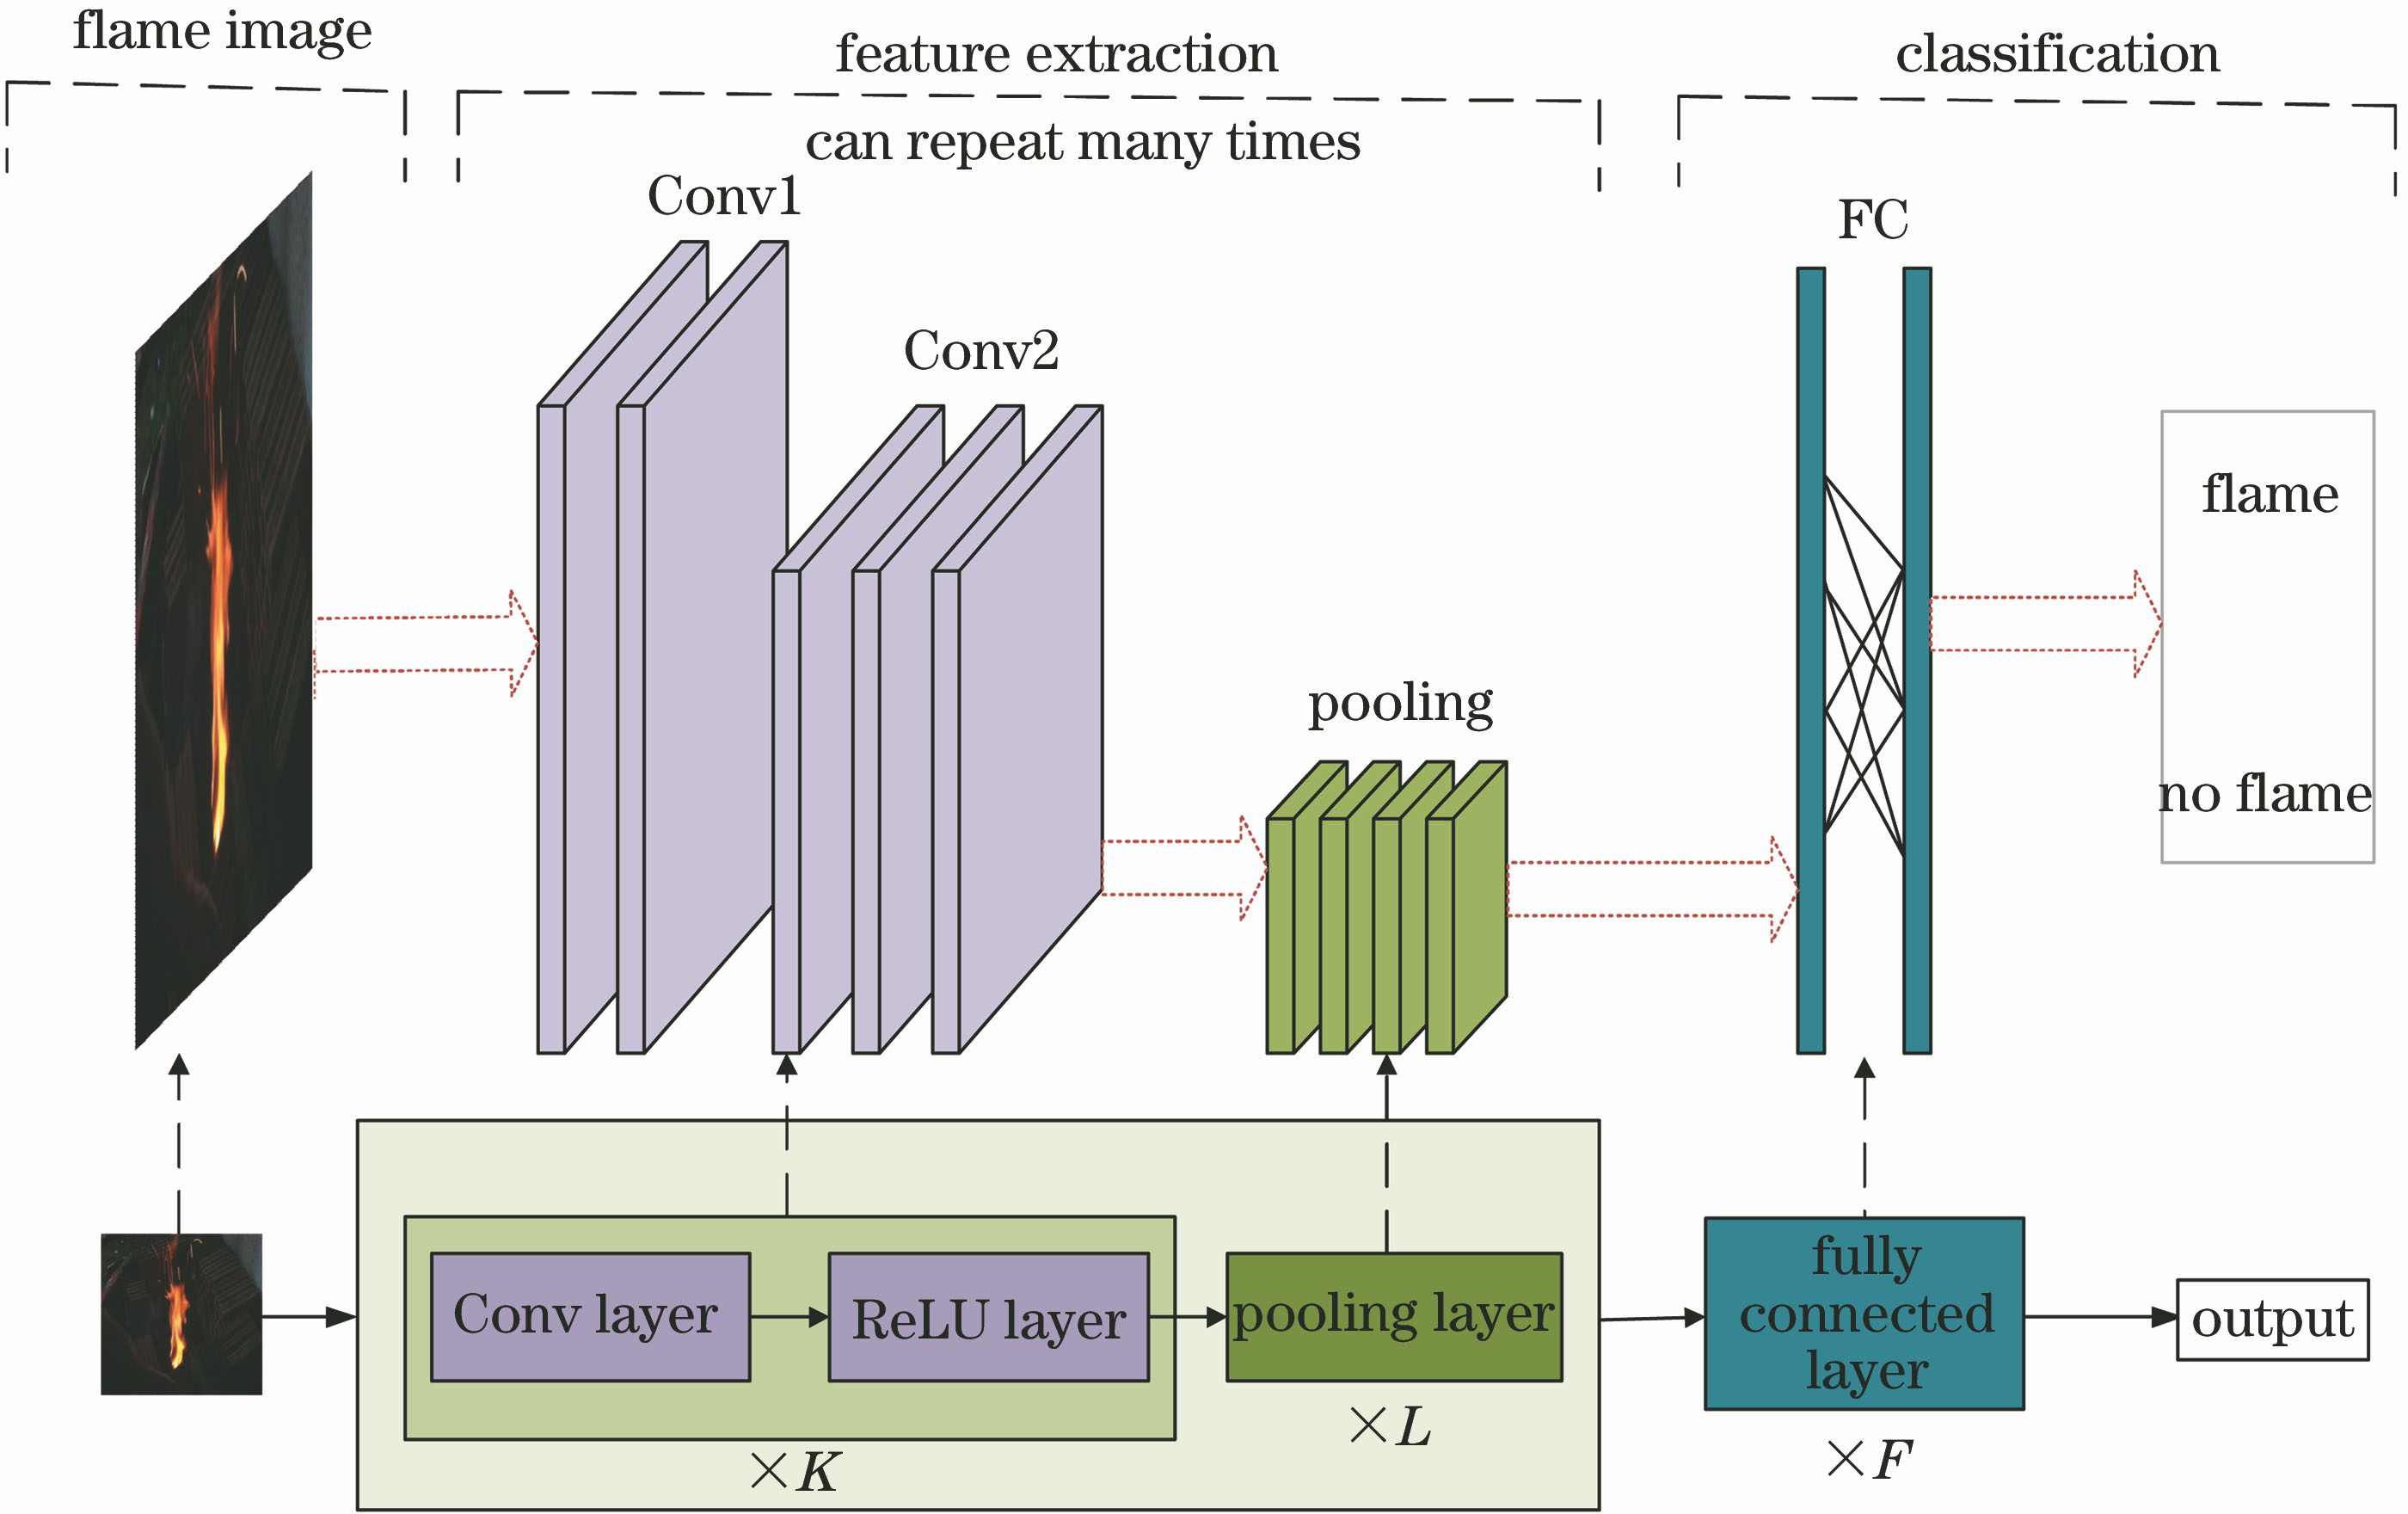
Fig. 1. CNN structure diagram
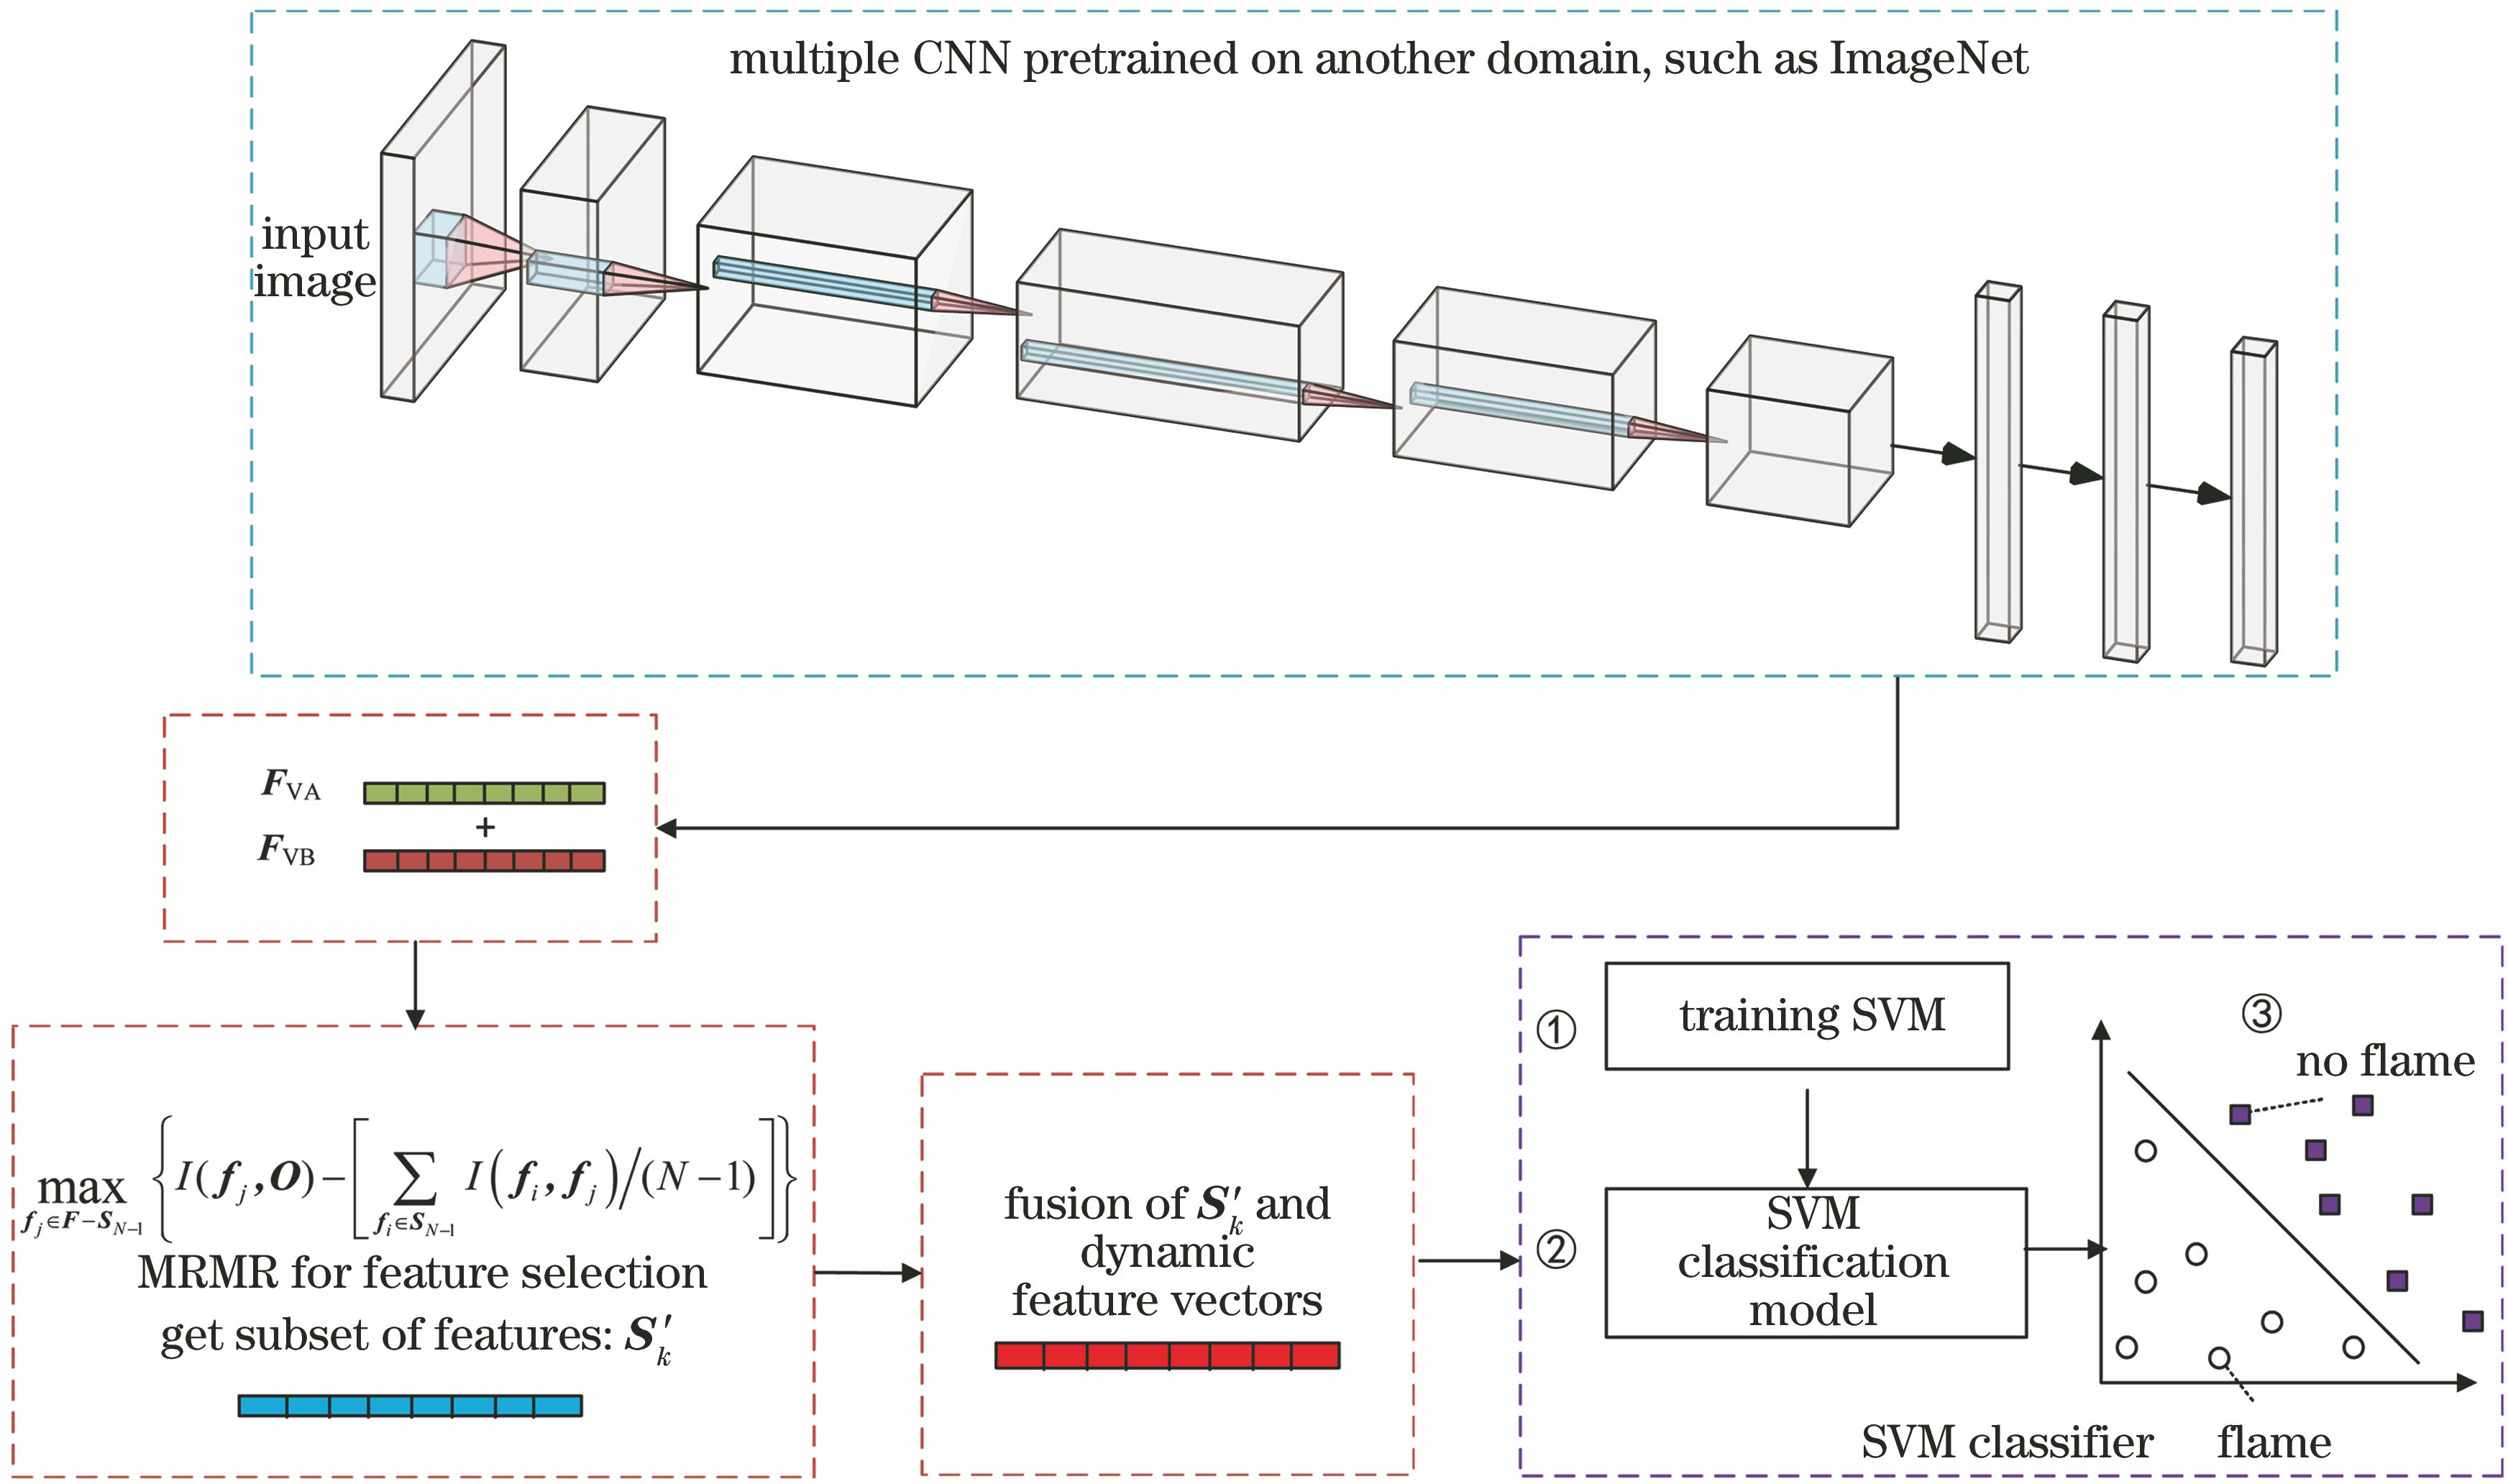
Fig. 2. Overall framework of proposed algorithm
Fig. 3. Flow chart of proposed algorithm
Fig. 4. Flow chart of feature extraction process
Fig. 5. VGG16 network structure diagram
Fig. 6. ResNet50 structure diagram
Fig. 7. Partial sample datasets. (a)-(e) Positive samples; (f)-(i) negative samples
Fig. 8. Convolutional layers output feature maps. Shallow convolution layer: (a) network 1, (c) network 2; deep convolution layer: (b) network 1, (d) network 2
Fig. 9. Variation curve of flame detection performance with number of features
|
Table 1. Influence of different feature selection algorithms on recognition
|
Table 2. Influence of CNN serial fusion features on recognition
|
Table 3. Performance comparison of three detection algorithms
|
Table 4. Results comparison of different detection algorithms

Set citation alerts for the article
Please enter your email address
© Copyright 2018-2021 | Chinese Laser Press. All Rights Reserved 沪ICP备15018463号-20