
Bin HU, Hao FU, Wen-bin WANG, Bing ZHANG, Fan TANG, Shan-wei MA, Qiang LU. Research on Deep Sorting Approach Based on Infrared Spectroscopy for High-Value Utilization of Municipal Solid Waste[J]. Spectroscopy and Spectral Analysis, 2022, 42(5): 1353
- Spectroscopy and Spectral Analysis
- Vol. 42, Issue 5, 1353 (2022)
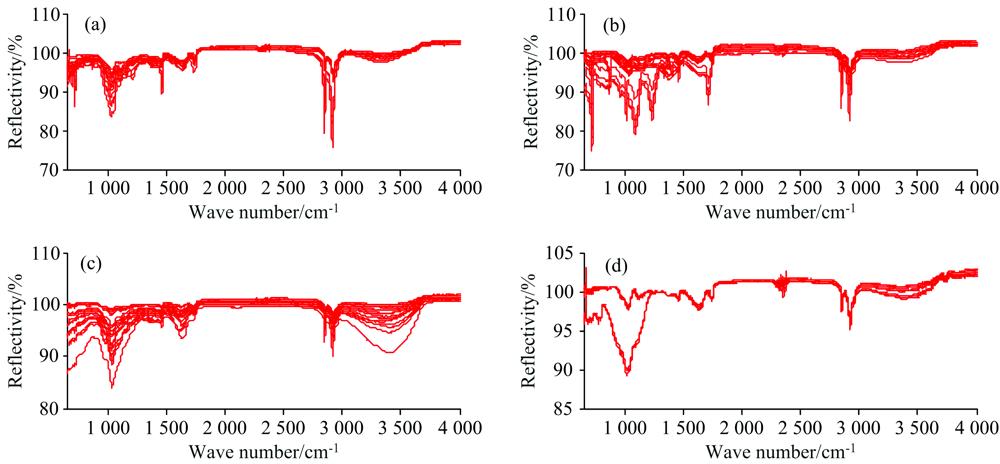
Fig. 1. Original infrared spectra of cellulose (a), vinyl polymers (b), woods (c) and low-value wastes (d)
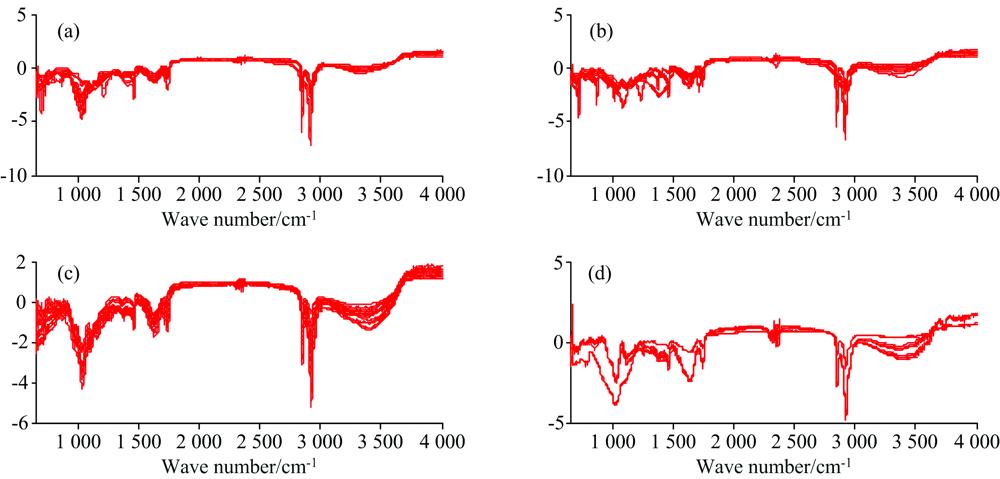
Fig. 2. SNV pretreated infrared spectra of cellulose (a), vinyl polymers (b), woods (c) and low-value wastes (d)
Fig. 3. MCS pretreated infrared spectra of cellulose (a), vinyl polymers (b), woods (c) and low-value wastes (d)
Fig. 4. DC/Smooth pretreated infrared spectra of cellulose (a), vinyl polymers (b), woods (c) and low-value wastes (d)
Fig. 5. The first (a) and second (b) principal component load analysis spectra
|
Table 1. Residual waste materials
|
Table 2. The principal component eigenvalues and variance contribution of SNV, MSC and DC/smooth datasets
| |||||||||||||||||||||||||||||||||||||||||||||||||||||
Table 3. Comparison of classification model accuracies (based on 72×8 dataset)
| |||||||||||||||||||||||||||||||||||||||||||||||||||||
Table 4. Comparison of classification model accuracies (based on 72×5 dataset)
| |||||||||||||||||||||||||||||||||||||||
Table 5. Comparison of classification accuracies for the four kinds of residual wastes (based on 72×8 DC/Smooth dataset)
| |||||||||||||||||||||||||||||||||||||||
Table 6. Comparison of classification accuracies for the four kinds of residual wastes (based on 72×5 DC/Smooth dataset)


Set citation alerts for the article
Please enter your email address

© Copyright 2018-2021 | Chinese Laser Press. All Rights Reserved 沪ICP备15018463号-20