• Photonics Research
  • Vol. 8, Issue 12, 1964 (2020)
Jindong Wang1、†, Zhizhou Lu2、3、†, Weiqiang Wang2、5、†,*, Fumin Zhang1、6、*, Jiawei Chen1, Yang Wang2、3, Jihui Zheng1, Sai T. Chu4, Wei Zhao2、3, Brent E. Little2、3, Xinghua Qu1, and Wenfu Zhang2、3、7、*
Author Affiliations
  • 1State Key Laboratory of Precision Measuring Technology & Instruments, Tianjin University, Tianjin 300072, China
  • 2State Key Laboratory of Transient Optics and Photonics, Xi’an Institute of Optics and Precision Mechanics, Chinese Academy of Sciences, Xi’an 710119, China
  • 3University of Chinese Academy of Sciences, Beijing 100049, China
  • 4Department of Physics and Materials Science, City University of Hong Kong, Hong Kong, China
  • 5e-mail: wwq@opt.ac.cn
  • 6e-mail: zhangfumin@tju.edu.cn
  • 7e-mail: wfuzhang@opt.ac.cn
  • show less
    DOI: 10.1364/PRJ.408923 Cite this Article Set citation alerts
    Jindong Wang, Zhizhou Lu, Weiqiang Wang, Fumin Zhang, Jiawei Chen, Yang Wang, Jihui Zheng, Sai T. Chu, Wei Zhao, Brent E. Little, Xinghua Qu, Wenfu Zhang. Long-distance ranging with high precision using a soliton microcomb[J]. Photonics Research, 2020, 8(12): 1964 Copy Citation Text show less
    Schematic of DPI system used for distance measurement. COL, collimating mirror; BS, beam splitter; REF, reference mirror; OSA, optical spectrum analyzer; TARG, target mirror.
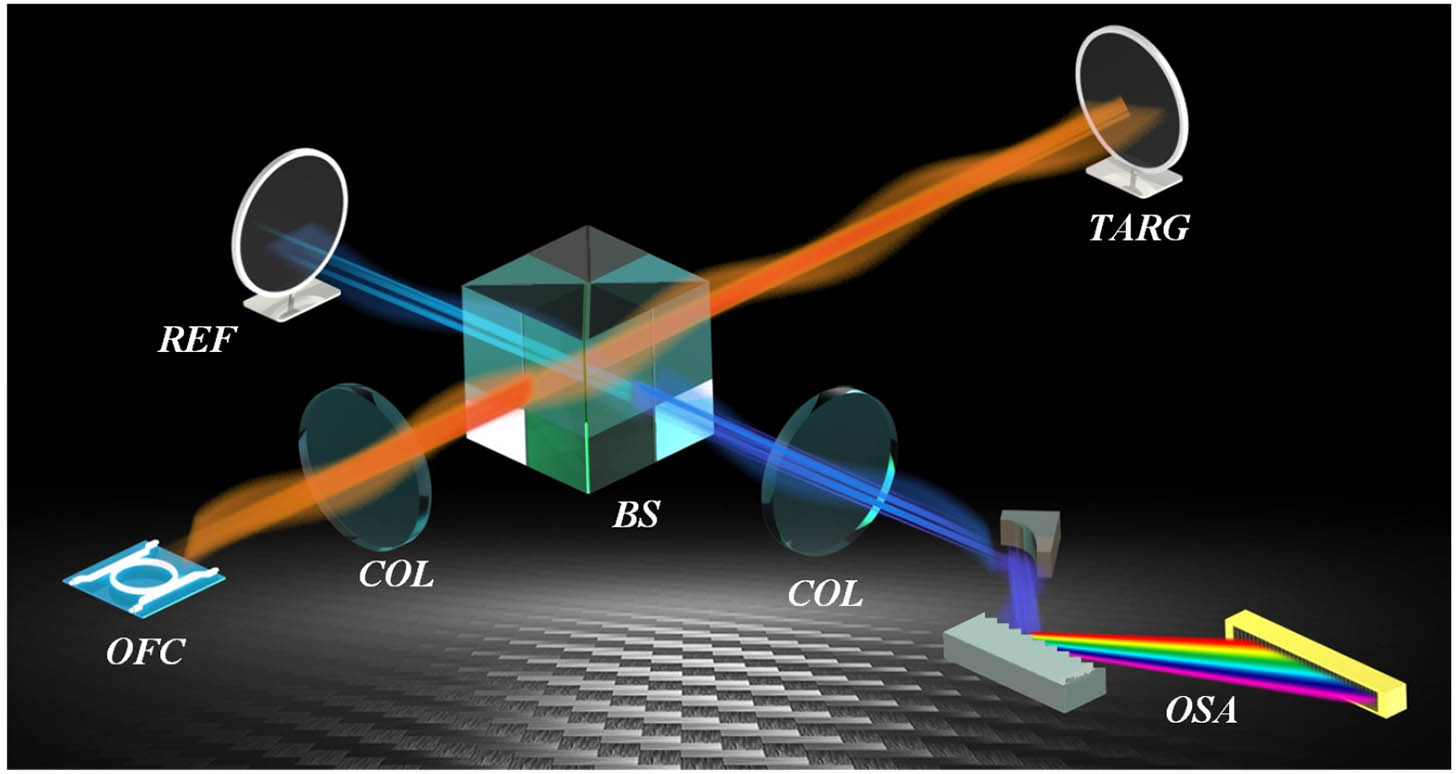
    Fig. 1. Schematic of DPI system used for distance measurement. COL, collimating mirror; BS, beam splitter; REF, reference mirror; OSA, optical spectrum analyzer; TARG, target mirror.
    Comparison of dead zone of mode-locked OFC and SMC. The dead zone is introduced by the mismatch between the repetition rate of the OFC and the resolution of the optical spectrum acquisition system. Using an SMC with a repetition rate higher than 2ngδf, the dead zone will be eliminated. La, actual distance to be measured; L, measured distance of a DPI system.
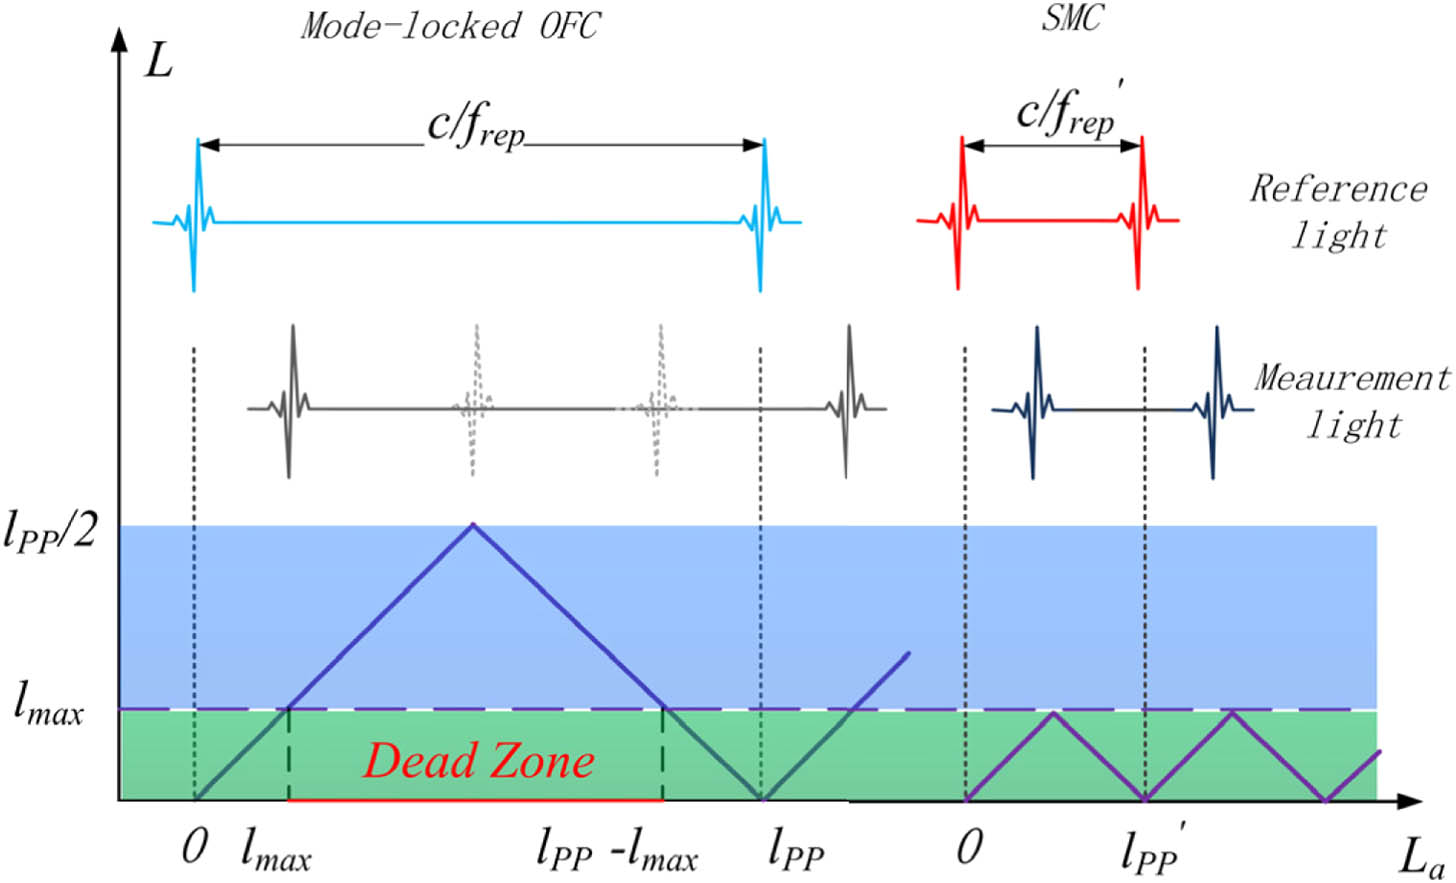
    Fig. 2. Comparison of dead zone of mode-locked OFC and SMC. The dead zone is introduced by the mismatch between the repetition rate of the OFC and the resolution of the optical spectrum acquisition system. Using an SMC with a repetition rate higher than 2ngδf, the dead zone will be eliminated. La, actual distance to be measured; L, measured distance of a DPI system.
    Single SMC generation in a high-index doped silica glass MRR. (a) Experimental setup for SMC generation. An auxiliary laser-assisted intracavity thermal-balanced scheme is adopted for single SMC generation. (b) Image of the butterfly-packaged MRR; (c) typical optical spectrum of the single SMC. Left inset, enlarged comb lines; right inset, electrical spectrum of single SMC. ECDL, external cavity diode laser; EDFA, erbium-doped optical fiber amplifier; FPC, fiber polarization controller; Cir, circulator; PD, photodetector; ESA, electrical spectrum analyzer; OSA, optical spectrum analyzer.
    Fig. 3. Single SMC generation in a high-index doped silica glass MRR. (a) Experimental setup for SMC generation. An auxiliary laser-assisted intracavity thermal-balanced scheme is adopted for single SMC generation. (b) Image of the butterfly-packaged MRR; (c) typical optical spectrum of the single SMC. Left inset, enlarged comb lines; right inset, electrical spectrum of single SMC. ECDL, external cavity diode laser; EDFA, erbium-doped optical fiber amplifier; FPC, fiber polarization controller; Cir, circulator; PD, photodetector; ESA, electrical spectrum analyzer; OSA, optical spectrum analyzer.
    Principle of the proposed SMC lidar. A dual-frequency PLR is employed for rough distance evaluation. (a) SMC generator. A single SMC is split to signal and reference combs using a 20∶80 OC. (b) Interference spectrum acquisition system. Two CMs and a reflection grating are designed to separate the interference spectrum spatially, which ensures each pixel of the LAIS is exposed by a single SMC mode. (c) Schematic of the PLR for distance evaluation. A phase-modulated LD is used as optical source, and the phase variation is demodulated by a phase detector. (d) An IMG, including three He–Ne laser interferometers to eliminate Abbe error, is used to provide a high-precision absolute distance reference. (e) Typical interference spectrum of the SMC-based DPI ranging system; (f) FFT spectrum of the interference spectrum envelope; (g) zoom-in vision of the FFT spectrum. A three-point fitting method (red line) is employed to extract the exact delay time. CM, concave mirror; LAIS, linear array image sensor; OC, optical coupler; OA, optical attenuator; CW, continuous wave laser; EDFA, erbium-doped optical fiber amplifier; CIR, circulator; LD, laser diode; APD, avalanche photodiode; COL, collimating mirror; WDM, wavelength division multiplexer.
    Fig. 4. Principle of the proposed SMC lidar. A dual-frequency PLR is employed for rough distance evaluation. (a) SMC generator. A single SMC is split to signal and reference combs using a 20∶80 OC. (b) Interference spectrum acquisition system. Two CMs and a reflection grating are designed to separate the interference spectrum spatially, which ensures each pixel of the LAIS is exposed by a single SMC mode. (c) Schematic of the PLR for distance evaluation. A phase-modulated LD is used as optical source, and the phase variation is demodulated by a phase detector. (d) An IMG, including three He–Ne laser interferometers to eliminate Abbe error, is used to provide a high-precision absolute distance reference. (e) Typical interference spectrum of the SMC-based DPI ranging system; (f) FFT spectrum of the interference spectrum envelope; (g) zoom-in vision of the FFT spectrum. A three-point fitting method (red line) is employed to extract the exact delay time. CM, concave mirror; LAIS, linear array image sensor; OC, optical coupler; OA, optical attenuator; CW, continuous wave laser; EDFA, erbium-doped optical fiber amplifier; CIR, circulator; LD, laser diode; APD, avalanche photodiode; COL, collimating mirror; WDM, wavelength division multiplexer.
    Ultimate distance result synthesis procedure. (a) Schematic diagram of ultimate distance synthesis. L1, L2, and L make up a distance measurement chain and link together to synthesize the ultimate distance. (b) Detailed calculating procedure of ultimate distance synthesis.
    Fig. 5. Ultimate distance result synthesis procedure. (a) Schematic diagram of ultimate distance synthesis. L1, L2, and L make up a distance measurement chain and link together to synthesize the ultimate distance. (b) Detailed calculating procedure of ultimate distance synthesis.
    Experimental results of distance ranging in a well-maintained environment. (a) Measurement results when the target moves from 0 to 3 mm with a step size of 50 μm. Top, measured results versus set distance; bottom, residuals between the DPI and IMG ranging results; the standard deviations are labeled with error bars (magenta). (b) Fractional parts of the measurement results of 1 m ranging experiment; (c) fractional parts of the measurement results of 80 m ranging experiment; (d) Allan deviations versus average time of 1 and 80 m ranging experiments.
    Fig. 6. Experimental results of distance ranging in a well-maintained environment. (a) Measurement results when the target moves from 0 to 3 mm with a step size of 50 μm. Top, measured results versus set distance; bottom, residuals between the DPI and IMG ranging results; the standard deviations are labeled with error bars (magenta). (b) Fractional parts of the measurement results of 1 m ranging experiment; (c) fractional parts of the measurement results of 80 m ranging experiment; (d) Allan deviations versus average time of 1 and 80 m ranging experiments.
    Experimental setup of long-distance ranging in an outdoor environment. (a) Layout of the long-distance ranging experiments. The emitted light is coaxial to the reflected light with the help of two reflectors. The lower left is a photograph of the experimental setup. A cube-corner prism is used as the target mirror and installed on a piezoelectric vibrator (lower right). (b) Satellite image of the outdoor baseline of NIM. The distance to be measured is ∼1179 m.
    Fig. 7. Experimental setup of long-distance ranging in an outdoor environment. (a) Layout of the long-distance ranging experiments. The emitted light is coaxial to the reflected light with the help of two reflectors. The lower left is a photograph of the experimental setup. A cube-corner prism is used as the target mirror and installed on a piezoelectric vibrator (lower right). (b) Satellite image of the outdoor baseline of NIM. The distance to be measured is 1179  m.
    Experimental results of long-distance ranging in an outdoor environment. (a) Ranging results under three conditions: stationary (blue), 1 kHz vibration (red), and 5 kHz vibration (yellow); (b) zoom-in of the ranging results; (c) Allan deviations of the stationary ranging results versus averaging time before and after an HP filter; (d) frequency spectra of three conditions.
    Fig. 8. Experimental results of long-distance ranging in an outdoor environment. (a) Ranging results under three conditions: stationary (blue), 1 kHz vibration (red), and 5 kHz vibration (yellow); (b) zoom-in of the ranging results; (c) Allan deviations of the stationary ranging results versus averaging time before and after an HP filter; (d) frequency spectra of three conditions.
    Precision analysis of length measurement. The blue and brown lines are the absolute precision and the relative precision as a function of the length on measure, respectively. The yellow line is the absolute precision of measuring result after HP filtering as a function of the length on measure with the minimum Allan deviation of 27 nm marked with a red point.
    Fig. 9. Precision analysis of length measurement. The blue and brown lines are the absolute precision and the relative precision as a function of the length on measure, respectively. The yellow line is the absolute precision of measuring result after HP filtering as a function of the length on measure with the minimum Allan deviation of 27 nm marked with a red point.
    Jindong Wang, Zhizhou Lu, Weiqiang Wang, Fumin Zhang, Jiawei Chen, Yang Wang, Jihui Zheng, Sai T. Chu, Wei Zhao, Brent E. Little, Xinghua Qu, Wenfu Zhang. Long-distance ranging with high precision using a soliton microcomb[J]. Photonics Research, 2020, 8(12): 1964
    Download Citation