• Laser & Optoelectronics Progress
  • Vol. 61, Issue 1, 0130001 (2024)
Xingdao He1、2、*, Jin Xu1、2, Mingxuan Liu1、3, and Jiulin Shi1、2、3、**
Author Affiliations
  • 1Jiangxi Provincial Key Laboratory of Opto-Electronic Information Science and Technology, Nanchang Hangkong University, Nanchang 330063, Jiangxi , China
  • 2School of Instrumentation and Optoelectronic Engineering, Beihang University, Beijing 100191, China
  • 3Key Laboratory of Nondestructive Test (Ministry of Education), Nanchang Hangkong University, Nanchang 330063, Jiangxi , China
  • show less
    DOI: 10.3788/LOP232462 Cite this Article Set citation alerts
    Xingdao He, Jin Xu, Mingxuan Liu, Jiulin Shi. Dispersion Rate of Single-Stage Virtually Imaged Phased Array Spectrometer for Two-Dimensional Imaging of the Cornea and Lens (Invited)[J]. Laser & Optoelectronics Progress, 2024, 61(1): 0130001 Copy Citation Text show less
    The effect of waist radius and cylindrical lens focal lengths on dispersion rate. (a) VIPA output spectra at W=3 mm, 6 mm, and 9 mm, respectively; (b) the intensity difference at different waist radii; (c) the intensity difference at different focal lengths of cylindrical lens
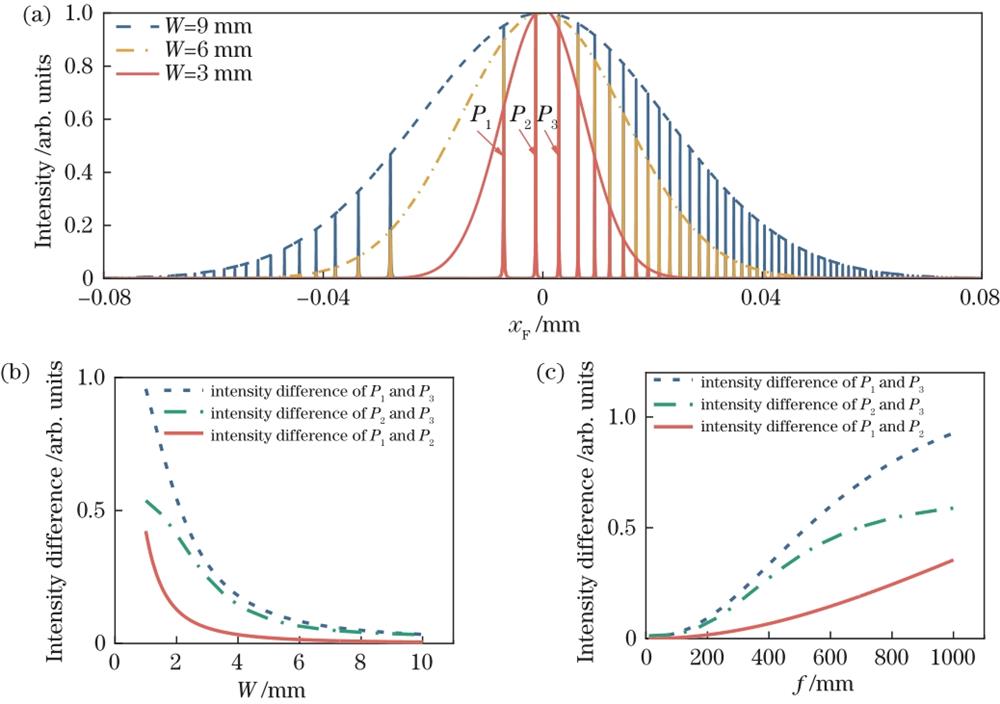
    Fig. 1. The effect of waist radius and cylindrical lens focal lengths on dispersion rate. (a) VIPA output spectra at W=3 mm, 6 mm, and 9 mm, respectively; (b) the intensity difference at different waist radii; (c) the intensity difference at different focal lengths of cylindrical lens
    The effect of F on dispersion rate. (a) Envelop of VIPA output spectra at F=1000 mm, 500 mm, and 250 mm, respectively; (b) VIPA output spectra at F=1000 mm, 500 mm, and 250 mm, respectively; (c) the position of the highest order of VIPA output spectra varing with F; (d) the dispersion rate and the intensity difference between the highest order and the next order of VIPA output spectra varing with F
    Fig. 2. The effect of F on dispersion rate. (a) Envelop of VIPA output spectra at F=1000 mm, 500 mm, and 250 mm, respectively; (b) VIPA output spectra at F=1000 mm, 500 mm, and 250 mm, respectively; (c) the position of the highest order of VIPA output spectra varing with F; (d) the dispersion rate and the intensity difference between the highest order and the next order of VIPA output spectra varing with F
    The effect of VIPA tilting angle on dispersion rate. (a) The position of the P1 order of VIPA output spectra varing with θt; (b) the dispersion rate and the intensity of the P1 order of VIPA output spectra varing with θt
    Fig. 3. The effect of VIPA tilting angle on dispersion rate. (a) The position of the P1 order of VIPA output spectra varing with θt; (b) the dispersion rate and the intensity of the P1 order of VIPA output spectra varing with θt
    The effect of camera pixel on dispersion rate. (a) Distribution of output optical when camera pixel is 1024×1024; (b) change of dispersion rate versus camera pixel value; (c) the one-dimensional spectra distribution curve at the red line position in Fig. 4(a) when camera pixel is 1024×1024 and 6000×6000, respectively
    Fig. 4. The effect of camera pixel on dispersion rate. (a) Distribution of output optical when camera pixel is 1024×1024; (b) change of dispersion rate versus camera pixel value; (c) the one-dimensional spectra distribution curve at the red line position in Fig. 4(a) when camera pixel is 1024×1024 and 6000×6000, respectively
    The effect of waist radius, cylindrical lens focal lengths, focal lengths of spherical lens, and VIPA tilting angle on intensity difference and the dispersion rate. (a) The intensity difference between P2 and P1 at different waist radii and cylindrical lens focal length; (b) the intensity difference between P2 and P3 at different waist radii and cylindrical lens focal length; (c) the intensity difference between P2 and P1 at different focal lengths of spherical lens and VIPA tilting angle; (d) the intensity difference between P3 and P2 at different focal lengths of spherical lens and VIPA tilting angle; (e) the dispersion rate between P2 and P1 at different focal lengths of spherical lens and VIPA tilting angle; (f) the dispersion rate between P3 and P2 at different focal lengths of spherical lens and VIPA tilting angle
    Fig. 5. The effect of waist radius, cylindrical lens focal lengths, focal lengths of spherical lens, and VIPA tilting angle on intensity difference and the dispersion rate. (a) The intensity difference between P2 and P1 at different waist radii and cylindrical lens focal length; (b) the intensity difference between P2 and P3 at different waist radii and cylindrical lens focal length; (c) the intensity difference between P2 and P1 at different focal lengths of spherical lens and VIPA tilting angle; (d) the intensity difference between P3 and P2 at different focal lengths of spherical lens and VIPA tilting angle; (e) the dispersion rate between P2 and P1 at different focal lengths of spherical lens and VIPA tilting angle; (f) the dispersion rate between P3 and P2 at different focal lengths of spherical lens and VIPA tilting angle
    Brillouin detection system experimental device
    Fig. 6. Brillouin detection system experimental device
    Brillouin spectra of water and olive oil. (a)(b) Brillouin signals of water and oil when FSR of VIPA is 30 GHz, respectively; (c) Brillouin signals of water when FSR of VIPA is 20 GHz; (d) Brillouin signals of water when FSR of VIPA is 20 GHz
    Fig. 7. Brillouin spectra of water and olive oil. (a)(b) Brillouin signals of water and oil when FSR of VIPA is 30 GHz, respectively; (c) Brillouin signals of water when FSR of VIPA is 20 GHz; (d) Brillouin signals of water when FSR of VIPA is 20 GHz
    Comparison of EMCCD and CMOS system parameters. (a) Extinction ratio; (b) dispersion rate, spectra resolution, measuring accuracy of Stokes, and contrast
    Fig. 8. Comparison of EMCCD and CMOS system parameters. (a) Extinction ratio; (b) dispersion rate, spectra resolution, measuring accuracy of Stokes, and contrast
    Measurements of Brillouin frequency shift of cornea and lens in an ex-vivo porcine eye. (a) Image based on measured frequency shifts at the center of cornea; (b) image based on measured frequency shifts of lens in red box region of Fig.9 (a) at a depth of 4 mm from the corneal surface
    Fig. 9. Measurements of Brillouin frequency shift of cornea and lens in an ex-vivo porcine eye. (a) Image based on measured frequency shifts at the center of cornea; (b) image based on measured frequency shifts of lens in red box region of Fig.9 (a) at a depth of 4 mm from the corneal surface
    ParameterValue
    λ /nm532
    t /mm5.037
    n1.46
    f /mm2009
    F /mm100024
    θt /(°)1
    Table 1. Initial parameter settings for simulation of a single-stage VIPA spectrometer
    ParameterValue
    Source532 nm,10 mW,divergence angle is 6.4°
    Focal length of collimating lens /mm50
    Focal length of cylindrical lens /mm100
    FSR of VIPA /GHz20
    Focal length of spherical lens /mm100
    Image area of detector /(mm×mm)14.4×14.4
    Table 2. Parameters setting of the single-stage VIPA spectrometer
    Xingdao He, Jin Xu, Mingxuan Liu, Jiulin Shi. Dispersion Rate of Single-Stage Virtually Imaged Phased Array Spectrometer for Two-Dimensional Imaging of the Cornea and Lens (Invited)[J]. Laser & Optoelectronics Progress, 2024, 61(1): 0130001
    Download Citation