
Huan Chi. Online Detection Method of Woven Bag Defects Based on Machine Vision[J]. Laser & Optoelectronics Progress, 2020, 57(20): 201507
- Laser & Optoelectronics Progress
- Vol. 57, Issue 20, 201507 (2020)
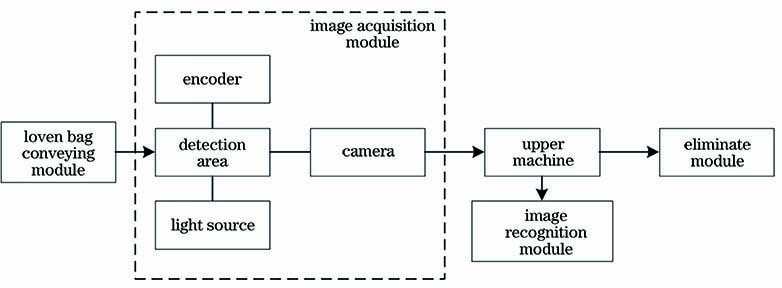
Fig. 1. System block diagram
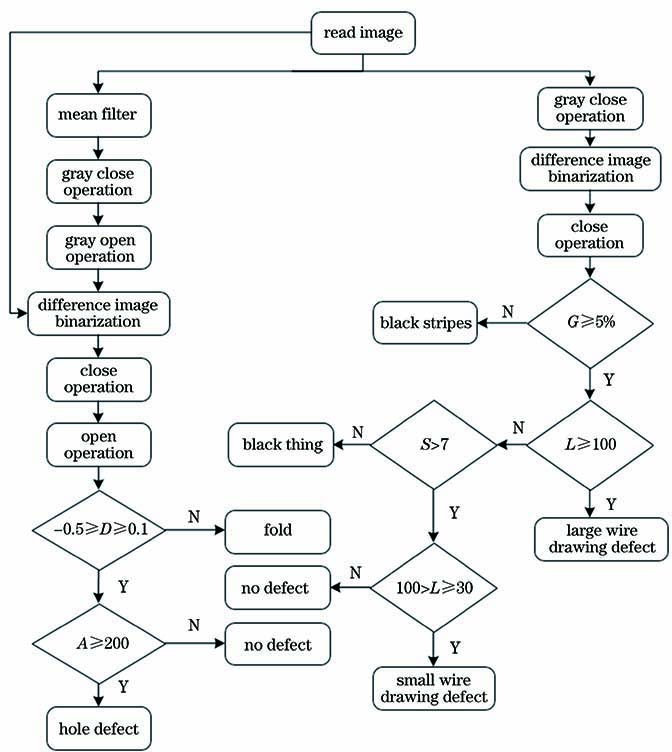
Fig. 2. Flow chart of defect detection algorithm
Fig. 3. Preprocessing images.(a) Original hole image; (b) mean filtered image of hole; (c) gray close operation image of hole; (d) gray open operation image of hole; (e) original wire drawing; (f) close operation image of wire drawing; (g) original black thing; (h) close operation image of the black thing
Fig. 4. Images of difference image binarization. (a) Hole image; (b) wire drawing; (c) black thing
Fig. 5. Diagram of defect detection results. (a) Close operation of the hole image; (b) open operation of the hole image; (c) close operation of the wire drawing; (d) close operation of the black thing
Fig. 6. Structural factor characteristic diagram
Fig. 7. Feature maps. (a) Defects of small wire drawing; (b) defects of big wire drawing; (c) defects of hole; (d) defects of fold; (e) defects of the black thing
Fig. 8. Diagram of defect detection results
|
Table 1. Feature and defect classification matching table
| |||||||||||||||||||||||||
Table 2. Test classification results

Set citation alerts for the article
Please enter your email address
© Copyright 2018-2021 | Chinese Laser Press. All Rights Reserved 沪ICP备15018463号-20