
Yuanyuan Wang, Zhihui Li, Shifeng Niu, Wencai Yi, Shuang Liu, Zhen Yao, Bingbing Liu. Cerium-promoted conversion of dinitrogen into high-energy-density material CeN6 under moderate pressure[J]. Matter and Radiation at Extremes, 2023, 8(3): 038401
- Matter and Radiation at Extremes
- Vol. 8, Issue 3, 038401 (2023)
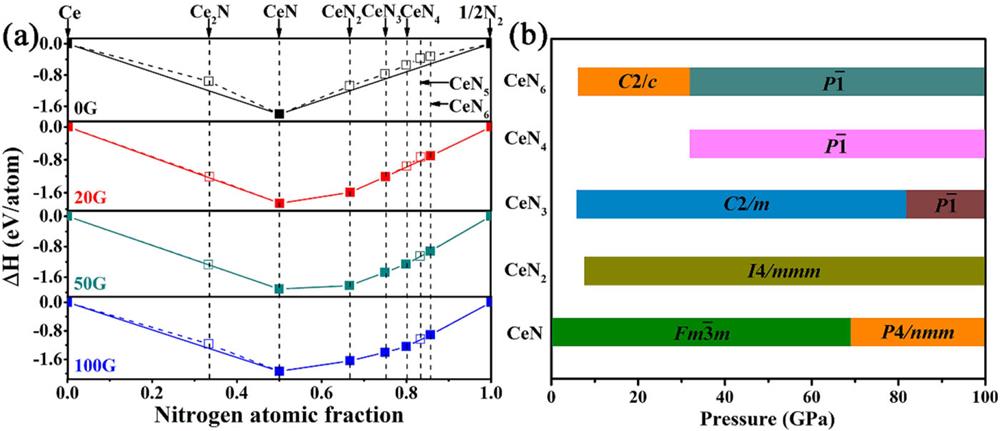
Fig. 1. (a) Formation enthalpies ΔH of various CeNn (n = 0.5, 1, 2, 3, 4, 5, and 6) compounds under high pressure. The stable phases are connected by solid lines and unstable/metastable phases by dashed lines. (b) Pressure–composition phase diagram of the predicted Ce–N phases.
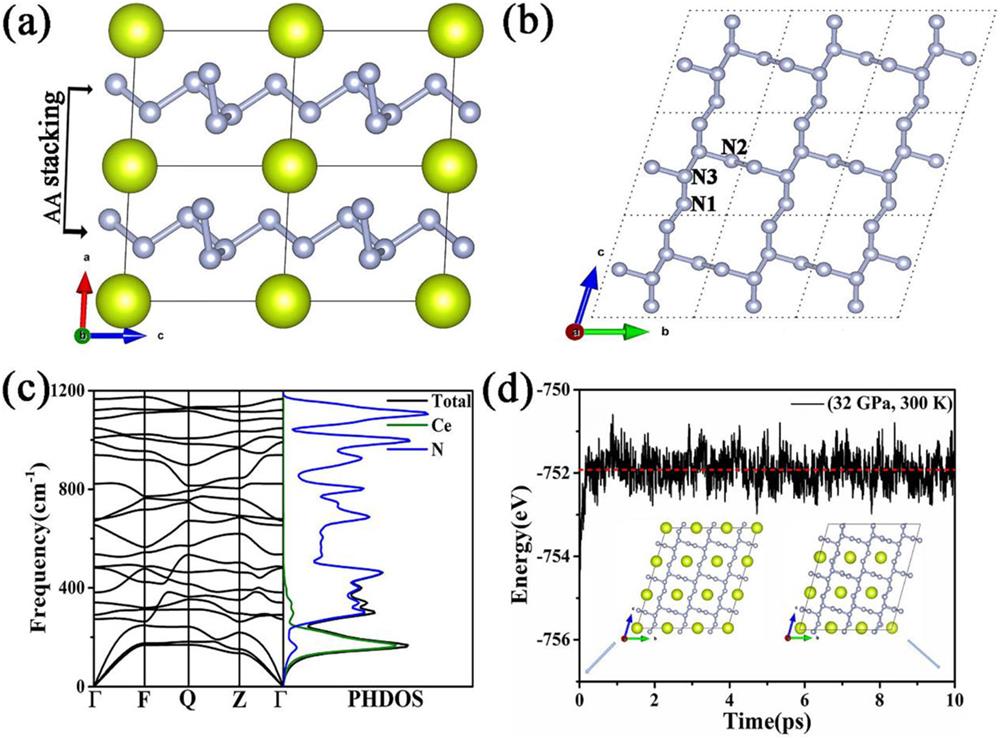
Fig. 2. (a) Crystal structure of P 1 ̄ P 1 ̄ P 1 ̄ P 1 ̄
Fig. 3. (a) ELF of P 1 ̄ n (n = 1, 2, 3, 4 and 6) compounds at 32 GPa.
Fig. 4. (a) Crystal structure, (b) −pCOHP and −ICOHP, and (c) PDOS of N2 molecular crystal. (d) Crystal structure, (e) −pCOHP and −ICOHP, and (f) PDOS of trans -CeN6. (g) Crystal structure, (h) −pCOHP and −ICOHP, and (i) PDOS of P 1 ̄
Fig. 5. (a) Phonon dispersion curve and PHDOS of P 1 ̄ g (r ) and structures of final states from the last 2 ps of AIMD simulations at ambient pressure and temperatures of 300 K (solid lines) and 1000 K (dotted lines). (c) PDOS of P 1 ̄ P 1 ̄ P 1 ̄
Fig. 6. (a) 3D surface and (b) 2D projected profiles of Young’s modulus in P 1 ̄
|
Table 1. Mass density ρ, mass energy density Ed, volumetric energy density Ev, detonation velocity Vd, and detonation pressure Pd of
|
Table 2. Bulk modulus B, shear modulus G, Young’s modulus E, Poisson’s ratio ν, and Vickers hardness Hv of

Set citation alerts for the article
Please enter your email address
© Copyright 2018-2021 | Chinese Laser Press. All Rights Reserved 沪ICP备15018463号-20