• Photonics Research
  • Vol. 11, Issue 5, 732 (2023)
Angela Capocefalo1、†, Silvia Gentilini1、†, Lorenzo Barolo2, Paola Baiocco2, Claudio Conti1、3, and Neda Ghofraniha1、*
Author Affiliations
  • 1Istituto dei Sistemi Complessi-CNR, UOS Università La Sapienza, I-00185 Rome, Italy
  • 2Dipartimento di Scienze Biochimiche A. Rossi Fanelli, Università La Sapienza, I-00185 Rome, Italy
  • 3Dipartimento di Fisica, Università La Sapienza, I-00185 Rome, Italy
  • show less
    DOI: 10.1364/PRJ.477139 Cite this Article Set citation alerts
    Angela Capocefalo, Silvia Gentilini, Lorenzo Barolo, Paola Baiocco, Claudio Conti, Neda Ghofraniha. Biosensing with free space whispering gallery mode microlasers[J]. Photonics Research, 2023, 11(5): 732 Copy Citation Text show less
    Optical characterization of lasing polystyrene microspheres. (a) Sketch of the optical setup and of the sample employed in the experiment. The polystyrene microspheres are deposited onto a microscope slide with grids previously functionalized with APTES. The laser light is focused on the sample by an objective with a spot size of ∼50 μm. The light emitted by the sample is collected by a second objective and then is split on a charge-coupled device camera for fluorescence imaging and on an optical fiber connected to a spectrometer. (b) Fluorescence image of a single polystyrene microsphere. (c) Emission spectra of a microlaser in water; WGMs are evident. (d) Spectral intensity versus input pumping showing the threshold between spontaneous and stimulated emission estimated at about 7 μJ/mm2.
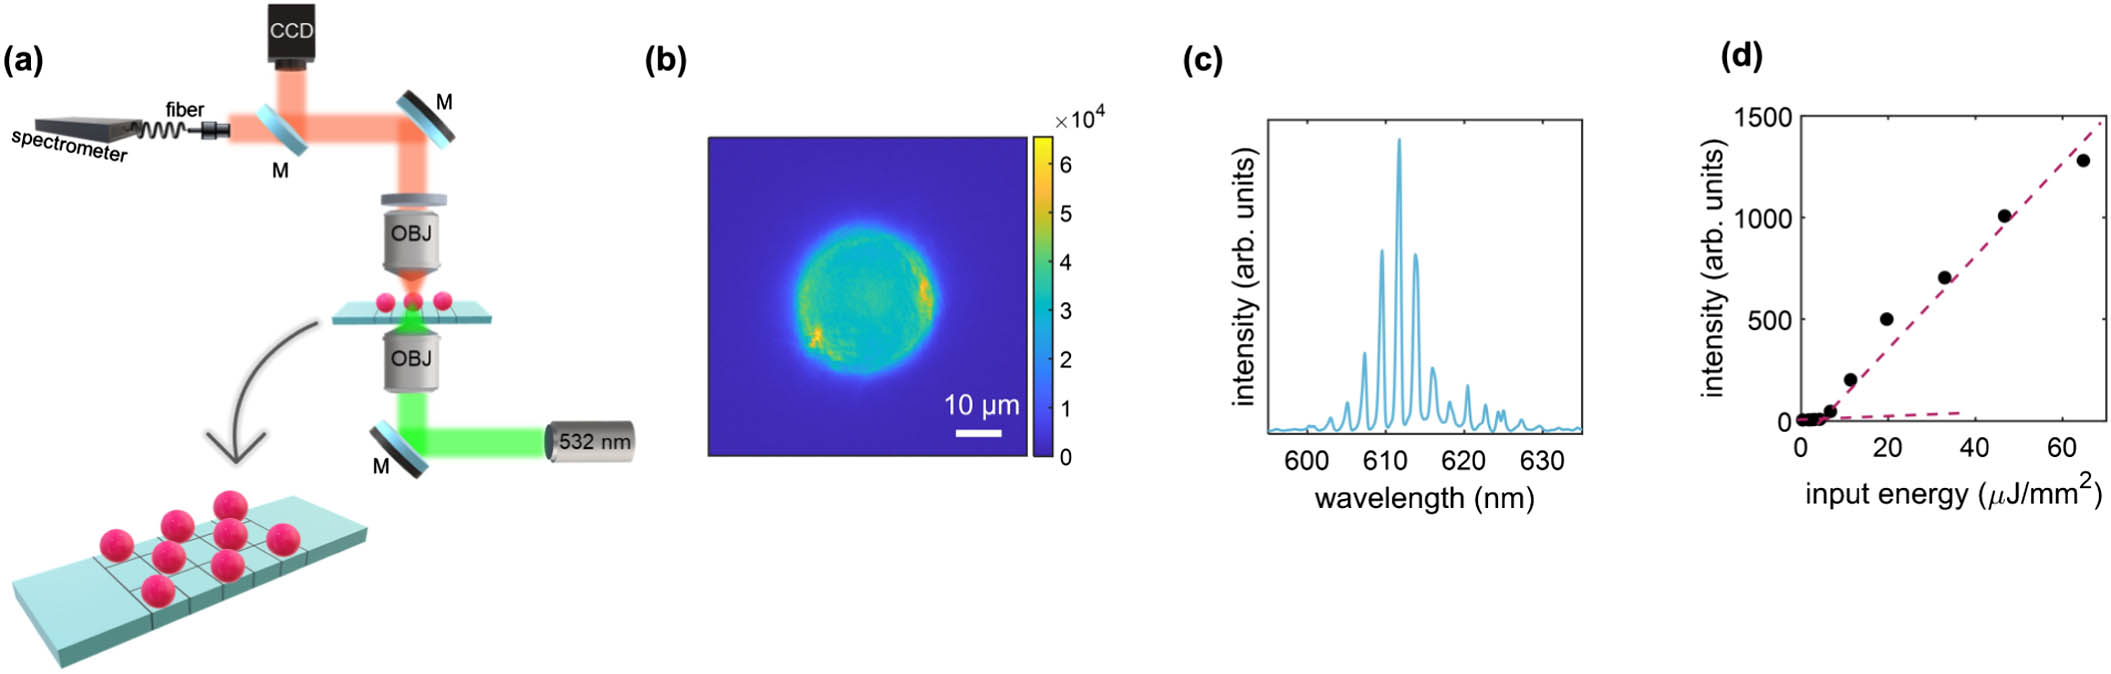
    Fig. 1. Optical characterization of lasing polystyrene microspheres. (a) Sketch of the optical setup and of the sample employed in the experiment. The polystyrene microspheres are deposited onto a microscope slide with grids previously functionalized with APTES. The laser light is focused on the sample by an objective with a spot size of 50  μm. The light emitted by the sample is collected by a second objective and then is split on a charge-coupled device camera for fluorescence imaging and on an optical fiber connected to a spectrometer. (b) Fluorescence image of a single polystyrene microsphere. (c) Emission spectra of a microlaser in water; WGMs are evident. (d) Spectral intensity versus input pumping showing the threshold between spontaneous and stimulated emission estimated at about 7  μJ/mm2.
    Analysis of the wavelength shift of the lasing emission peaks of a single polystyrene microsphere in liquid induced by the absorption of tau proteins. (a) Sketch of the experiment. A drop of protein solution is deposited onto a polystyrene microsphere, and emission spectra are acquired on the soaked microsphere. (b) Emission spectra of a microsphere immersed in water (gray) and in tau protein (orange) suspension. (c), (d) Time evolution of the central emission wavelength, obtained by peak fitting, of a selected lasing peak (highlighted in yellow in the spectra in the top panel) for PBS buffer [blue (c)] and tau protein [orange (d)]. Time interval between two depositions is about 5 min. In the insets, the trend of the corresponding wavelength shift Δλ is reported. (e), (f) Values of the wavelength shifts Δλ obtained for different microspheres for PBS buffer (e) and tau proteins (f). The dashed lines indicate the average value of Δλ.
    Fig. 2. Analysis of the wavelength shift of the lasing emission peaks of a single polystyrene microsphere in liquid induced by the absorption of tau proteins. (a) Sketch of the experiment. A drop of protein solution is deposited onto a polystyrene microsphere, and emission spectra are acquired on the soaked microsphere. (b) Emission spectra of a microsphere immersed in water (gray) and in tau protein (orange) suspension. (c), (d) Time evolution of the central emission wavelength, obtained by peak fitting, of a selected lasing peak (highlighted in yellow in the spectra in the top panel) for PBS buffer [blue (c)] and tau protein [orange (d)]. Time interval between two depositions is about 5 min. In the insets, the trend of the corresponding wavelength shift Δλ is reported. (e), (f) Values of the wavelength shifts Δλ obtained for different microspheres for PBS buffer (e) and tau proteins (f). The dashed lines indicate the average value of Δλ.
    Analysis of the wavelength shift of the lasing emission peaks of a single polystyrene microsphere due to multiple depositions of lysozyme solution. (a) Sketch of the experiment. A drop of lysozyme solution is deposited onto a polystyrene microsphere and left to dry. The procedure is repeated three times. (b) Zoom on a selected lasing peak of the microsphere emission spectra at varying lysozyme amounts compared with the emission spectra of the bare microsphere (gray). (c) Average wavelength shifts of selected lasing peaks as a function of the lysozyme protein mass Mp. The averages are calculated on the three to four most intense resonances of whole spectra from different points of 30 spheres. The dashed gray curve represents the saturation growth fitting curve following Eq. (1), and the red line indicates the linear fit in the low concentration regime to extrapolate the limit of detection.
    Fig. 3. Analysis of the wavelength shift of the lasing emission peaks of a single polystyrene microsphere due to multiple depositions of lysozyme solution. (a) Sketch of the experiment. A drop of lysozyme solution is deposited onto a polystyrene microsphere and left to dry. The procedure is repeated three times. (b) Zoom on a selected lasing peak of the microsphere emission spectra at varying lysozyme amounts compared with the emission spectra of the bare microsphere (gray). (c) Average wavelength shifts of selected lasing peaks as a function of the lysozyme protein mass Mp. The averages are calculated on the three to four most intense resonances of whole spectra from different points of 30 spheres. The dashed gray curve represents the saturation growth fitting curve following Eq. (1), and the red line indicates the linear fit in the low concentration regime to extrapolate the limit of detection.
    3D-FDTD numerical simulations. (a) Illuminated bare microsphere and (b) microsphere surrounded by nanoparticles with a snapshot of the x–y (bottom), y–z (right), and x–z (left) spatial profiles of the electric field obtained slicing the sphere in the middle planes. (c) Normalized spectrum of Ey(t) calculated by means of the Fourier transform for the bare microsphere (blue) and for the microsphere surrounded by nanoparticles (red) at volume fraction ϕ=0.1. (d) Zoom on the most intense peak of the spectra, showing the redshift Δλ=0.25 nm in the presence of nanoparticles.
    Fig. 4. 3D-FDTD numerical simulations. (a) Illuminated bare microsphere and (b) microsphere surrounded by nanoparticles with a snapshot of the xy (bottom), yz (right), and xz (left) spatial profiles of the electric field obtained slicing the sphere in the middle planes. (c) Normalized spectrum of Ey(t) calculated by means of the Fourier transform for the bare microsphere (blue) and for the microsphere surrounded by nanoparticles (red) at volume fraction ϕ=0.1. (d) Zoom on the most intense peak of the spectra, showing the redshift Δλ=0.25  nm in the presence of nanoparticles.
    (a) Spectra taken at different points on the edge of a microlaser and (b) zoom on one peak.
    Fig. 5. (a) Spectra taken at different points on the edge of a microlaser and (b) zoom on one peak.
    Analysis of the wavelength shift of the lasing emission peaks of a single polystyrene microsphere in liquid induced by the absorption of BSA and lysozyme proteins. (a) Sketch of the experiment. A drop of protein solution is deposited onto a polystyrene microsphere, and emission spectra are acquired on the soaked microsphere. (b), (c) Emission spectra of two different microspheres immersed in water (gray) and in BSA [blue (b)] and lysozyme [red (c)] suspensions. The volume fractions of the protein dispersions are ϕBSA=0.016 and ϕlysozyme=0.007. (d)–(f) Time evolution of the central emission wavelength of a selected lasing peak (highlighted in yellow in the spectra in the top panels) for BSA [blue (e)] and lysozyme [red (f)]. In (d), peak positions of two different water drops are reported. The dashed lines indicate average values. Time interval between two depositions is about 5 min.
    Fig. 6. Analysis of the wavelength shift of the lasing emission peaks of a single polystyrene microsphere in liquid induced by the absorption of BSA and lysozyme proteins. (a) Sketch of the experiment. A drop of protein solution is deposited onto a polystyrene microsphere, and emission spectra are acquired on the soaked microsphere. (b), (c) Emission spectra of two different microspheres immersed in water (gray) and in BSA [blue (b)] and lysozyme [red (c)] suspensions. The volume fractions of the protein dispersions are ϕBSA=0.016 and ϕlysozyme=0.007. (d)–(f) Time evolution of the central emission wavelength of a selected lasing peak (highlighted in yellow in the spectra in the top panels) for BSA [blue (e)] and lysozyme [red (f)]. In (d), peak positions of two different water drops are reported. The dashed lines indicate average values. Time interval between two depositions is about 5 min.
    3D-FDTD numerical simulations. (a) Snapshot of the xy spatial profile of the electric field in the middle plane of the sphere. (b) Y-component of the electric field, Ey(t) evolution collected in a point on the surface of the sphere [red bullet in (a)]. (c) Normalized spectrum of Ey(t) calculated by means of the Fourier transform.
    Fig. 7. 3D-FDTD numerical simulations. (a) Snapshot of the xy spatial profile of the electric field in the middle plane of the sphere. (b) Y-component of the electric field, Ey(t) evolution collected in a point on the surface of the sphere [red bullet in (a)]. (c) Normalized spectrum of Ey(t) calculated by means of the Fourier transform.
    Numerical FDTD sensing. (a) Superimposed spectra of Ey(t) as obtained for five different volume fractions ϕ of dielectric nanoparticles randomly distributed on the sphere surface. The red dashed curve indicates the spectral content of the short pulsed input excitation. (b) Zoom on the central peak at varying nanoparticle volume fractions.
    Fig. 8. Numerical FDTD sensing. (a) Superimposed spectra of Ey(t) as obtained for five different volume fractions ϕ of dielectric nanoparticles randomly distributed on the sphere surface. The red dashed curve indicates the spectral content of the short pulsed input excitation. (b) Zoom on the central peak at varying nanoparticle volume fractions.
    Angela Capocefalo, Silvia Gentilini, Lorenzo Barolo, Paola Baiocco, Claudio Conti, Neda Ghofraniha. Biosensing with free space whispering gallery mode microlasers[J]. Photonics Research, 2023, 11(5): 732
    Download Citation