
Angela Capocefalo, Silvia Gentilini, Lorenzo Barolo, Paola Baiocco, Claudio Conti, Neda Ghofraniha, "Biosensing with free space whispering gallery mode microlasers," Photonics Res. 11, 732 (2023)
- Photonics Research
- Vol. 11, Issue 5, 732 (2023)
Abstract
1. INTRODUCTION
Light in a dielectric hollow cavity of micrometric size is trapped on its surface in so-called whispering gallery modes (WGMs). For high quality-factors Q, the enhancing interaction with the dielectric environment makes WGM resonators sensitive to infinitesimal variations of the surrounding refractive index, leading to a measurable shift of the resonance wavelength [1,2]. In the last two decades, ultrahigh Q passive microcavities have been used for label-free single molecule detection by employing lithographed silica microresonators with very high sensitivity. Highly diluted samples, such as
Active cavities that support stimulated emission modulated by WGM resonances can be obtained by including a gain medium in the dielectric cavity. The first WGM laser was made from a highly polished crystalline calcium fluoride (CaF2) sphere of 1–2 mm diameter, and the rare-earth samarium ion (Sm2+) was used as the optical gain dopant [5]. Since then, lasing has been demonstrated in many different spherical WGM cavity geometries [6,7] and others [8], such as triangular nanoplatelets [9], ZnO hexagonal and dodecagonal microrods, nanonails, and microgoblets [10,11].
During the last few years, promising applications of WGM microlasers in biosensing have been reported, such as lasing within living cells [12,13], monitoring contractility in cardiac tissue [14], detection of electrostatic changes induced by molecules at biointerfaces [15], label-free detection of single virus particles [16], and advancement of
Sign up for Photonics Research TOC. Get the latest issue of Photonics Research delivered right to you!Sign up now
The use of WGM microlasers for chemical and biological sensing can offer assets that are often not easily accessed on other optical WGM sensors [18]. Indeed, the advantages of using microlaser emission compared to the transmission of silica microparticles measured by a fiber tapered technique, of more widespread use, are the ease in assembling the compact and versatile optical setup due to free space detection without any need of fine wave guiding [19,20], the possibility of exciting a high number of microresonators with good statistics of the measurements, and the benefit of using materials other than silica without resorting to lithographic techniques that require the use of clean rooms and specific infrastructures.
Furthermore, WGM microlasers offer potentially very high detection sensitivity for molecules due to the narrow linewidth of the laser lines. The detection of a very low concentration of biomolecules becomes possible if these spectral WGM shifts are resolved. Besides line shifting, other interesting WGM sensing modalities have been reported [16,21–24].
Biosensors with WGM laser activity have been realized by using liquid droplets for the detection of inoculated bacteria [25], intracellular investigation [17], and real time enzymatic reaction [15]. In addition, optofluidic lasers have been fabricated for DNA and virus sensing as well as enzymatic reaction catalysis. In these sensors, WGMs are activated directly on the walls of the channels where biofluids flow, and biomolecules are detected [26,27].
The limits of these biosensors are the restricted rigidity and stability of the droplets and the difficulties of doing surface treatments for specific detection [28–31]. To this aim, using polymeric microlasers operating in both air and solution is essential and still being explored with a few examples reported. These have been inoculated in cells for the follow-up of intracellular activity and cell tagging and tracking [12]. Different solid polymeric microlasers have been obtained and characterized [32,33], but none has shown sensitivity to the external presence of biomolecules indispensable for immunoassays and sensing devices.
Here we report on the realization and characterization of laser-based biosensors made of single or arrays of dyed polymeric spheres patterned on glass substrates. They operate in both air and solution and present evident emission line shifts once covered with a drop of protein solution. We obtain a limit of detection (LOD) of 0.38 ng for lysozyme protein in air. This limit is the lowest for bare spheres with non-specific protein bindings. We test the microlaser biosensor on three different protein suspensions obtaining a sensitivity of 148 nm/RIU for tau protein suspension. The results are achieved by using an experimental setup that allows to map emission spectra along the equatorial sections of the lasing spheres. This way, it is possible to perform averages of spectral shifts over different probe points and increase the accuracy of the results. To have good statistics and significant data, we repeat the same operation on arrays of about 30 microspheres, and we record and analyze emission spectra by carrying out automated scanning of the assays. Our experimental results open the way to the development of optical devices for specific and highly sensitive detection and potentially optimized to be used as photonic immunoassays and early-stage disease biosensors.
In addition, we describe an advanced numerical investigation of light localization on the surface of a WGM spherical cavity in both time and space. We perform three-dimensional finite difference time domain (3D-FDTD) simulations to show numerically significant spectral line shifts in the presence of nanoparticles on the microsphere surface.
This investigation is relevant in support of experimental procedures and fine spectral analysis.
2. METHODS
A. Experimental Setup and Characterization
In this investigation, we show and analyze the performance of microlaser biosensors made of fluorescent polystyrene microspheres. The dry-dyed polystyrene microspheres (Fluoro-Max Dry) with a nominal diameter of 30 μm were purchased from Thermo Scientific. The refractive index is
For sample deposition, a grid pattern of squares is realized on the glass slides using a diamond tip glass cutter, and then the slides are functionalized by soaking them in a 3% ethanol solution of (3-aminopropyl)triethoxysilane (APTES, Sigma Aldrich) for 3 h. Afterwards, the glass slides are rinsed with ethanol and water and left to dry. The glass slides are functionalized with APTES to fix the microsphere to the substrate and avoid their movement during experiments. Subsequently, 5 μL of the microsphere solution is incubated in each square until the water is completely evaporated.
This way, we obtain approximately one microsphere per square. We then use a homemade micromanipulator made of an atomic force microscope cantilever properly mounted on motorized translation stages. By using controlled movements of the translators, we are able to adjust microsphere positions and produce arrays of 30 microspheres per slide. A sketch of the so-obtained sample is reported in Fig. 1(a).
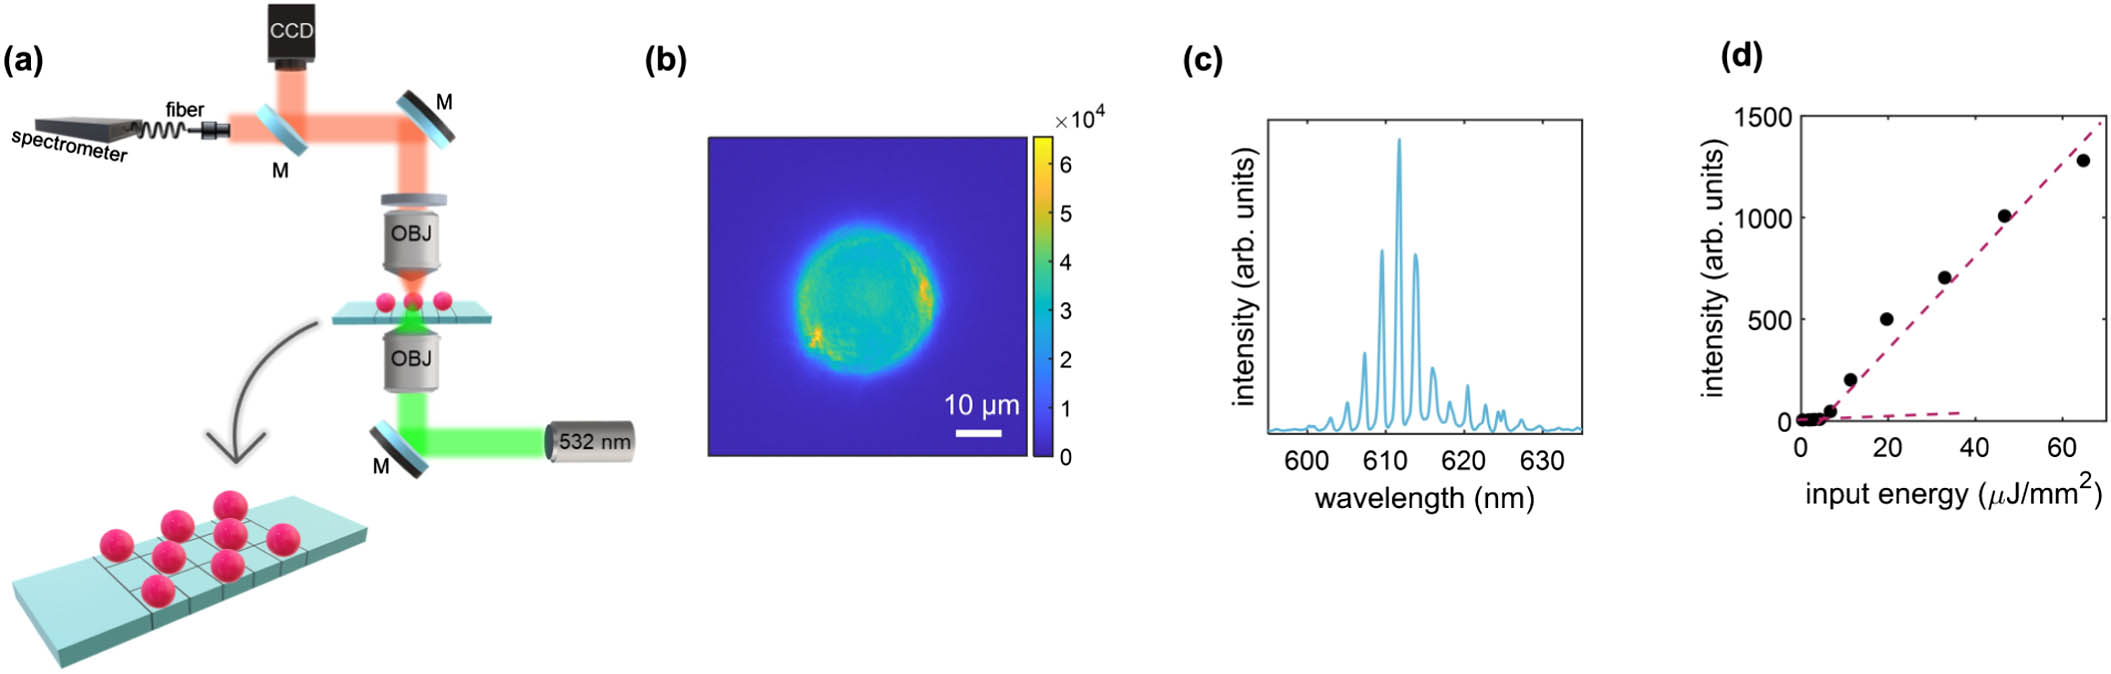
Figure 1.Optical characterization of lasing polystyrene microspheres. (a) Sketch of the optical setup and of the sample employed in the experiment. The polystyrene microspheres are deposited onto a microscope slide with grids previously functionalized with APTES. The laser light is focused on the sample by an objective with a spot size of
The microspheres are excited by a
A representative fluorescence image of a single microlaser is illustrated in Fig. 1(b), where a higher emission intensity at the edges of the sphere is evident.
The lasing emission spectrum of a single microlaser immersed in water is depicted in Fig. 1(c). The observed multi-lasing lines correspond to the excited WGMs sustained by the fluorescence band. The free spectral range (FSR) is about 2.5 nm, which is consistent with the expected value
In Fig. 1(d), the emission intensity versus increasing energy density presents a rapid growth after the threshold between spontaneous and stimulated emission at about
In this work, we use a pumping laser energy density of about
We use microspheres with a diameter of 30 μm to have an appreciable FSR of about 2.5 nm in relation to the instrumental spectral resolution of 0.11 nm. This choice allows the separation of individual resonances indispensable for line shifting examination. In addition, the selected size guarantees a suitable amount of gain inside the resonators with consequent low laser thresholds.
B. Tau Protein Preparation
Tau protein was designed from 244 to 376 amino acids and is referred to as the K18 domain, which contains four microtubule-binding repeats (MTBRs). K18 was expressed in an E. coli BL-21DE-3 strain and purified from a high-density cell paste (Genscript Biotech Corporation) as described elsewhere [38]. The purified fractions were pooled and dialyzed in a phosphate-buffered saline (PBS) pH 7.4 and then concentrated using 3 kDa cutoff protein centrifugal filters. Separation of the monomeric from higher oligomers was performed by size exclusion chromatography applying protein samples in PBS on a Hiload 26-600 Superdex 75 equilibrated in the same buffer. The concentration of tau (5 mg/mL) was determined by UV absorption at 270 nm using an extinction coefficient of
C. Numerical Simulations
To mimic the sensing performance of microresonators, we use an advanced 3D-FDTD code that reproduces electromagnetic behavior by solving the Maxwell equations with a first principle approach based on the FDTD algorithm. The Maxwell equations are discretized on faces and sides of a cubic Yee grid [39]. We used a technique developed by the authors in previous works [40,41]. Standard leapfrogging is used as the time marching algorithm, and a uniaxial perfectly matched layer (UPML) is employed to absorb outgoing waves. The code is finally parallelized within the message-passing interface (MPI) [42]. We run the code on a large-scale computational facility where a typical run requires about 5 h of calculation using about 1500 processors.
3. RESULTS AND DISCUSSION
A. Spherical Microlasers for Biosensing
For biosensing tests on liquid samples, we first soak the array of 30 microlasers, previously deposited on a glass slide, in water and take the emission spectra from different points of all spheres by automatized scanning. After water evaporation, we add a 5 μL drop of protein solution onto each microlaser, as sketched in Fig. 2(a).
![]()
Figure 2.Analysis of the wavelength shift of the lasing emission peaks of a single polystyrene microsphere in liquid induced by the absorption of tau proteins. (a) Sketch of the experiment. A drop of protein solution is deposited onto a polystyrene microsphere, and emission spectra are acquired on the soaked microsphere. (b) Emission spectra of a microsphere immersed in water (gray) and in tau protein (orange) suspension. (c), (d) Time evolution of the central emission wavelength, obtained by peak fitting, of a selected lasing peak (highlighted in yellow in the spectra in the top panel) for PBS buffer [blue (c)] and tau protein [orange (d)]. Time interval between two depositions is about 5 min. In the insets, the trend of the corresponding wavelength shift
Then, we measure emission spectra from the same points of the spheres considered for the water signal detection used as a reference. This procedure is necessary because the spectral configuration of the WGM and, thus, the emission spectra are dependent on the position of the probe point on the sphere. For this crucial issue, to compare the emission spectra, we detect them from the exactly same point on the edge of the same microsphere in all measurements. We repeat this operation on the array.
We take spectra from different sampling points on the edge of each sphere because the emission spectra might be slightly diverse as shown previously [17]. We estimate peak position variations of 0.01 nm for bare microspheres. Data are reported in Appendix A, Fig. 5. Even though this variation is well below the instrumental resolution, we use the spectral scanning technique to have good statistics and to validate the small peak shifts measured in the presence of proteins.
The evaluation of the biosensing capability of the microlasers is performed by employing the clinically relevant tau protein. It is a very flexible and highly soluble protein that belongs to the microtubule-associated protein family. Tau proteins have been identified for Alzheimer’s disease biomarkers [38,43]. In Fig. 2(b), we report representative spectra for water and aqueous solution of tau protein. Small peak redshifts of the water–protein solution curves with respect to the pure water ones are observed.
To have a quantitative and significant estimation of the small resonance shifts, we monitor the temporal evolution of the detected spectra as proposed in Refs. [3,14,44]. Lasing emission spectra as a function of time are acquired from several points of the array as described above. From each spectrum, we select the three to four peaks with the highest intensity and measure the central wavelength position of each of them in time by fitting the selected peak to a Gaussian function [14]. Since the protein is dissolved in PBS buffer solution, we first evaluate the effect of the buffer on the microresonator by comparing the position of the selected lasing peak with respect to water as reported in Fig. 2(c). For each sampling point, the temporal average of the resonance wavelengths of water (reference) and buffer solution is calculated. Then the resonance shift
As evidenced in Fig. 2(d), the measured peak wavelength corresponding to the tau protein solution is significantly different from that obtained for the reference. We estimate the average over all the measured
From the line shifts, we can estimate the sensitivity
In the following, we investigate the sensing capabilities of the laser biosensor in air. We present this second strategy because in the absence of a liquid solution and in air, the mismatch of the refractive index at the interface of the microspheres is higher. This allows to gain a much lower LOD for those cases where the presence of the solvent is not relevant.
To do so, we perform multiple depositions of 3 μL droplets of lysozyme aqueous solution with
![]()
Figure 3.Analysis of the wavelength shift of the lasing emission peaks of a single polystyrene microsphere due to multiple depositions of lysozyme solution. (a) Sketch of the experiment. A drop of lysozyme solution is deposited onto a polystyrene microsphere and left to dry. The procedure is repeated three times. (b) Zoom on a selected lasing peak of the microsphere emission spectra at varying lysozyme amounts compared with the emission spectra of the bare microsphere (gray). (c) Average wavelength shifts of selected lasing peaks as a function of the lysozyme protein mass
We perform the same operation on the three to four most intense resonances of the spectra from 30 spheres; the values in Fig. 3(c) are the calculated averages, and error bars correspond to the standard deviations.
The growth follows the typical saturation model (also named Monod’s equation)
This calculation is performed assuming that all proteins in the solution are adsorbed to the microsphere. Actually, only a fraction of them will be in contact with the microlaser, and the rest will settle on the glass slide. Therefore, here we provide an overestimation of the LOD that is expected even an order of magnitude lower if we consider the ratio between droplet and microsphere diameters. The estimated LOD is the minimum amount of biomolecules in a solution that can be detected by the microlaser sensor after solvent evaporation.
The estimated LOD is the best obtainable with bare microlasers. For better performance, further strategies are required. Specific surface chemical binding would be useful to catch the few biomolecules present in solution. Plasmonic nanoparticles coupled to optical WGMs would increase the sensitivity of the proposed polymeric microlasers. Label-free single molecule detection has been demonstrated by using metallic nanoparticles chemically attached to the surface of passive microresonators to obtain hot spots with a more intense and localized electromagnetic field. Biomolecules are then chemically attracted by these hotspots, and due to this powerful technique, single DNA molecules, single atomic ions, and enzyme conformational dynamics have been reported [44,48,49]. A different spectral analysis going beyond line shift measurements and taking into account the mutual intensity of the modes, their splitting, and fine variations could be a breakthrough in the use of microlasers as biosensors.
B. 3D-FDTD Simulations of Whispering Gallery Sensing
To provide a qualitative description of the experiments, we perform a numerical experiment by using the FDTD method [39]. We excite WGM on the surface of a 3 μm diameter sphere of polystyrene with refractive index
In this investigation, we scale the size of the microresonators by a factor of 10 compared to that of the experiments because reproducing the particle/wavelength ratio of the experiments would require a spatial grid whose computational cost is not affordable for this study. Such geometrical change affects the features of the spectra in terms of spacing and quality factor of the WGMs. However, the simulations can still have the ability to sense nanoscopic refractive index variation on the surface and the light coupling, which is a disruptive element of our experimental approach.
For the simulations, we laterally hit the surface of the microsphere with a Gaussian
In Figs. 4(a) and 4(b), we illustrate the bare microsphere and the microsphere surrounded by nanoparticles together with snapshots of the corresponding spatial profiles of the electric field
![]()
Figure 4.3D-FDTD numerical simulations. (a) Illuminated bare microsphere and (b) microsphere surrounded by nanoparticles with a snapshot of the
Details on spectral calculation are reported in Appendix C. Here we evidence that the FSR calculated as the spacing between two adjacent peaks results in
In Fig. 4(d), a zoom on one peak demonstrates a line shift
Variations of wavelength shift versus the volume fraction of the nanoparticles adsorbed to the microsphere are reported in Appendix C.
4. CONCLUSION
In conclusion, here we propose and study polymeric microlasers as efficient biosensors. We realize arrays of dyed microspheres, and we detect the emission spectra from several points on each sphere and from different spheres. Due to an automated optical setup, the advantage of using free space detection, and by monitoring the spectral variations in time, we are able to scan the emission over hundreds of points and accurately calculate spectral shifts with good statistics. This procedure mitigates the low-resolution limit of spectrometers and allows to obtain an LOD of 0.38 ng for lysozyme protein in air and a sensitivity
We also develop and perform 3D-FDTD numerical investigation to simulate the response of microresonators to incident laser radiation and light trapping resulting in whispering gallery resonances. We obtain numerical spectra with picometer wavelength resolution, and we report evident resonance shifts when dielectric nanoparticles are added to the surface. This way, we simulate a true biosensor, and our findings are helpful to design and realize sensing devices based on WGM cavities.
With this investigation, we provide a proof of concept of high-sensitivity detection of biomolecules in both dried and wet conditions by exploiting the advantage of a free space setup. Our results open the way to the fabrication of portable immunoassays for specific and accurate sensing. More importantly, microlasers can be easily visualized and used both for tagging cells and monitoring their activity in time.
Acknowledgment
Acknowledgment. We thank Mr. M.D. Deen and Dr. A. Gnoli for technical support, Dr. I. Viola for fruitful discussions, and Prof. E. Del Re and Miss E. Cooke for proofreading. P.B. and L.B. have been supported by Regione LAZIO, Lazio-Innova, POR FESR Lazio 2014-2020, European Union (https://www.europa.eu; https://www.lazioeuropa.it). We acknowledge the CINECA award (IsC92_WHISPERY) under the ISCRA initiative, for the availability of high-performance computing resources and support.
APPENDIX A: EMISSION SPECTRAL SCANNING
We report in Fig.
![]()
Figure 5.(a) Spectra taken at different points on the edge of a microlaser and (b) zoom on one peak.
APPENDIX B: BIOSENSING OF BSA AND LYSOZYME PROTEINS
In Figs.
![]()
Figure 6.Analysis of the wavelength shift of the lasing emission peaks of a single polystyrene microsphere in liquid induced by the absorption of BSA and lysozyme proteins. (a) Sketch of the experiment. A drop of protein solution is deposited onto a polystyrene microsphere, and emission spectra are acquired on the soaked microsphere. (b), (c) Emission spectra of two different microspheres immersed in water (gray) and in BSA [blue (b)] and lysozyme [red (c)] suspensions. The volume fractions of the protein dispersions are
Peak positions are estimated by a peak fitting procedure as discussed in the paper for tau protein. The temporal evolution of one peak for pure solvent and protein suspension is reported in Figs.
We can estimate the sensitivity
APPENDIX C: 3D-FDTD SIMULATIONS OF WHISPERING GALLERY SENSING
The result of a simulation for a bare microsphere is reported in Fig.
![]()
Figure 7.3D-FDTD numerical simulations. (a) Snapshot of the
![]()
Figure 8.Numerical FDTD sensing. (a) Superimposed spectra of
References
[17] M. Humar, S. H. Yun. Intracellular microlasers. Nat. Photonics, 9, 572-576(2015).
[30] E. Kim, M. D. Baaske, F. Vollmer.
[39] A. Tavlove, S. Hagness. Computational Electrodynamics: The Finite-Difference Time-Domain Method(2000).
[41] S. Gentilini, C. Conti. Optomechanics of random media. Phys. Rev. A, 91, 043813(2015).
[42] D. W. Walker, J. J. Dongarra. MPI: a standard message passing interface. Supercomputer, 12, 56(1996).
[50] T. L. McMeekin, M. L. Groves, N. J. Hipp. Refractive Indices of Amino Acids, Proteins, and Related Substances, 54-66(1964).


Set citation alerts for the article
Please enter your email address

© Copyright 2018-2021 | Chinese Laser Press. All Rights Reserved 沪ICP备15018463号-20