
Jiali Liao, Yang Gao, Yanling Sun, Lin Ma, Zhenzhong Lu, Xiujian Li, "Effects of third-order dispersion on temporal soliton compression in dispersion-engineered silicon photonic crystal waveguides," Photonics Res. 8, 729 (2020)
- Photonics Research
- Vol. 8, Issue 5, 729 (2020)
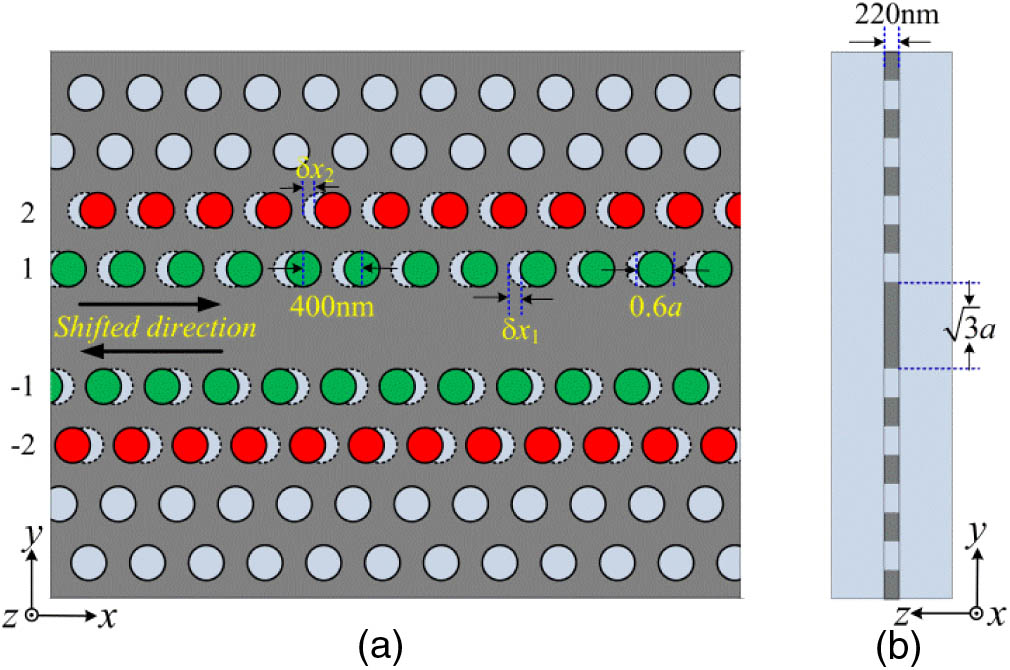
Fig. 1. (a) Design schematic of silica-clad slow-light PhCWs and (b) cross sectional view.
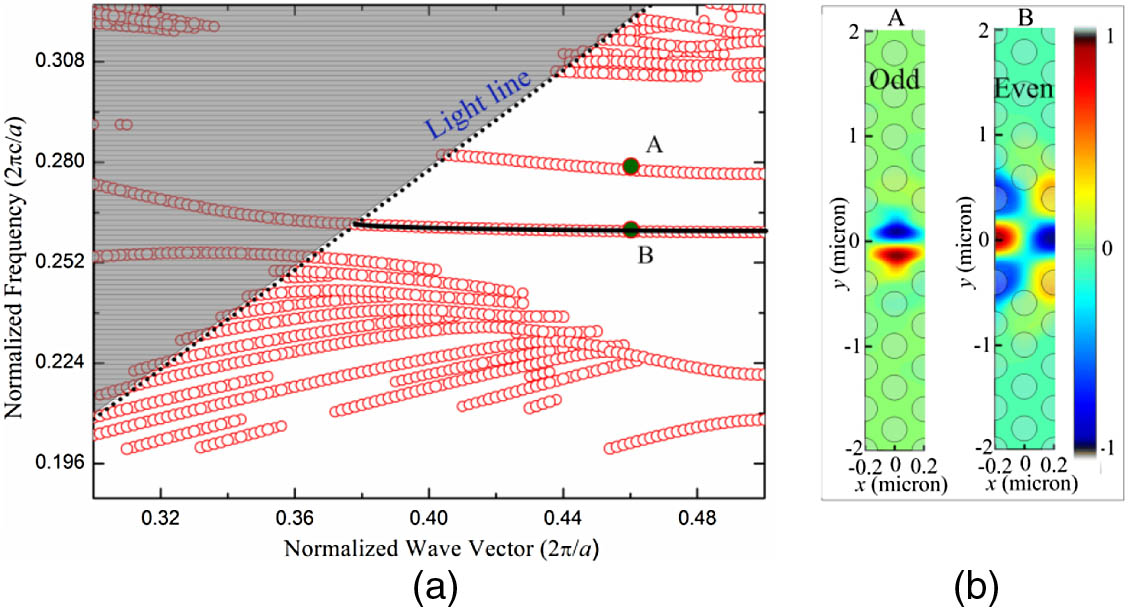
Fig. 2. (a) Band diagram of the initial silica-clad PhCWs with no lattice shifts and (b) the spatial mode profiles of the odd and even modes at normalized wave vector k = 0.46
Fig. 3. Band diagrams of the y + 1 − 1 δ x 1 0.05 a 0.2 a + 2 − 2 δ x 2 0.1 a 0.2 a δ x 1 = 0.1 a
Fig. 4. Dispersion properties of the designed PhCWs. (a) The group index of the y + 2 − 2 , δ x 2 0.2 a δ x 1 = 0.1 a δ x 1 = δ x 2 = 0.1 a
Fig. 5. Temporal intensity profiles and spectra of the input and output pulses with optimal temporal pulse compression. (a), (b) 1545 nm, input pulse energy of 18.3 pJ; (c), (d) 1550 nm, input pulse energy of 15.9 pJ; and (e), (f) 1555 nm, input pulse energy of 10.8 pJ.
Fig. 6. (a) Temporal and (b) spectral intensity profiles of the output pulses for increasing coupled pulse energies from 4 pJ to 20 pJ, at 1550 nm. The input pulse profiles are also shown in the figure bottom by black curves, and the labels denote the input pulse energies.
Fig. 7. Effects of TOD on the temporal compressed high-order solitons. The temporal intensity profiles of the compressed pulses with or without TOD, at (a) 1545 nm, (b) 1550 nm, and (c) 1555 nm.
Fig. 8. Pulse width of the compressed temporal high-order solitons, within different TOD regions. Pulse width as a function of input pulse energies at (a) 1545 nm, (b) 1550 nm, and (c) 1555 nm. Dark solid lines with squares represent the full NLSE simulation, red lines with dots represent neglecting TOD, blue lines with upper triangles represent neglecting FCD, and olive lines with lower triangles represent neglecting both TOD and FCD.
Fig. 9. Soliton compressed pulse width versus coefficient of TOD perturbation δ 3 δ 3 = | β 3 | / ( 6 | β 2 | T 0 ) β 3
Fig. 10. Pulse acceleration at (a) 1545 nm, (b) 1550 nm, and (c) 1555 nm. We show the full NLSE simulation result (solid black line), TOD off (dashed red line), FCD off (blue dotted line), both TOD and FCD off (green dot–dashed line), and free-carrier effects off (purple dot–dashed line).


Set citation alerts for the article
Please enter your email address

© Copyright 2018-2021 | Chinese Laser Press. All Rights Reserved 沪ICP备15018463号-20