High-order temporal soliton compression in dispersion-engineered silicon photonic crystal waveguides will play an important role in future integrated photonic circuits compatible with complementary metal–oxide–semiconductors. Here, we report the physical mechanisms of high-order temporal soliton compression affected by third-order dispersion (TOD) combined with free carrier dispersion (FCD) in a dispersion engineered silicon photonic crystal waveguide with wideband low anomalous dispersion. Through numerical temporal soliton evolution analysis, we report what we believe is the first demonstration of the dual opposite effects of TOD on temporal soliton compression, which are strengthening or weakening through two different physical mechanisms, not only depending on the sign of TOD but also the relative magnitude of TOD-induced equivalent group velocity dispersion (GVD) to the original GVD . We further find that FCD counteracts the effects of negative TOD on the soliton compression, while it reinforces the effects of positive TOD on the soliton compression. These results will help to design suitable dispersion-engineered silicon waveguides for superior on-chip temporal pulse compression in optical communications and processing application fields.
1. INTRODUCTION
With the capability of tightly confining optical modes, the potential for dispersion engineering, and the extremely large nonlinear effects enhanced by slow-light effects, silicon photonic crystal waveguides (PhCWs) have been extensively investigated in recent years [1–5]. Silicon PhCWs show much superiority in the application of many photonic technologies, such as temporal soliton-effects compression [6–9], four-wave mixing [10–12], Raman amplification [13–16], optical switching [17,18], and ultralow-power, all-optical signal processing [19]. Compared to air bridge PhCWs, silica-clad silicon PhCWs designed in the present research are much more mechanically and chemically stable and more compatible with a mature complementary metal–oxide–semiconductor (CMOS) process; therefore, they are more preferable in practical devices, despite the slightly weaker confinement of the optical modes [20].
Soliton compression based on the formation of high-order solitons has been demonstrated in glass fiber, periodic fiber Bragg gratings, and on-chip in semiconductors without two-photon absorption (TPA) [21–25]. Few-cycle pulses compression was also reported, particularly the generation of few-cycle solitons and supercontinuum in quadratic nonlinear waveguides by using self-defocusing Kerr nonlinearity [26–30]. Due to the remarkable TPA in silicon, which was demonstrated to induce pulse broadening [31], it used to be considered that high-order soliton compression in small-scale silicon nanowire waveguides was limited and difficult to achieve. In addition, owing to the extremely large dispersion and the large slow-light enhanced Kerr effect of PhCWs, compression of picosecond pulses with several pJ in sub-millimeter photonic waveguides was observed [6,7]. The mixed impact of various linear and nonlinear effects on soliton dynamics in silicon waveguides has been investigated [31–35], and the third-order dispersion (TOD) has been demonstrated to play a negligible role in the soliton fission with a relative smaller magnitude compared to free-carrier dispersion (FCD) [36], and to either counteract or support the pulse broadening induced by FCD combined with group velocity dispersion (FCD–GVD), relying on the sign of TOD [37].
Here, we design dispersion-engineered slow-light silica-clad waveguides with a wideband large group index and low anomalous GVD. By nonlinear Schrödinger equation (NLSE) modeling with auxiliary carrier dynamics and parameters according to practical values, we investigate the temporal and spectral properties of the temporal soliton propagation in the designed PhCWs numerically, to unveil the physical mechanisms of high-order temporal soliton compression. To the best of our knowledge, we report for the first time that TOD can either assist or weaken the high-order soliton compression with two different physical mechanisms, which are soliton fission and the increase of soliton number, not only depending on the sign of TOD, but also the relative magnitude of TOD-induced equivalent to . Furthermore, we find that the FCD counteracts the effects of negative TOD on the soliton compression, while it reinforces the effects of positive TOD on the soliton compression. The theoretical studies and numerical simulations with modeling parameters according to practical values play an important role in guiding the design and fabrication of nanowaveguide chips and the measurement experiments of ultrashort pulses. These results provide an insight into the physical mechanism of temporal dynamics induced by TOD and TOD–FCD interaction, and also provide an approach to realize superior on-chip temporal pulse compression, in support of chip-scale optical interconnects and signal processing.
Sign up for Photonics Research TOC. Get the latest issue of Photonics Research delivered right to you!Sign up now
2. DESIGN OF LOW DISPERSION WIDEBAND SLOW-LIGHT SILICA-CLAD PhCWs
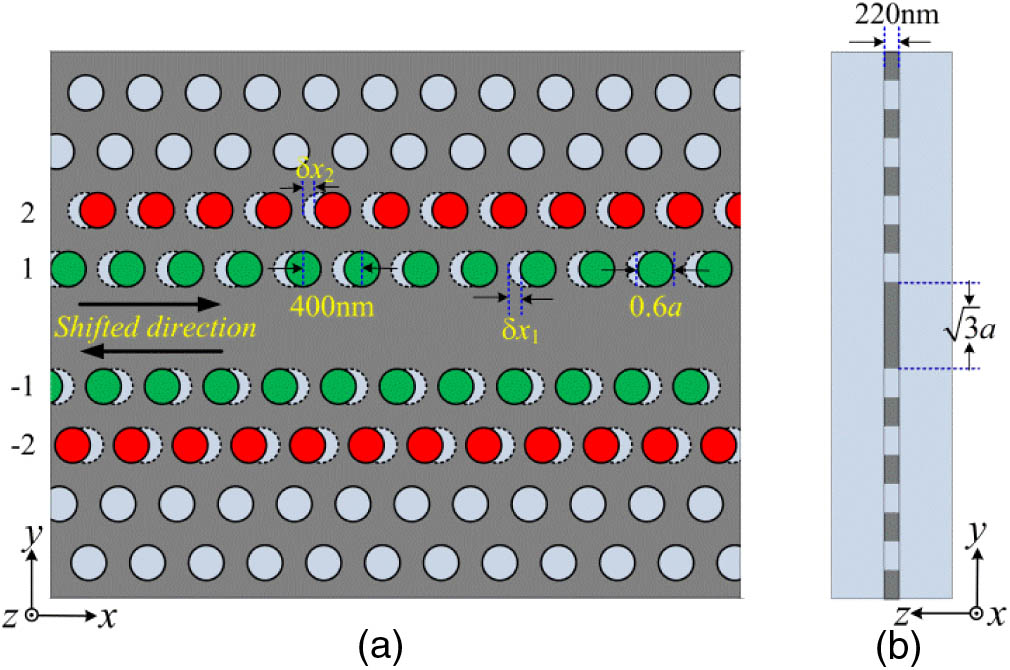
The schematic of the designed line-defect slow-light silica-clad silicon photonic crystal waveguide with low dispersion and wideband is shown in Fig. 1. Instead of an air–bridge structure, the waveguide is a silica-clad structure (i.e., it is formed on a 1 μm thick buried oxide layer and covered by a 1 μm thick oxide layer). The lattice constant , the diameter of the silica holes, and the thickness of the silicon slabs are 400 nm, 240 nm, and 220 nm, respectively, which ensures the fundamental modes cover the C band. We finely shifted the central two pairs of hole rows in opposite directions by and , as shown in Fig. 1(a), so the dispersion is tuned by the coupling between even and odd modes through the suitable perturbation of the mirror symmetry of the structure.
Figure 1.(a) Design schematic of silica-clad slow-light PhCWs and (b) cross sectional view.
With a TE-like polarized mode as the input source, we employ the three-dimensional finite-difference time-domain method to calculate the band diagram of the initial silica-clad PhCWs. The calculated band diagram and the magnetic field distribution (i.e., the spatial mode profiles of odd and even modes), are shown in Fig. 2(a) and Fig. 2(b), respectively. Points A and B in the band diagram with the same normalized wave vector of 0.46 are selected to represent the two modes with different symmetry properties (i.e., -odd and -even, respectively), as shown in Fig. 2(b). The interaction of the two modes makes it possible to effectively engineering the dispersion properties of line-defect PhCWs.
Figure 2.(a) Band diagram of the initial silica-clad PhCWs with no lattice shifts and (b) the spatial mode profiles of the odd and even modes at normalized wave vector corresponding to the points marked by A and B. The light line is denoted by the dark dot line in (a), with the light core of the PhCWs denoted by gray area above the light line.
First, the dispersion properties of the -even guided mode are engineered by the opposite-direction shifts of the two hole rows numbered by and nearest to the line defect, and the dispersion curves of the guided mode for various shifts are shown in Fig. 3(a), where the parts below the light line [i.e., denoted by the black solid line in Fig. 2(a)], are selected. Obviously, the bands of -even modes are pulled down when the hole row shift increases from (20 nm) to (80 nm). Furthermore, the tendency becomes more and more serious with an increase in the shifts range. At the same time, the linearity of the bands is improved with suitable shifts , which is the essential band characteristic to realize wideband low-dispersion slow-light PhCWs. According to up-to-date nanofabrication precision, we choose the shift step to be (20 nm).
Figure 3.Band diagrams of the -even mode for the designed silica-clad slow-light PhCWs with various shifts of hole rows. (a) Band diagrams with shifts of the hole rows numbered by and , ranging from to . (b) Band diagrams with shifts of the hole rows numbered by and , ranging from to , with a fixed . The gray area denotes the light core above the light line (green dotted line).
Further, the dispersion is finely tuned by shifts of the other two hole rows numbered by and , ranging from (40 nm) to (80 nm), with the optimized shifts of , and the results are shown in Fig. 3(b). The shifts not only pull down the bands, but also improve the linearity of the bands.
To find the optimal mixed shifts, we calculate the group index of the PhCWs for the cases described in Fig. 3(b), and the results below the light line are shown in Fig. 4(a). A flat band near 20 nm from 1540 nm to 1560 nm is obtained with , and the adjusted group index is about 20.
Figure 4.Dispersion properties of the designed PhCWs. (a) The group index of the -even mode versus wavelength for the case of the shifts of the hole rows numbered by and ranging from 0 to with a fixed . (b) GVD coefficient (left axis) and the TOD coefficient (right axis) with optimized shifts . The dispersion parameters of the three considered wavelengths are marked by red triangles (1545 nm), green squares (1550 nm), and blue dots (1555 nm), respectively.
We calculate the GVD and the TOD coefficients for the case with the optimal shifts and , and the results are shown in Fig. 4(b). The low-dispersion bands can be larger than 20 nm around 1550 nm, which covers a wide range of the optical communications band, and the absolute value of GVD is less than . At the same time, the absolute value of TOD is less than within the considered wavelength range. The GVDs are all negative (anomalous) with different absolute values for the three considered wavelengths of 1545, 1550, and 1555 nm. Particularly, the absolute value of TOD is designed to be around for the three considered wavelengths, while the signs are different: negative at 1545 nm, and positive at 1550 and 1555 nm. In this way, the pulse evolution can be studied in three distinct regions of TOD by conveniently changing the wavelength, including the sign of TOD and the relative magnitude of TOD-induced equivalent to .
3. TEMPORAL SOLITON COMPRESSION IN THE DESIGNED LOW-DISPERSION PhCWs
We simulate the temporal soliton evolution in the designed 0.5-mm-length PhCW by the nonlinear Schrödinger equation (NLSE) modeling with auxiliary carrier dynamics calibrated by the XFROG measurements [7] at the input wavelengths of 1545 nm, 1550 nm, and 1555 nm, respectively. The calibrated model is The parameters in Eqs. (1) and (2) are specified according to the practical values for the three considered wavelengths, and are introduced below. The group index and GVD coefficients are 19.5, ; 20.0, ; and 21.6, . Three TOD coefficients are , , and , for 1545 nm, 1550 nm, and 1555 nm, respectively. The effective nonlinear and TPA parameters and are and , with the nonlinear index, , and the two-photon absorption coefficient, [38]. The effective mode area is , and the refractive index of silicon is . The effective linear loss coefficient is 4 dB/mm. The effective parameters and of free carriers are and , with values of and . The free-carrier lifetime was estimated to be 0.5 ns [38]. The pulse duration of the input ideal hyperbolic-secant pulse is 2.3 ps, and the input pulse energies are 18.3 pJ, 15.9 pJ, and 10.8 pJ to obtain the optimal compression.
The simulated temporal and spectral properties of the output pulses are shown in Fig. 5. Obviously, the output pulses exhibit clear pulse compression with compression ratios of 5.0, 3.8, and 4.9, and temporal pulse accelerations of 0.78 ps, 0.32 ps, and 0.45 ps for the three input wavelengths, respectively, as shown in Figs. 5(a), 5(c), and 5(e). On the other hand, the spectra splitting and broadening occur along with a Drude blue shift of 2.5 nm, 2.3 nm, and 2.6 nm at 1545 nm, 1550 nm, and 1555 nm, as shown in Figs. 5(b), 5(d), and 5(f), induced by the free-carrier dispersion [5].
Figure 5.Temporal intensity profiles and spectra of the input and output pulses with optimal temporal pulse compression. (a), (b) 1545 nm, input pulse energy of 18.3 pJ; (c), (d) 1550 nm, input pulse energy of 15.9 pJ; and (e), (f) 1555 nm, input pulse energy of 10.8 pJ.
For the 0.5 mm length waveguide and 2.3 ps duration input pulse, the GVD lengths are 3.3 mm, 1.9 mm, and 0.8 mm for the three wavelengths, respectively, comparable to the waveguide length, which indicates the important role of GVD on the pulse evolution. The TOD lengths are 7.3 mm, 7.3 mm, and 5.7 mm, in the same order of the magnitude with , which indicates that the impact of the TOD should also be considered. The nonlinear lengths (where and are the effective nonlinear parameter and the pulse peak power) are estimated to be 0.04 mm, 0.05 mm, and 0.06 mm for the three cases, which are much shorter than the waveguide length and , supporting the higher-order soliton compression, which is weakened by the nonlinear absorption and free-carrier effects.
We perform the pulse propagation simulations to elucidate the properties of the propagating high-order soliton at an input central wavelength of 1550 nm before serious destructive soliton fission, with increasing input-coupled energies from 4 pJ to 20 pJ. The temporal and spectral intensity profiles of the output pulses are shown in Fig. 6(a) and Fig. 6(b), respectively. The high-order soliton compression along with the increasing pulse acceleration is observed obviously in the time domain. A clear soliton fission occurs at the input energy of 16 pJ, and the soliton fission is enhanced by the increase of input pulse energy to 20 pJ. The pulse quality is deteriorated by the soliton fission, and the quality factor () is defined as the ratio of the main lobe peak to the first side lobe peak to quantitate the pulse quality [39,40]. In the frequency domain, with the input pulse energies from 8 pJ to 20 pJ, the spectra exhibit more and more serious splitting, Drude blue shift, and broadening.
Figure 6.(a) Temporal and (b) spectral intensity profiles of the output pulses for increasing coupled pulse energies from 4 pJ to 20 pJ, at 1550 nm. The input pulse profiles are also shown in the figure bottom by black curves, and the labels denote the input pulse energies.
4. EFFECTS OF TOD ON THE TEMPORAL SOLITON COMPRESSION IN PhCWs
We notice that the TOD-induced equivalent [] is at the same order of magnitude as and shows obvious distinction at the three investigated wavelengths, as shown in Fig. 4(b); therefore, the impact of TOD on the pulse dynamics also should be taken into account.
The temporal intensity profiles of the compressed pulses with or without TOD are shown in Fig. 7. Obviously, the TOD weakens the pulse compression at 1545 nm and 1550 nm, while it enhances the pulse compression at 1555 nm. On the other hand, the TOD weakens the pulse acceleration of compressed high-order solitons at 1550 nm and 1555 nm, while it enhances the pulse acceleration at 1545 nm. In addition, the pulse quality of the compressed high-order solitons is deteriorated by the TOD, with a decrease of from 6.2 and 5.5 to 2.3 and 2.7, at 1545 nm and 1550 nm, respectively. It is, however, improved by the TOD, with an increase of from 3.4 to 5.5, at 1555 nm.
Figure 7.Effects of TOD on the temporal compressed high-order solitons. The temporal intensity profiles of the compressed pulses with or without TOD, at (a) 1545 nm, (b) 1550 nm, and (c) 1555 nm.
The role of the TOD, and the interaction of TOD with FCD playing in the temporal soliton compression are investigated in detail, as shown in Figs. 8(a)–8(c). Owing to the suitable design of the PhCWs structure, we can investigate the effects of TOD on the temporal soliton compression in three distinct TOD regions (i.e., strong TOD perturbation with negative , strong TOD perturbation with positive , and weak TOD perturbation with positive ), by changing the input central wavelength.
Figure 8.Pulse width of the compressed temporal high-order solitons, within different TOD regions. Pulse width as a function of input pulse energies at (a) 1545 nm, (b) 1550 nm, and (c) 1555 nm. Dark solid lines with squares represent the full NLSE simulation, red lines with dots represent neglecting TOD, blue lines with upper triangles represent neglecting FCD, and olive lines with lower triangles represent neglecting both TOD and FCD.
For the case of strong TOD perturbation with negative β3 () at 1545 nm, when we turn off the TOD (red line with dots) in the model, the pulse compression is enhanced non-negligibly, from 0.46 ps to 0.32 ps at a pulse energy of 18.3 pJ [marked by a red dotted arrow in Fig. 8(a)]. Stated equivalently, the TOD weakens the soliton compression by 42%. When we turn off the FCD (blue line with upper triangle), the pulse broadens remarkably, which indicates that the FCD prevents the weakening of soliton compression induced by the TOD. When we turn off both the TOD and the FCD (olive line with lower triangle), the pulse broadens beyond the case without TOD, which results from asymmetric absorption of the free-carrier absorption (FCA).
For the case of strong TOD perturbation with positive (), at 1550 nm, the absence of TOD (red line with dots) enhances the soliton compression, similar to the case at 1545 nm, where the pulse width decreases by 71%, from 0.60 ps to 0.34 ps [marked by a red dotted arrow in Fig. 8(b)], at an input pulse energy of 15.9pJ. When we turn off the FCD (blue line with upper triangle), the pulse width exhibits a marginal decrease, which suggests that the FCD slightly reinforces the pulse broadening induced by TOD. The pulse width with the absence of both TOD and FCD (olive lines with lower triangles) is almost the same as that of the case of only neglecting TOD, which further supports the consideration that TOD is the main contribution of the soliton compression weakening.
For the case of weak TOD perturbation with positive () and larger negative () at 1555 nm with input pulse energy of 10.8 pJ, when we turn off the TOD (red line with dots), the pulse experiences noticeable broadening, from 0.47 ps to 0.71 ps [marked by a red dotted arrow in Fig. 8(c)]. Thereby, it is verified that the TOD reinforces the soliton compression by 52%. When we turn off FCD (blue line with upper triangle), the pulse broadens non-negligibly, which indicates that FCD plays a positive role in the enhancement of soliton compression induced by TOD. We further turn off both TOD and FCD (olive lines with lower triangles), the pulse width is the same as that of the case of neglecting TOD, which further supports the consideration that the enhancement of pulse compression mainly results from TOD and is reinforced by the interaction of TOD and FCD.
Therefore, the roles of TOD and the interaction of FCD and TOD on the soliton compression are determined not only by the sign of , but also the relative magnitude of TOD-induced equivalent to . The absolute value of is almost the same for the three examined wavelengths. The TOD weakens the soliton compression for cases of strong TOD perturbation, at 1545 nm and 1550 nm, although the sign of of the two cases is opposite. However, TOD enhances the soliton compression for the case of weak TOD perturbation, at 1555 nm, though the sign of is the same as that of the 1550 nm case.
Next, we will focus on unveiling the physical mechanisms of the effects of TOD and TOD–FCD interaction on the temporal soliton compression.
The TOD perturbation can be estimated by the coefficient [, where is the pulse duration] [37]. For strong TOD perturbation cases, at 1545 nm and 1550 nm, the TOD-induced pulse compression weakening is contributed by the soliton fission resulting from the strong perturbation of the TOD, where the values of are 0.075 and 0.045 for the two examined wavelengths, respectively.
When we take FCD into account, the GVD coefficient is modulated by the interaction of TOD and FCD, and the effective GVD coefficient can be defined by , where is the maximum chirp induced by the nonlinear effects involving self-phase modulation and FCD [36].
Basically, for the case of negative at 1545 nm, as the FCD-induced blue shift () results in the increase of the absolute value of , FCD counteracts the TOD-induced soliton compression weakening with a decrease of ; whereas, for the case of positive at 1550 nm, the FCD supports the TOD-induced solion compression weakening by the increase of .
Particularly, by maintaining the effective coefficient in the two cases above, when we turn off FCD and change the GVD coefficient for , the pulse widths nearly remain unchanged, which further supports the physical mechanism consideration (i.e., the soliton fission induced by TOD perturbation is responsible for the TOD-induced soliton compression weakening).
For weak TOD perturbation (0.023) at 1555 nm, TOD supports the soliton compression, which contributes to the increase of soliton number . For the negative , the positive TOD produces the decrease of absolute value by , which makes the soliton number increase and leads to the enhancement of high-order soliton compression. The FCD-induced blue shift increases the maximum pulse chirp and reinforces the enhancement of soliton compression.
Particularly, when we turn off both TOD and FCD and maintain the effective soliton number by adjusting to the value of , the pulse widths nearly remain unchanged, further supporting the conclusion that the increase in the soliton number is the physical mechanism of the high-order soliton compression enhancement induced by TOD.
To gain further insight into the weakening and enhancement of soliton compression induced by TOD through two different physical mechanisms, we calculate the pulse width versus the coefficient of TOD perturbation , at 1550 nm and 1555 nm, where the coefficient was only tuned by the increase of TOD coefficients while the GVD coefficient was constant.
For the case with a soliton number of 6.4 at 1550 nm, the compressed pulse width first decreases with an increase of ; then it increases with , as shown in Fig. 9(a). The most superior pulse compression exhibits with a compressed pulse width of 0.26 ps when the coefficient is about 0.011, indicating that the increase of the soliton number is the dominant role of TOD on the high-order solitons with weak TOD perturbation (). With a further increase of , the role of TOD is dominated by the soliton fission, leading to the compressed pulse broadening, just as our case , marked by an olive dot in Fig. 9(a).
Figure 9.Soliton compressed pulse width versus coefficient of TOD perturbation [], at (a) 1550 nm and (b) 1555 nm. Olive and purple dots denote the cases of this manuscript. Blue solid curve with squares in (b) is the case in which the sign of is only changed in the model manually.
For the case with a soliton number of 3.6 at 1555 nm, the compressed pulse width first decreases with an increase of , and then increases with , as shown in Fig. 9(b). Obviously, just as our case [marked by a purple dot in Fig. 9(b)], the best TOD assistant pulse compression exhibits at , which is more than two times of that at 1550 nm, owing to the smaller soliton number with a larger threshold of to trigger serious soliton fission. We change the sign of in the model and notice that the compressed pulse broadens more and more seriously with the increase of , regardless of the value of , indicating that positive is the essential requirement for the TOD-induced soliton compression enhancement. Furthermore, the results further support the physical mechanism that the increase in the soliton number induced by the decrease of (, ) is responsible for the soliton compression enhancement that resulted from TOD.
Based on the above discussion, we find that the combination of suitable weak TOD perturbation and positive can effectively enhance the high-order soliton compression. The optimal is dependent on the soliton numbers , with and at the cases of and , respectively.
The pulse acceleration curves for various input pulse energies at 1545 nm, 1550 nm, and 1555 nm are shown in Fig. 10(a), Fig. 10(b), and Fig. 10(c), respectively. Obviously, for the negative at 1545 nm, the pulse acceleration with TOD is stronger than that without TOD; whereas, for the positive at 1550 nm and 1555 nm, the pulse acceleration with TOD is weaker than that without TOD. Therefore, it should be pointed out that TOD affects the pulse acceleration through two effects: (1) TOD induces a shift of the soliton peak, which may result in accelerating the soliton with negative at 1545 nm, or slowing down the soliton with positive at 1550 nm and 1555 nm, and (2) TOD induces the modulation of the effective dispersion .
Figure 10.Pulse acceleration at (a) 1545 nm, (b) 1550 nm, and (c) 1555 nm. We show the full NLSE simulation result (solid black line), TOD off (dashed red line), FCD off (blue dotted line), both TOD and FCD off (green dot–dashed line), and free-carrier effects off (purple dot–dashed line).
Usually the pulse acceleration in PhCWs with anomalous GVD is dominated by the FCA-induced asymmetric pulse absorption and FCD-induced blue shift. Essentially, TOD affects the pulse acceleration through the interaction of TOD-induced dispersion modulation and FCD-induced blue shift. In the process, the negative produces a larger effective dispersion , which leads the blue shift pulses to experience a larger negative dispersion and results in the enhancement of pulse acceleration [37]. Instead, the positive reduces the effective dispersion and weakens the pulse acceleration. Therefore, the above physical mechanism of the high-order temporal soliton compression and acceleration is reasonable in principle.
5. CONCLUSIONS
In summary, based on the designed slow-light silica-clad silicon PhCWs with a wideband large group index and low anomalous GVD, we perform numerical simulations to investigate the temporal soliton evolution, especially the soliton compression, to unveil the physical mechanism of the temporal soliton compression inside the waveguide. According to the analysis, high-order temporal soliton compression is achieved with compression ratios of 5.0, 3.8, and 4.9, in three distinct dispersion regions at low pulse energies (), respectively. Briefly, we first find the dual opposite effects of TOD on temporal soliton compression, which are strengthening or weakening through two different physical mechanisms, not only depending on the sign of TOD but also the relative magnitude of TOD-induced equivalent to the original . TOD weakens the soliton compression by the soliton fission with strong TOD perturbation (0.075 and 0.045), though the signs of for the two cases of 1545 nm and 1550 nm are opposite: TOD reinforces the soliton compression by 52% originating from the increase of soliton number with weak TOD perturbation (0.023) at 1555 nm, though the sign of is the same as that at 1550 nm. Furthermore, FCD counteracts the effects of negative TOD on the soliton compression, while it reinforces the effects of positive TOD. By combining the soliton number-dependent optimal and positive , the high-order soliton compression can be enhanced effectively. In addition, we also demonstrate that the sign of determines whether TOD is enhancing or weakening the pulse acceleration of the compressed high-order solitons. Above all, these results not only unveil the physical mechanism of the effects of TOD and TOD–FCD interaction on temporal soliton compression, but also provide a new degree of dispersion engineering for PhCWs to realize superior on-chip temporal pulse compression, in support of on-chip optical interconnects and data processing.
Acknowledgment
Acknowledgment. The authors acknowledge discussions with Dr. Meicheng Fu and assistance from Dr. Matthew Marko in performing the NLSE simulations.