• Photonics Research
  • Vol. 12, Issue 3, 598 (2024)
Qiang Zhang1、2、*, Peixiang Li1, Zhiyuan Gu1, Shaoding Liu1、2, and Zejun Duan1
Author Affiliations
  • 1College of Electronic Information and Optical Engineering, Taiyuan University of Technology, Taiyuan 030024, China
  • 2Key Laboratory of Advanced Transducers and Intelligent Control System, Ministry of Education, Taiyuan University of Technology, Taiyuan 030024, China
  • show less
    DOI: 10.1364/PRJ.508159 Cite this Article Set citation alerts
    Qiang Zhang, Peixiang Li, Zhiyuan Gu, Shaoding Liu, Zejun Duan. Indefinite metacavities coupled to a mirror: bound states in the continuum with anomalous resonance scaling[J]. Photonics Research, 2024, 12(3): 598 Copy Citation Text show less
    HMMs and IMCs made of Ag–Si multilayers. (a) Real parts of effective in-pane (εx/y) and out-of-plane (εz) permittivities of the HMM. The IMC made by Ag–Si multilayers and the IFS of the corresponding HMM are shown by the left and right insets, respectively. (b) Spectrum of the radiation power of an x-direction electric dipole close to the IMC. Distributions of the predominate components of near fields of the cavity modes of selected orders.
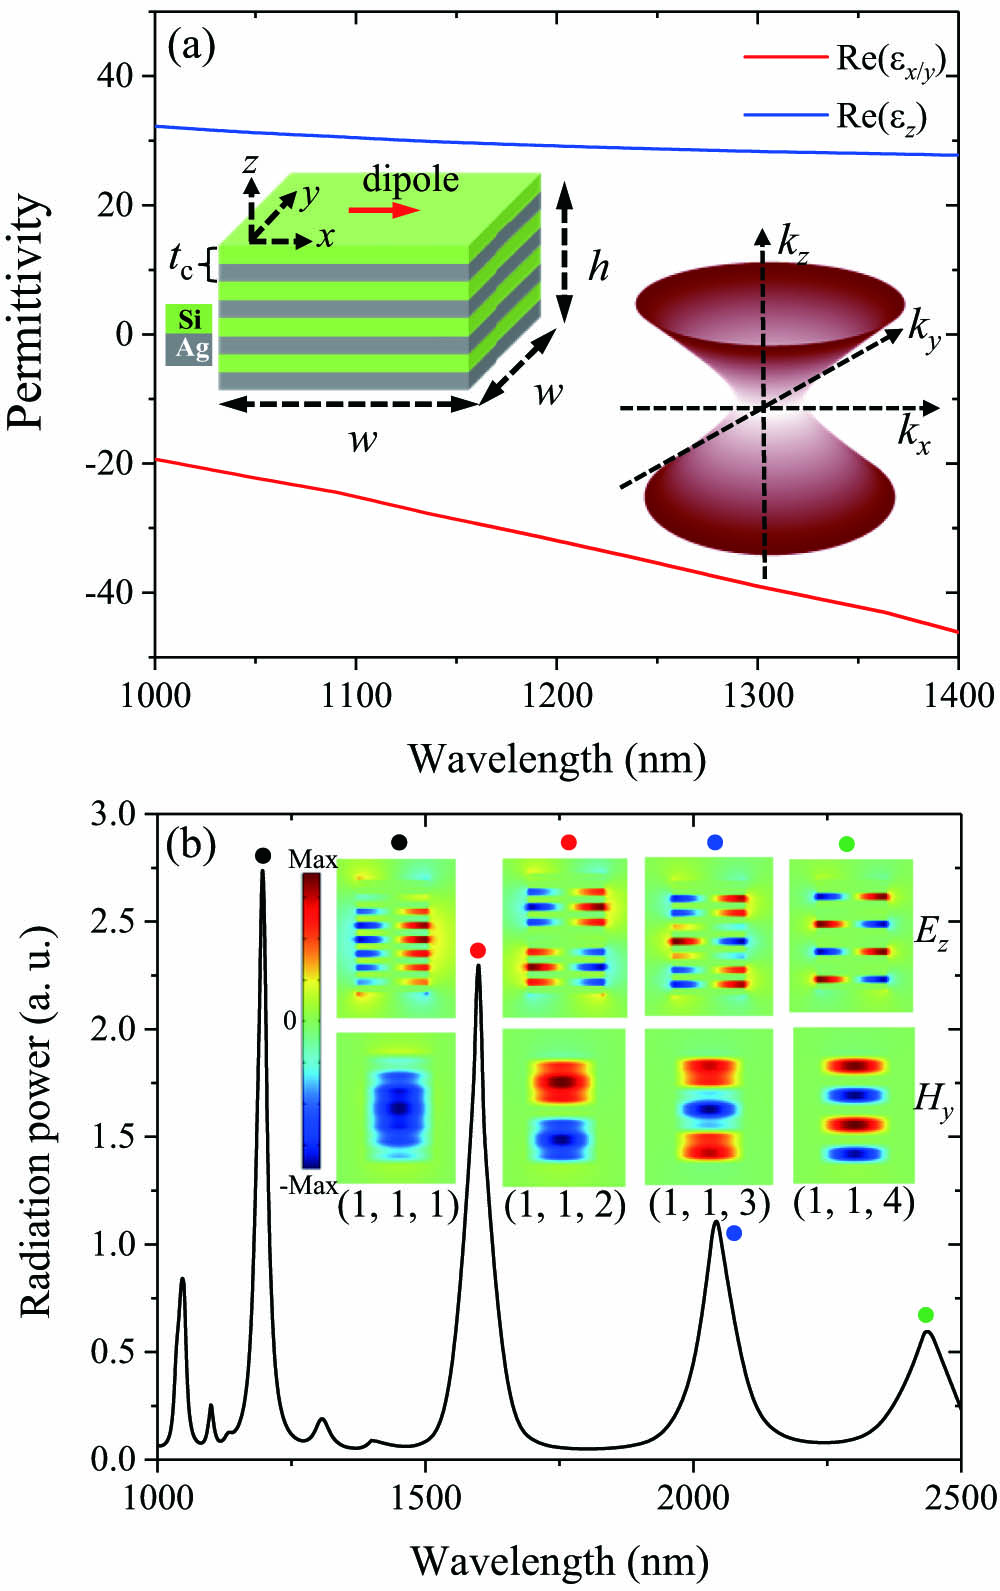
    Fig. 1. HMMs and IMCs made of Ag–Si multilayers. (a) Real parts of effective in-pane (εx/y) and out-of-plane (εz) permittivities of the HMM. The IMC made by Ag–Si multilayers and the IFS of the corresponding HMM are shown by the left and right insets, respectively. (b) Spectrum of the radiation power of an x-direction electric dipole close to the IMC. Distributions of the predominate components of near fields of the cavity modes of selected orders.
    BIC and PA in IMC arrays coupled to a reflecting mirror. (a) Schematic of the structure of IMC arrays coupled to an Ag mirror. The IMC array has a square lattice with period a=700 nm. The separation between the array and the Ag mirror is determined by the thickness of the SiO2 spacer (s). The whole structure is excited by a normally incident plane wave. (b) Evolution of absorption spectra, resonance wavelength, and Q factors as a function of s. The positions of BIC and PA are marked by the red and blue arrows. (c) Absorption spectra at the PA point (s=320 nm, red solid line), at the BIC point (s=140 nm, blue dashed line), and without the mirror (black dashed–dotted line). For comparison, the spectra of the cavity made of effective hyperbolic medium are appended as symbols. (d) Spectra of maximum electric field enhancement at the PA point, at the BIC point, and without the mirror. Amplitude distributions of electric and magnetic fields at the absorption peak at the PA point. (d) shares the same legends as (c).
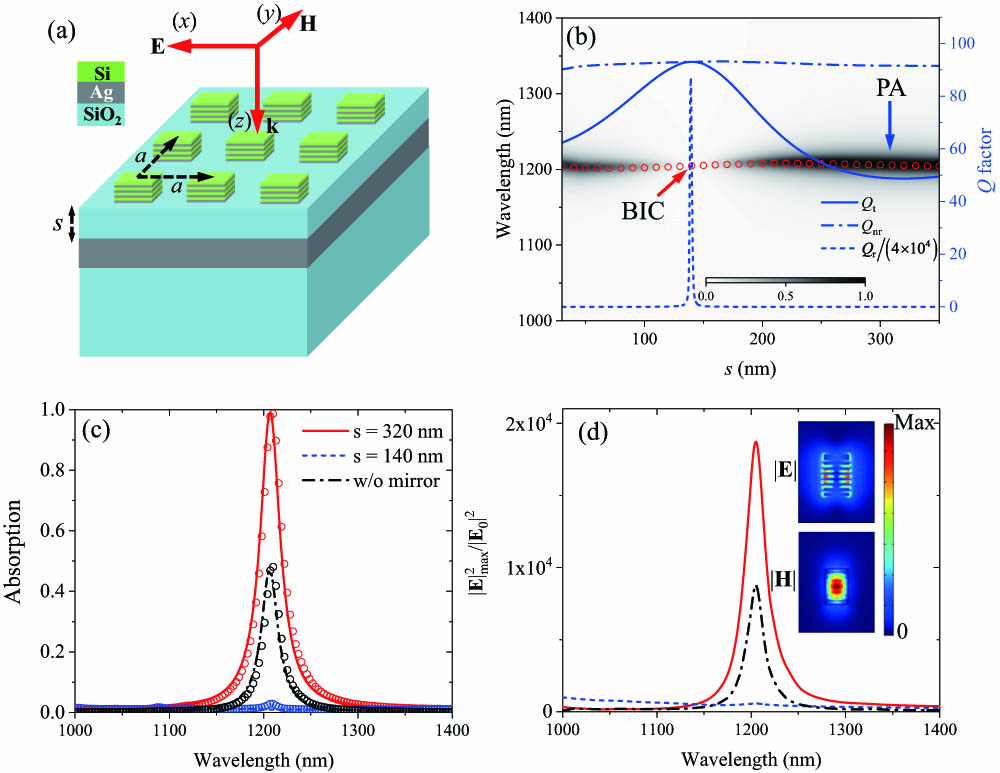
    Fig. 2. BIC and PA in IMC arrays coupled to a reflecting mirror. (a) Schematic of the structure of IMC arrays coupled to an Ag mirror. The IMC array has a square lattice with period a=700  nm. The separation between the array and the Ag mirror is determined by the thickness of the SiO2 spacer (s). The whole structure is excited by a normally incident plane wave. (b) Evolution of absorption spectra, resonance wavelength, and Q factors as a function of s. The positions of BIC and PA are marked by the red and blue arrows. (c) Absorption spectra at the PA point (s=320  nm, red solid line), at the BIC point (s=140  nm, blue dashed line), and without the mirror (black dashed–dotted line). For comparison, the spectra of the cavity made of effective hyperbolic medium are appended as symbols. (d) Spectra of maximum electric field enhancement at the PA point, at the BIC point, and without the mirror. Amplitude distributions of electric and magnetic fields at the absorption peak at the PA point. (d) shares the same legends as (c).
    Damping rates and PA realized due to critical coupling. (a) Total damping rate γt, radiative damping rate γr, and nonradiative damping rate γnr as a function of s. (b) Comparison between the absorption spectra obtained by Eq. (3) and numerical calculations.
    Fig. 3. Damping rates and PA realized due to critical coupling. (a) Total damping rate γt, radiative damping rate γr, and nonradiative damping rate γnr as a function of s. (b) Comparison between the absorption spectra obtained by Eq. (3) and numerical calculations.
    Absorption maps as a function of wavelength and s for mirror coupled IMCs with different parameters. (a) w=80 nm, (b) w=120 nm, (c) 6 Ag–Si pairs, (d) 10 Ag–Si pairs, (e) fm=0.3, and (f) fm=0.7. Other parameters are the same as those in Fig. 2.
    Fig. 4. Absorption maps as a function of wavelength and s for mirror coupled IMCs with different parameters. (a) w=80  nm, (b) w=120  nm, (c) 6 Ag–Si pairs, (d) 10 Ag–Si pairs, (e) fm=0.3, and (f) fm=0.7. Other parameters are the same as those in Fig. 2.
    Mode characteristics of mode (1, 1, 2), mode (1, 1, 3), and mode (1, 1, 4). (a) Absorption (left y axis) and reflection (right y axis) spectra of the structure in the wavelength range from 1400 to 2450 nm. The absorption peaks of mode (1, 1, 2), mode (1, 1, 3), and mode (1, 1, 4) are marked by red dot (red solid line), blue square (blue dashed line), and green triangle (green dashed–dotted line), in turn. (b) Resonance wavelengths (lines) and Q factors (symbols) as a function of s. (c) γr (lines) and γnr (symbols) as a function of s. The styles of lines and symbols in (b) and (c) are in accordance with those markers in (a) for different modes.
    Fig. 5. Mode characteristics of mode (1, 1, 2), mode (1, 1, 3), and mode (1, 1, 4). (a) Absorption (left y axis) and reflection (right y axis) spectra of the structure in the wavelength range from 1400 to 2450 nm. The absorption peaks of mode (1, 1, 2), mode (1, 1, 3), and mode (1, 1, 4) are marked by red dot (red solid line), blue square (blue dashed line), and green triangle (green dashed–dotted line), in turn. (b) Resonance wavelengths (lines) and Q factors (symbols) as a function of s. (c) γr (lines) and γnr (symbols) as a function of s. The styles of lines and symbols in (b) and (c) are in accordance with those markers in (a) for different modes.
    Enhancement of Purcell effect by BICs in mirror coupled IMC arrays. (a) Spectra of Purcell factor of the structures for different s. (b) Normalized Purcell factor as a function of s.
    Fig. 6. Enhancement of Purcell effect by BICs in mirror coupled IMC arrays. (a) Spectra of Purcell factor of the structures for different s. (b) Normalized Purcell factor as a function of s.
    Optical phase diagram of the effective medium made of stacked Ag–Si multilayers.
    Fig. 7. Optical phase diagram of the effective medium made of stacked Ag–Si multilayers.
    Cross-section view of the IFSs of Ag–Si HMMs (fm=0.5) and Si on the kx−kz plane for a short and a long wavelength. k′ is the magnitude of a reference wave vector which is set as 2π/1200 nm. The vertical dashed lines are guide for fixed kx.
    Fig. 8. Cross-section view of the IFSs of Ag–Si HMMs (fm=0.5) and Si on the kxkz plane for a short and a long wavelength. k is the magnitude of a reference wave vector which is set as 2π/1200  nm. The vertical dashed lines are guide for fixed kx.
    Qiang Zhang, Peixiang Li, Zhiyuan Gu, Shaoding Liu, Zejun Duan. Indefinite metacavities coupled to a mirror: bound states in the continuum with anomalous resonance scaling[J]. Photonics Research, 2024, 12(3): 598
    Download Citation