Qiang Zhang, Peixiang Li, Zhiyuan Gu, Shaoding Liu, Zejun Duan, "Indefinite metacavities coupled to a mirror: bound states in the continuum with anomalous resonance scaling," Photonics Res. 12, 598 (2024)
Copy Citation Text
【AIGC One Sentence Reading】:Hyperbolic metacavity coupled with a mirror achieves high Q factor and strong near-field enhancement by exploiting bound states in the continuum, offering a new design approach for optical nanocavities with strong light-matter interactions.
【AIGC Short Abstract】:In this study, we introduced a mirror-coupled indefinite metacavity structure operating at Fabry-Pérot bound states in the continuum. This design significantly enhances the Q factor and near-field intensity, demonstrating robust geometry and material composition. The Purcell effect is improved, offering a new approach for creating ultra-small optical nanocavities with strong light-matter interactions, potentially benefiting various applications.
Note: This section is automatically generated by AI . The website and platform operators shall not be liable for any commercial or legal consequences arising from your use of AI generated content on this website. Please be aware of this.
Abstract
Indefinite metacavities (IMCs) made of hyperbolic metamaterials show great advantages in terms of extremely small mode volume due to large wave vectors endowed by the unique hyperbolic dispersion. However, quality () factors of IMCs are limited by Ohmic loss of metals and radiative loss of leaked waves. Despite the fact that Ohmic loss of metals is inevitable in IMCs, the radiative loss can be further suppressed by leakage engineering. Here we propose a mirror coupled IMC structure which is able to operate at Fabry–Pérot bound states in the continuum (BICs) while the hyperbolic nature of IMCs is retained. At the BIC point, the radiative loss of magnetic dipolar cavity modes in IMCs is completely absent, resulting in a considerably increased factor (). Deviating from the BIC point, perfect absorption bands () along with a strong near-field intensity enhancement () appear when the condition of critical coupling is almost fulfilled. The proposed BICs are robust to the geometry and material composition of IMCs and anomalous scaling law of resonance is verified during the tuning of optical responses. We also demonstrate that the Purcell effect of the structure can be significantly improved under BIC and quasi-BIC regimes due to the further enhanced factor to mode volume ratio. Our results provide a new train of thought to design ultra-small optical nanocavities that may find many applications benefitting from strong light–matter interactions.
1. INTRODUCTION
Optical metamaterials are man-made microstructures or nanostructures that can be designed to acquire optical properties out of the scope of natural materials [1–3]. The past few decades have witnessed the rapid development of optical metamaterials ranging from left-handed materials [4–6], zero-index materials [7,8], and ultra-high-index materials [9,10] to various functional metasurfaces [11,12]. Among them, hyperbolic metamaterials (HMMs) also known as indefinite metamaterials have attracted particular interest in recent years because of their promising applications in areas such as subwavelength far-field imaging [13], spontaneous emission engineering [14–16], and active devices [17]. The principal elements of the permittivity tensor of HMMs do not have the same sign, leading to a hyperboloidal iso-frequency surface (IFS) [18–20]. In principle, wave vectors in ideal HMMs can be infinitely large. Such a unique and intriguing property makes HMMs an excellent candidate for realizing ultra-small optical cavities of which the size can be shrunk to deep-subwavelength scale. Yao et al. theoretically studied the nanometer-scale optical cavities made of HMMs, namely indefinite metacavities (IMCs), and demonstrated that the size of IMCs can be as small as ( is the wavelength in vacuum) [21]. They further found that both resonance frequencies and quality () factors of IMCs show anomalous scaling law with respect to cavity sizes. About one year after this work, three-dimensional IMCs configured as stacked metal–dielectric layers were theoretically and experimentally demonstrated by Yang et al. [22]. Inspired by these two pioneer works, much research focusing on applications of IMCs has been reported, such as surface-enhanced Raman spectroscopy [23], nonlinear optics [24,25], wave absorbers [26,27], microlasers and nanolasers [28,29], and optical and thermal radiation engineering [30–32].
Generally, many applications demonstrated in optical microcavities or nanocavities rely on the strength of light–matter interaction, which is basically determined by the ratio of factor to mode volume , i.e., [33,34]. For IMCs, can be extremely small due to the large wave vectors supported by HMMs [21,22]. However, nonradiative quality factor () of IMCs is inevitably limited by the Ohmic loss of metals, leading to total factor of reported IMCs smaller than 50 [21–23]. Notwithstanding, it is still possible to further reduce the radiative loss, in other words, improve the radiative quality factor of IMCs by structure design. Recently, optical bound states in the continuum (BICs) have gained much attention as they provide an appealing approach to obtain narrow optical resonances [35–37]. Theoretically speaking, an ideal BIC in a lossless system has an infinitely large factor and is completely decoupled to far fields [38–40]. When the BIC condition is slightly broken, BICs turn into quasi-BICs with finite but still high factors. For a system with dissipating materials, for example metals, upper limits of factors of BICs or quasi-BICs are restricted by Ohmic loss but the radiative loss can still be suppressed. Therefore, it is expected that IMCs working with BICs or quasi-BICs may show optical resonances that are not only endowed with boosted factors, but also bear the hyperbolic nature such as anomalous resonance scaling law and ultra-small mode volume.
In this work, we present such attempts by placing arrays of IMCs made of stacked metal–dielectric layers on top of a reflecting mirror to realize Fabry–Pérot BICs. Similar to high-index nanoparticles or metal–insulator–metal resonators, IMCs also support in-plane magnetic modes that can couple to their images in the mirror [41–45]. We show that Fabry–Pérot BICs and quasi-BICs are obtained when the separation between IMCs and the reflecting mirror is appropriately tuned. As expected, the radiative damping rate of the mirror coupled IMC arrays depends on the separation and can be totally suppressed at the point of BIC. More importantly, mirror coupled IMCs can still be regarded as a cavity made of effective hyperbolic material and exhibit anomalous scaling law of the resonance wavelength with respect to their sizes. Meanwhile, the principle demonstrated here opens up the possibility of obtaining near-perfect absorption (PA) with IMCs where the critical coupling condition can be fulfilled via tuning to match it with the nonradiative damping rate . As a demonstration of strong light–matter interaction, we verify that the Purcell effect of IMCs can be enhanced by BICs and quasi-BICs. Our results provide a feasible scheme that combing IMCs and BICs to design ultra-small optical nanocavities with further enhanced for widespread applications.
Sign up for Photonics Research TOC. Get the latest issue of Photonics Research delivered right to you!Sign up now
2. RESULTS AND DISCUSSION
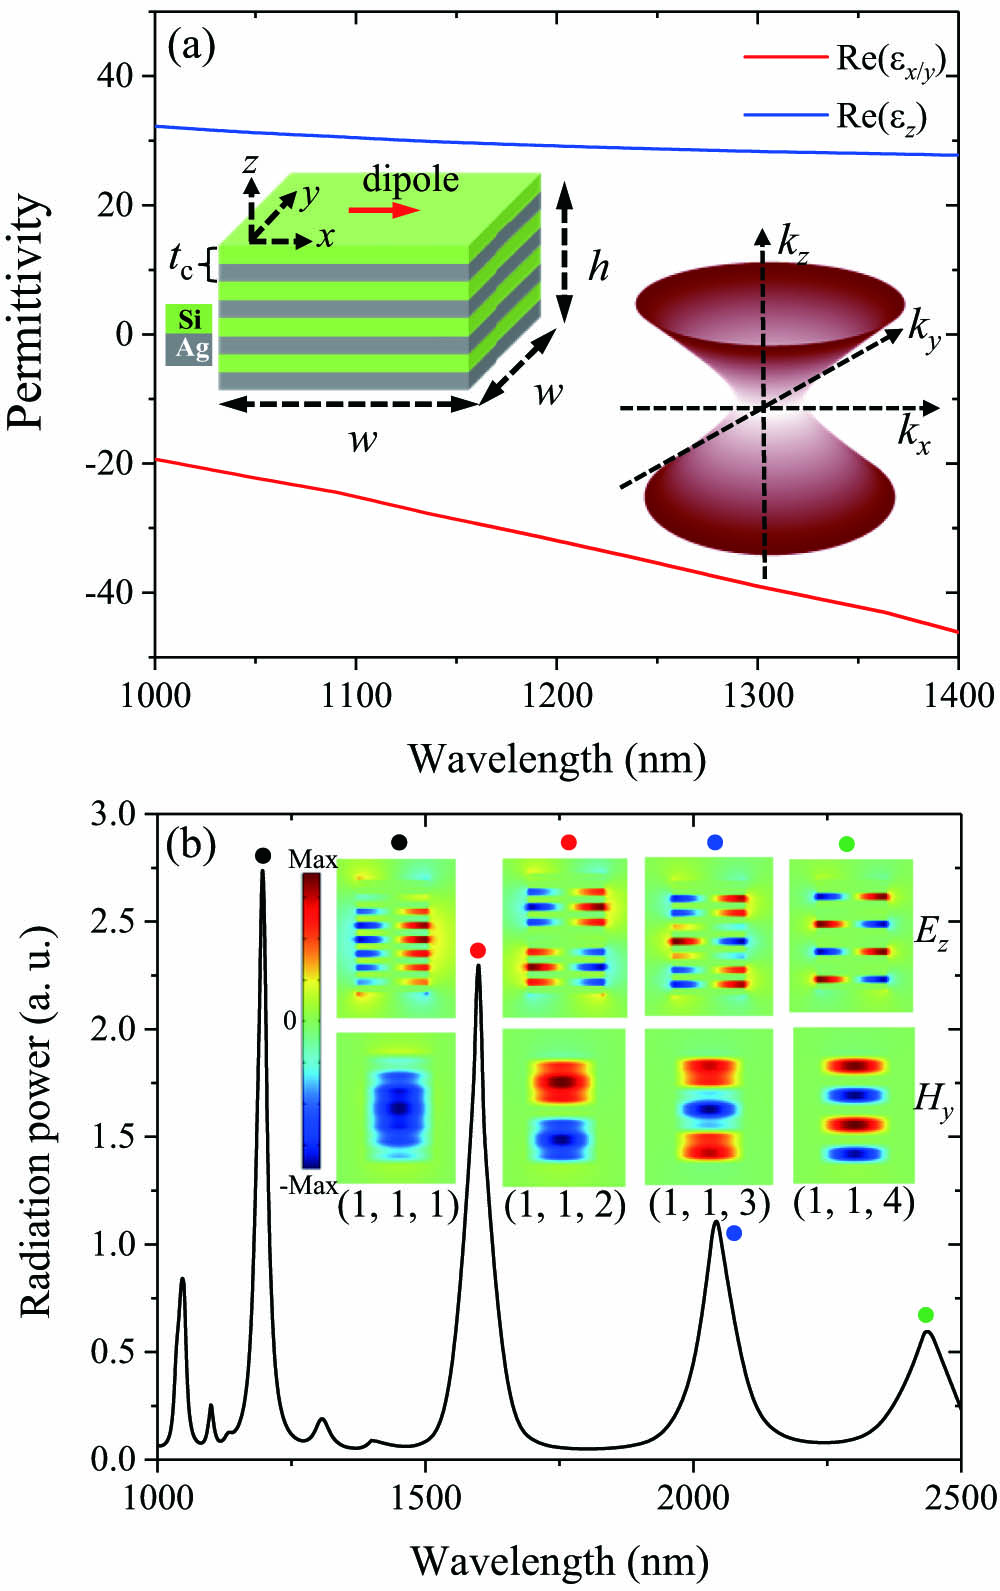
Without loss of generality, we first study the properties of HMMs configured as stacked Ag–Si multilayers where the thickness of one Ag–Si pair () is 20 nm and the filling ratio of Ag in one pair () is 0.5. The permittivity of Si is fixed as 12.25 [41] and that of Ag is taken from the empirical data [46]. Figure 1(a) shows the real parts of the effective permittivities of in-plane components and out-of-plane component of the HMM with infinite numbers of Ag–Si pairs based on Maxwell–Garnett effective media theory (see Appendix A). It is seen that and have opposite signs in the wavelength range of 1000 to 1400 nm. In detail, and indicate the studied Ag–Si multilayers correspond to a type-II HMM as confirmed by the hyperboloidal IFS given in the right inset of Fig. 1(a). Here we consider a three-dimensional IMC made of Ag–Si multilayer HMMs with width and height (eight Ag–Si pairs), as sketched by the left inset in Fig. 1(a). Such an IMC supports cavity modes of different orders that can be excited by a near-field source, for example, a point dipole. Figure 1(b) shows the calculated radiation power of an electric point dipole (red arrow) along the direction located 10 nm away from the center of the top surface of the IMC. The calculation is performed by applying the finite-difference time-domain method (see Appendix B). The spectrum of radiation power shows multiple peaks coming from cavity modes of different orders (, , ), where () indicates the number of field nodes in the direction. We focus on four dominant peaks labeled by the color dots in Fig. 1(b) and their near-field distributions of ( component of the electric field) and component of the magnetic field) on the plane are given by the corresponding insets. According to the near-field distributions, we can identify these four peaks are attributed to cavity modes of (1, 1, 1), (1, 1, 2), (1, 1, 3), and (1, 1, 4) from short to long wavelength. Here we notice that higher-order modes of the IMC are resonant at longer wavelengths, which is contrary to normal optical cavities. Such an anomalous feature is consistent with previous reports [21,22] and confirms that wave vectors within the proposed IMC bearing hyperbolic dispersion manifested as the same in-plane but larger out-of-plane wave vectors reside at IFSs at lower frequencies (see Appendix C). Another important observation is the labeled modes in Fig. 1(b) regarded as in-plane magnetic multipoles, especially mode (1, 1, 1) that is in fact a -direction magnetic dipole we will focus on later.
Figure 1.HMMs and IMCs made of Ag–Si multilayers. (a) Real parts of effective in-pane and out-of-plane permittivities of the HMM. The IMC made by Ag–Si multilayers and the IFS of the corresponding HMM are shown by the left and right insets, respectively. (b) Spectrum of the radiation power of an -direction electric dipole close to the IMC. Distributions of the predominate components of near fields of the cavity modes of selected orders.
Then, we put a square array of the above IMCs on top of a 300 nm thick Ag mirror and separate them by a (refractive index 1.45 [41]) layer with thickness of , as sketched by Fig. 2(a). Here, the lattice constant is fixed as and the whole structure is on an infinitely thick substrate and excited by a normally incident plane wave polarized along the direction. Optical responses of such a resonator-on-mirror structure can be modeled by the temporal coupled mode theory. For simplicity, here we only focus on the coupling between the magnetic dipolar cavity modes (1, 1, 1) in the IMCs and their images in the mirror. In the absence of the Ohmic loss, the Hamiltonian of the system can be expressed as Eq. (1), where is the resonant frequency of the uncoupled modes, is the near-field coupling coefficient, and and are the propagation constant and distance between two modes, respectively: The eigenvalues of in Eq. (1) can be obtained as [41,42]
Here, only one of the eigenmodes is physically meaningful as a magnetic dipole and its electric-mirror (Ag) image must be in-phase [41,42,47]. According to the mode hybridization theory [48], such in-phase coupling corresponds to the mode with higher energy . Based on Eq. (2), an ideal Fabry–Pérot BIC is realized if becomes a real number, which requires ( is an integer). It is then clear that the structure is able to work at the BIC regime either by tuning or , or both. For the propagation constant , it is determined by , where is the effective refractive index of the media between two modes and is related to the size of the cavity. Here we fix the size of IMCs, and tune by changing the thickness of the spacer. Figure 2(b) shows the calculated contour map of absorption of the structure as a function of in the wavelength range of 1000 to 1400 nm. As can be seen, there is a dominant absorption band that evolves as varies from 30 to 350 nm. In particular, zero absorption appears at (marked by the red arrow), which is exactly a BIC point where the resonance contributing to the absorption cannot be excited by the plane wave. To learn more about this resonance, eigenvalues (resonance wavelengths) and factors of this resonance are calculated by applying an eigenfrequency solver based on the finite element method (see Appendix B). As shown by the red circles in Fig. 2(b), eigenvalues match well with the center of the absorption band. Interestingly, the eigenvalues are almost independent on , which is quite different from other similar structures but with normal cavities such as Si disks or metal–dielectric–metal antennas [35–37]. We argue that this is because the near-field confinement of IMCs is more significant than other normal cavities, yielding negligible compared to when is larger than 30 nm. In addition to the total factor, (solid line), (dashed line), and (dashed–dotted line) are also calculated (see Appendix B) and appended in Fig. 2(b) to disclose the mechanism of the BIC realized in such a structure. Note that here is rescaled by for a better visual. As can be seen, , , and show very distinct trends of variation with the change of . In detail, increases rapidly when enters into a narrow range and reaches a very large magnitude at , which is exactly the hallmark of BICs. On the sharp contrast, is almost independent on and the magnitude is much smaller than that of at the BIC point. This observation can be construed by the underlying physics of BIC that it is realized by eliminating the leakage of waves from the structure to far fields, i.e., the radiative loss. On the one hand, for lossless systems such as some all-dielectric structures with negligible Ohmic loss, radiative loss is the only factor that limits the value that will become infinitely large at the BIC point [38–40]. Here the finite magnitude of at the BIC point is caused by the limited size of meshes in the numerical calculation. On the other hand, for most plasmonic systems, for example, the IMC studied here, Ohmic loss must be considered as metals are necessary structural composition. The robustness of with the change of confirms that Ohmic loss is irrelevant to the formation of BIC because it is determined by the inherent properties of the mode and the material. Based on the relationship , of the proposed structure is affected by both and , resulting in the overall slow trend of variation with the change of (see the solid line). When , reaches maximum () and converges to , implying that goes to zero and BIC is realized.
Another special point we should notice is the PA point at where the absorption is over 0.99. Figure 2(c) shows the absorption spectra of the BIC point (blue dashed line) and the PA point (red solid line). For comparison, the absorption spectrum of the array of IMCs without the Ag mirror is also given as the black dashed–dotted line. Considering the fact that no transmission is allowed due to the optically thick Ag mirror, the incident wave is totally reflected at the BIC point because the cavity mode cannot be excited. As the true BIC condition is broken when , the cavity mode is activated, and light is absorbed by the structure. In particular, PA happens when the critical coupling condition is fulfilled, as we will discuss in more detail later. Here we also append the results of the same system but Ag–Si stacked IMCs are replaced by cavities made of effective hyperbolic materials; see symbols in Fig. 2(c). As can be seen, the absorption spectra of the IMC arrays made of Ag–Si layers and effective hyperbolic materials are almost overlapped, indicating the hyperbolic nature of IMCs is kept in the BIC regime. Figure 2(d) shows the spectra of the maximum electric near-field enhancement defined as ( is the electric field of the structure under excitation and is that of the incident wave) for the structure at the PA point (red solid line), at the BIC point (blue dashed line), and without the mirror (black dashed–dotted line). It shows that the maximum near-field enhancement exceeds at the resonance of the PA point due to the ultra-strong field confinement of IMCs. The amplitude distributions of electric and magnetic fields are shown by the insets in Fig. 2(d), which confirms that the resonance is the magnetic dipolar mode (1, 1, 1).
Figure 2.BIC and PA in IMC arrays coupled to a reflecting mirror. (a) Schematic of the structure of IMC arrays coupled to an Ag mirror. The IMC array has a square lattice with period . The separation between the array and the Ag mirror is determined by the thickness of the spacer (). The whole structure is excited by a normally incident plane wave. (b) Evolution of absorption spectra, resonance wavelength, and factors as a function of . The positions of BIC and PA are marked by the red and blue arrows. (c) Absorption spectra at the PA point (, red solid line), at the BIC point (, blue dashed line), and without the mirror (black dashed–dotted line). For comparison, the spectra of the cavity made of effective hyperbolic medium are appended as symbols. (d) Spectra of maximum electric field enhancement at the PA point, at the BIC point, and without the mirror. Amplitude distributions of electric and magnetic fields at the absorption peak at the PA point. (d) shares the same legends as (c).
To get a deep understanding of the BIC and the PA points, in Fig. 3(a) we show the calculated total damping rate (black solid line), radiative damping rate (blue dashed line), and nonradiative damping rate (red dashed–dotted line) of the structure as a function of (see Appendix B). Clearly, is nearly independent on as it is mainly determined by the Ohmic loss of metals in the structure. In contrast, is strongly affected by and vanishes at , i.e., at the BIC point. As a consequence, the total damping rate () of the structure declines to at the BIC point as marked by the red arrow. Meanwhile, the PA point (see the blue arrow) corresponds to the position where is nearest to , implying the condition of critical coupling is almost satisfied. Based on the temporal coupled mode theory, the absorption of the structure can be obtained by Eq. (3) [41,49]:
The condition of critical coupling refers to where the absorption reaches 100% at . As shown in Fig. 3(b), the calculated absorption spectrum based on Eq. (3) agrees well with the numerical result. Note that although the condition of critical coupling is not perfectly met according to the results shown in Fig. 3(a), the absorption can still surpass 0.99 near the PA point since is very close to when is in the range of 270 to 350 nm.
Figure 3.Damping rates and PA realized due to critical coupling. (a) Total damping rate , radiative damping rate , and nonradiative damping rate as a function of . (b) Comparison between the absorption spectra obtained by Eq. (3) and numerical calculations.
Next, we investigate how to modulate optical responses of the structure by geometries and material compositions. Figures 4(a) and 4(b) show the evolution of absorption spectra as a function of for the structure with and , respectively. Shrinking (expanding) IMCs in the and directions results in resonance of cavity mode (1, 1, 1) at shorter (longer) wavelength as can be seen from the shift of absorption bands. At the same time, the BIC points also appear at different because the propagating constant () between two coupled modes changes due to different resonance frequency. In addition, the structure with shows the narrowest absorption band compared to those of [Fig. 2(b)] and [Fig. 4(b)], indicating a high factor. The reason for the increased factor may come from two aspects. First, volume of metals is reduced in smaller IMCs, resulting in less nonradiative damping; second, the radiative factor () of IMCs is inversely proportional to the fourth power of the characteristic length , i.e., [21], where and is the volume of the cavity. To study the structure with IMCs of different height , we plot the absorption contour maps of the structure with 6 () and 10 () Ag–Si pairs in Fig. 4(c) and Fig. 4(d), respectively. It shows that the absorption band of the structure with thinner (thicker) IMCs locates at the longer (shorter) wavelength. This resonance shift is apparently opposite to the case for cavities made of normal materials, further confirming mirror coupled IMCs still bear the nature of HMMs. The anomalous resonance shift is consistent with the result shown in Fig. 1(b) that both can be understood by analyzing the unique IFSs of HMMs (see Appendix C). Similar to result of Fig. 4(a), smaller cavities have a narrower absorption band. However, one should keep in mind that the number of Ag–Si pairs cannot be too small, otherwise the Ag–Si multilayers will deviate from the effective HMM. Another parameter we want to discuss is the filling ratio () of Ag because it is the only degree of freedom to tune the effective permittivity tensor of Ag–Si multilayer HMMs (see Appendix A). Figures 4(e) and 4(f) are the plots of absorptions for the structure with and , respectively, which show absorption bands at different wavelengths. This resonance tuning property is readily understood by the variation of IFSs of HMMs with different permittivity tensors. Note that there is a limited range of (about 0.2 to 0.8) for the Ag–Si multilayers that can be treated as a type-II HMM in the wavelength range from 1000 to 1600 nm. Out of this range, the Ag–Si multilayers will degenerate to either effective dielectrics () or effective metals () (see Appendix A). Overall, results in Fig. 4 show flexible tuning of the optical responses of mirror coupled IMCs while BICs are robust for different parameters. However, one may find that not all the structures in Fig. 4 present features of PA in the considered space of parameters (see the upper limits of color bars). Interestingly, it seems that PA is more likely to be realized in structures with larger volume of metals as in Figs. 4(b), 4(d), and 4(f). Moreover, results in Fig. 4 indicate that it is possible to obtain PA with perfectly matched and by adjusting the geometry and material compositions of the structure. For example, the maximum absorption of the structure with nm shown in Fig. 4(b) is larger than 0.9999 as the calculated relative difference is less than 5%.
Figure 4.Absorption maps as a function of wavelength and for mirror coupled IMCs with different parameters. (a) , (b) , (c) 6 Ag–Si pairs, (d) 10 Ag–Si pairs, (e) , and (f) . Other parameters are the same as those in Fig. 2.
After the analysis of the BIC and PA realized in mode (1, 1, 1), we investigate more about the mirror coupled IMCs by surveying the mode characteristics of three higher-order modes that are mode (1, 1, 2), mode (1, 1, 3), and mode (1, 1, 4). In Fig. 5(a), we show the absorption and reflection spectra of the structure under the excitation of a plane wave in the wavelength range from 1400 to 2450 nm. It is seen that the absorption (reflection) spectrum shows three peaks (dips) of which the resonance wavelengths are in accordance with those of mode (1, 1, 2), mode (1, 1, 3), and mode (1, 1, 4) shown in Fig. 1(b) in turn. However, it is noted that all the absorption peaks are extremely tiny (smaller than 0.02) while the overall reflection is larger than 0.98, indicating that the excitation of those higher-order modes by a plane wave is quite weak compared to that of mode (1, 1, 1), as shown in Fig. 2(c). This observation can be construed by the fact that these higher-order modes are actually “dark modes” to a far-field source such as a plane wave. From the distributions of shown in the insets of Fig. 1(b), we can regard these higher-order modes as resonances with multiple magnetic dipoles in opposite phases, leading to nearly zero net dipole moment. Therefore, it is not possible to realize perfect absorption by these higher-order modes. However, we stress that these “dark modes” can be efficiently excited by a near-field source (e.g., a dipole), as shown in Fig. 1(b). The resonance wavelengths and factors of these modes as functions of are further calculated and shown in Fig. 5(b). As can be seen, both the resonance wavelengths and factors of these modes are inert to and no sign of BIC can be identified. To present a more detailed analysis, in Fig. 5(c) we show the evolution of and of these modes with the change of . It is seen that is much larger than (2 orders of magnitude at least) for all these modes, which is quite different from the case of mode (1, 1, 1), as shown in Fig. 3(a). This further verifies that these higher-order modes barely radiate to far fields and their Ohmic loss is quite strong. Interestingly, mode (1, 1, 3) exhibits a hallmark of BIC by noticing that almost vanishes at the dip at . Nevertheless, such BIC is meaningless as dominates the damping, resulting in no significant enhancement of the total factor by this BIC, as can be seen in Fig. 5(b).
Figure 5.Mode characteristics of mode (1, 1, 2), mode (1, 1, 3), and mode (1, 1, 4). (a) Absorption (left axis) and reflection (right axis) spectra of the structure in the wavelength range from 1400 to 2450 nm. The absorption peaks of mode (1, 1, 2), mode (1, 1, 3), and mode (1, 1, 4) are marked by red dot (red solid line), blue square (blue dashed line), and green triangle (green dashed–dotted line), in turn. (b) Resonance wavelengths (lines) and factors (symbols) as a function of . (c) (lines) and (symbols) as a function of . The styles of lines and symbols in (b) and (c) are in accordance with those markers in (a) for different modes.
In the final discussion, we want to give a brief demonstration of the enhanced lighter–matter interactions by combining BICs and IMCs. At the BIC point, the fields of the mode (1, 1, 1) are strongly confined within the cavity and do not contribute to far-field radiation but can leak to the near-field regime. The strong light–matter interaction at nanoscale can be realized in regions within or very close to IMCs. One of the most common effects due to the strong light–matter interactions is the enhancement of spontaneous emission rate of quantum emitters, known as the Purcell effect. Experimental demonstrations of strong light–matter interactions related to the Purcell effect have been realized by spin coating quantum dots on IMC arrays [14,15] or doping laser dye in the dielectric layers of HMMs [50]. Theoretically, the Purcell effect can be investigated by calculating the Purcell factor of the structure. To this end, in Fig. 6(a) we show the calculated spectra of the Purcell factor of the mirror coupled IMC arrays with varying . Here, the calculation is carried out for an electric dipole along the direction located 10 nm away from the center of the top surface of the center IMC in a structure containing arrays. The Purcell factor is obtained by calculating the ratio , where is the radiative power of the dipole close to the structure and is that when the structure is absent. As can be seen, all the spectra of the Purcell factor show peaks with the Purcell factor larger than 80 at about 1200 nm, which is exactly the resonance wavelength of the cavity mode (1, 1, 1). This indicates that the proposed structure is a good platform to realize spontaneous emission-rate enhancement. This can be understood by the fact that the Purcell factor of a nanocavity is actually proportional to [14–16]. In our structure, of the mode (1, 1, 1) at the BIC point is calculated as small as ( is the resonance wavelength of the mode; see Appendix B), which evidently confirms the extremely small mode volume of the IMC due to the large wavenumber in HMMs. As a result, is still as large as although the factor of the IMC ( at the BIC point) cannot compete with that of lossless structures. More importantly, the mirror coupled structure presents an additional degree of freedom to tune the Purcell enhancement as we can see that peak values of the spectra of the Purcell factor are dependent on . To unravel the relation between the Purcell enhancement and , we plot peak values of the Purcell factor as a function of in Fig. 6(b). Note that here Purcell factors are normalized to the peak value of the IMC array without the mirror. It shows that the trend of the Purcell factor evolving as is quite similar to that of factors shown in Fig. 2(b). The maximum Purcell factor appears at about that is slightly deviated from the BIC point . This discrepancy comes from the finite number of arrays in the calculation () as running simulation models of more arrays is out of memory of our computation resources. Notwithstanding, the result in Fig. 6(b) is strong evidence that the Purcell effect of IMCs can be further enhanced by BICs by noticing that the maximum of the normalized Purcell factor can be larger than 1.4. We believe this enhancement could be more significant in systems with enough arrays where wave leaking from structure boundary can be ignored.
Figure 6.Enhancement of Purcell effect by BICs in mirror coupled IMC arrays. (a) Spectra of Purcell factor of the structures for different . (b) Normalized Purcell factor as a function of .
In summary, we have shown that arrays of IMCs coupled to a metal mirror can work under the framework of BICs while keeping the intriguing features of hyperbolic HMMs. The factor of IMCs can be effectively enlarged at the BIC point by completely quenching the radiative loss. Similar to other structures applying normal cavities, PA can also be realized but the resonance shows an anomalous scaling law with respect to the cavity size. Optical responses of the proposed structure can be flexibly tuned not only by the geometry of the cavity but also the filling ratio of metals. The ratio between the mode volume and the factor of IMCs is further increased, leading to a significant enhancement of Purcell factor. The proposed structure can be fabricated in experiments by applying advanced technologies of lift-up and lithography such as electron-beam evaporation, electron-beam or focused ion beam lithography. There have been many experimental studies on both IMCs and mirror coupled resonators demonstrating the good agreement between measured and calculated results, though some deviations may arise due to the defects of fabricated samples [15,22,42]. The calculated results presented in this work contribute solid theoretical cornerstones to future experimental studies. The idea that combining IMCs and BICs is not limited to the structure studied in this work and can be extended to other systems applying different types of IMCs, for example, nanowire arrays, and different types of BICs, for example, symmetry-protected BICs. In addition, there have been several strategies to overcome Ohmic loss of metals in optical nanocavities including gain compensation and low temperature environment [51–53]. We believe our results promote the applications of IMCs in nonlinear optics, light-harvesting devices, spontaneous emission engineering, strong coupling systems, and so on.
APPENDIX A: MAXWELL–GARNETT THEORY
HMMs made of stacked metal–dielectric layers can be considered as a homogeneous effective medium with a uniaxial permittivity tensor. If metal–dielectric layers are stacked in the direction, then the principal components of the permittivity tensor can be obtained by the Maxwell–Garnett theory [18–20]: where and are the permittivity of metal and dielectric, respectively. HMMs can be categorized to type-I and type-II that correspond to , and , , respectively. Based on Eq. (A1), the optical phase diagram of the effective medium is shown in Fig. 7 from which we can see that the stacked Ag–Si multilayers can be treated as type-II HMMs as long as in the wavelength range of 1000 to 1600 nm. Strictly speaking, Eq. (A1) is accurate only when the metal–dielectric pair is infinitely thin, i.e., . Although there have been more precise equations that incorporate the corrections related to [54,55], Eq. (A1) can be valid as long as is small enough to ensure the metal–dielectric multilayers can be regarded as a homogenous effective medium. In addition, a finitely thick metal–dielectric pair will put an upper limit to the wavenumber of HMMs given by which is much larger than the corresponding wavenumber in vacuum [14].
Figure 7.Optical phase diagram of the effective medium made of stacked Ag–Si multilayers.
Numerical results of absorption spectra, radiation power, and Purcell factors of electric dipoles were calculated by using the finite-difference time-domain method. In all the simulations, the global mesh accuracy was set as 8 per wavelength and mesh sizes of regions containing IMCs were set as 1 nm to ensure the accuracy of results. For the calculation of radiative power and Purcell factors, perfectly matched layers (PMLs) were applied in the , , and directions to avoid unphysical reflections from the simulation boundaries. For the calculation of absorption (reflection) spectra under the excitation of a normally incident plane wave, a single unit cell with periodic boundary conditions in the and directions, and PMLs in the direction were applied. Eigenvalues and factors were calculated by using an eigenfrequency solver based on the finite element method. Except for PMLs in the direction, Floquet periodic conditions were used in the and directions with , where () is the () component of -vector for Floquet periodicity. Meshes were refined until eigenvalues and factors reached convergence.
To calculate and , the imaginary part of the permittivity of Ag was set as zero in the eigenfrequency solver. Then, and can be obtained based on and , respectively. The mode volume was calculated based on the following equations [22]: where is the local electromagnetic energy density at position , and are the local permittivity and permeability, respectively, and the integration is executed over the entire space. and are the local electric and magnetic fields, respectively, calculated by the eigenfrequency solver.
APPENDIX C: IFSS OF HMMS AND ANOMALOUS SCALING LAW OF IMCS
In a uniaxial medium, the equation of IFS for the TM-polarized wave can be expressed as where is the magnitude of wave vector in vacuum, and is the component of the wave vector in the medium. Based on Eq. (C1), Fig. 8 shows the cross-section view of the IFSs of Ag–Si HMMs () and a normal material (Si, ) on the plane for a shorter (1000 nm) and a longer wavelength (1400 nm). As can be seen, the IFSs of HMMs exhibit hyperbolic shape which is totally different from that of a normal material that is a closed sphere. More importantly, the IFS of HMMs at a longer wavelength (red solid line) is flatter than that of a shorter wavelength (blue solid line). As a result, a larger (smaller) resides at the IFS of a longer (shorter) wavelength for a fixed in-plane wave vector as marked by the red (blue) upward-triangle. This is opposite to the case of a normal material, for example, Si, as shown by the dashed circles and boxes.
Figure 8.Cross-section view of the IFSs of Ag–Si HMMs () and Si on the plane for a short and a long wavelength. is the magnitude of a reference wave vector which is set as . The vertical dashed lines are guide for fixed .
A cavity mode of order (, , ) in cuboid IMCs is formed when the round-trip phases of optical waves propagating along , , and are integer multiples of , i.e.,
Here is the cavity length in the direction, and represents the phase shift in the direction caused by the reflection at cavity–air interfaces. For cavity modes of different orders in an IMC with fixed size, such as those modes labeled in Fig. 1(b), the mode orders in the and directions are , which means and of optical waves are fixed for these modes. Meanwhile, has to increase for a mode of higher order in the direction, i.e., a larger based on Eq. (C2). Similar discussion can be applied for cavity modes of the same orders but with different cavity size in the direction compared to the case in Figs. 4(c) and 4(d). A thinner cavity (smaller ) with a smaller number of Ag–Si pairs results in larger . Then the anomalous scaling law of resonance wavelength of cavity modes in IMCs can be comprehended according to the IFSs shown in Fig. 8 as larger at the same and locates on the IFS of longer wavelength.
Qiang Zhang, Peixiang Li, Zhiyuan Gu, Shaoding Liu, Zejun Duan, "Indefinite metacavities coupled to a mirror: bound states in the continuum with anomalous resonance scaling," Photonics Res. 12, 598 (2024)
 AI Video Guide
  AI Picture Guide
 AI One Sentence