Author Affiliations
1School of Electrical Engineering and Information, Southwest Petroleum University, Chengdu , Sichuan 610500, China2School of Mechatronic Engineering, Southwest Petroleum University, Chengdu , Sichuan 610500, China3Northwest Sichuan Gas Field, Petro China Southwest Oil & Gasfield Company, Mianyang , Sichuan 621700, Chinashow less
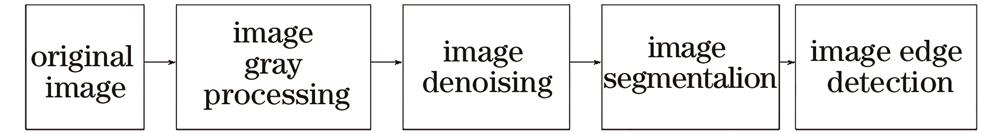
Fig. 1. Image preprocessing process
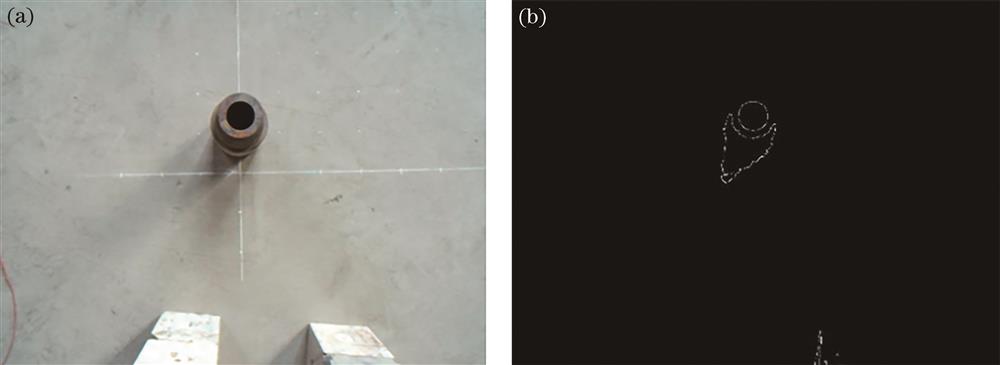
Fig. 2. Image effect of preprocessing. (a) Original image; (b) preprocessed image
Fig. 3. Hough circle transform cumulative parameter space
Fig. 4. Three-dimensional cumulative parameter space
Fig. 5. Circular object detection process of random Hough transform
Fig. 6. Circular targets detected by two Hough transform methods. (a) Original image; (b) circle detection by traditional Hough transform; (c) circle detection of random Hough transform
Fig. 7. Calculation time of two Hough transform methods for detecting circular object
Fig. 8. Schematic of binocular imaging
Fig. 9. Imaging model of parallel binocular vision
Fig. 10. Position relationship between binocular camera and calibration plate
Fig. 11. Images of normal brightness
Fig. 12. Simulated images with insufficient illumination
Fig. 13. X-axis error distribution of central coordinate points of circular object
Fig. 14. Y-axis error distribution of central coordinate points of circular object
Fig. 15. Z-axis error distribution of central coordinate points of circular object
| Parameter | Traditional Hough transform | Random Hough transform |
|---|
| u | 633 | 634 | | v | 304 | 304 | | r | 37 | 37 |
|
Table 1. Comparison of parameters of circular object parameters obtained by two methods
| Parameter | Value |
|---|
| Camera resolution | 1280×960 | | Sensor size /inch | 1/3 | | Pixel size /(μm×μm) | 3.75×3.75 | | Frame rate /(frame·s-1) | 60 |
|
Table 2. Parameters of binocular camera
| No. | Actual coordinates /cm | Calculated coordinates (normal brightness) /cm | Calculated coordinates (normal brightness image with noise) /cm | Calculated coordinates (insufficient brightness) /cm | Calculated coordinates (insufficient brightness image with noise) /cm |
|---|
| X,Y,Z | X,Y,Z | X,Y,Z | X,Y,Z | X,Y,Z |
|---|
| 1 | 0,-11.3,62.7 | 0.22,-10.97,63.08 | 0.15 ,-10.86,62.83 | 0.15,-11,63.33 | 0.22,-11.04,63.08 | | 2 | 20.8,-21.5,62.7 | 20.72,-21.46,63.08 | 20.64,-21.44,62.83 | 20.64,-21.4,62.83 | 20.64,-21.37,62.83 | | 3 | -10.4,-21.5,69.2 | -10.62,-21.33,68.91 | -10.87,-21.45,69.53 | -10.7,-21.3,68.91 | -10.82 ,-21.43,69.22 | | 4 | 20.6,-1.4,69.2 | 21.07,-1.36,69.22 | 20.98,-1.36,68.91 | 21.05,-1.36,68.91 | 21.09,-1.75,69.53 | | 5 | 0,-11.2,47 | 0.32,-11.32,46.84 | 0.27,-11.31,46.98 | 0.16,-11.3,46.98 | 0.22,-11.32,47.26 | | 6 | 21.2,-1.4,47 | 21.38,-1.66,47.41 | 21.38,-1.71,47.41 | 21.32,-1.65,47.26 | 21.41,-1.67,47.69 | | 7 | 0,9.1,47 | -0.25,8.87,47.12 | -0.3,8.92,47.12 | -0.25,8.89,46.98 | -0.35,8.97,47.12 | | 8 | 10,-11.3,47 | 10.01,-10.98,47.12 | 9.96,-10.82,47.12 | 9.99,-11,47.26 | 9.98,-10.84,46.98 | | 9 | 19.8,1.5,53.1 | 19.64,1.34,53.39 | 19.65,1.35,53.57 | 19.71,1.41,53.57 | 19.72,1.29,53.76 | | 10 | 21,1.4,37.8 | 21.28,1,37.97 | 21.19,0.95,37.88 | 21.24,0.96,37.97 | 21.24,0.96,37.97 | | 11 | 20,1.5,83.7 | 20.16,1.56,83.66 | 20.26,1.56,84.11 | 20.26,1.47,84.11 | 20.28,1.39,84.56 |
|
Table 3. Comparison of calculated results and actual results
| No. | Actual distance /cm | Normal brightness image | Normal brightness image with noise | Insufficient brightness image | Insufficient brightness image with noise |
|---|
| Calculated distance /cm | Relative error /% | Calculated distance /cm | Relative error /% | Calculated distance /cm | Relative error /% | Calculated distance /cm | Relative error /% |
|---|
| 1 | 63.71 | 64.03 | 0.50 | 63.76 | 0.08 | 64.28 | 0.89 | 64.04 | 0.52 | | 2 | 69.47 | 69.78 | 0.45 | 69.52 | 0.07 | 69.51 | 0.06 | 69.50 | 0.04 | | 3 | 73.21 | 72.91 | 0.41 | 73.57 | 0.49 | 72.92 | 0.40 | 73.26 | 0.07 | | 4 | 72.21 | 72.37 | 0.22 | 72.05 | 0.22% | 72.07 | 0.19 | 72.68 | 0.65 | | 5 | 48.32 | 48.19 | 0.27 | 48.31 | 0.02 | 48.33 | 0.02 | 48.60 | 0.58 | | 6 | 51.58 | 52.03 | 0.87 | 52.04 | 0.89 | 51.87 | 0.56 | 52.30 | 1.40 | | 7 | 47.87 | 47.95 | 0.17 | 47.96 | 0.19 | 47.81 | 0.13 | 47.97 | 0.21 | | 8 | 49.36 | 49.41 | 0.10 | 49.35 | 0.02 | 49.54 | 0.36 | 49.24 | 0.24 | | 9 | 56.69 | 56.90 | 0.37 | 57.08 | 0.69 | 57.10 | 0.72 | 57.28 | 1.04 | | 10 | 43.26 | 43.538 | 0.64 | 43.41 | 0.35 | 43.52 | 0.60 | 43.52 | 0.60 | | 11 | 86.07 | 86.06 | 0.01 | 86.53 | 0.53 | 86.53 | 0.53 | 86.97 | 1.05 |
|
Table 4. Comparison between actual distance and calculated distance of circular object center