• Photonics Research
  • Vol. 10, Issue 10, 2410 (2022)
Jiurun Chen1、2、3, Aiye Wang1、2、3, An Pan1、2、*, Guoan Zheng4, Caiwen Ma1、2、5, and Baoli Yao1、2
Author Affiliations
  • 1Xi’an Institute of Optics and Precision Mechanics, Chinese Academy of Sciences, Xi’an 710119, China
  • 2University of Chinese Academy of Sciences, Beijing 100049, China
  • 3CAS Key Laboratory of Space Precision Measurement Technology, Xi’an 710119, China
  • 4Department of Biomedical Engineering, University of Connecticut, Storrs, Connecticut 06269, USA
  • 5e-mail:
  • show less
    DOI: 10.1364/PRJ.473038 Cite this Article Set citation alerts
    Jiurun Chen, Aiye Wang, An Pan, Guoan Zheng, Caiwen Ma, Baoli Yao. Rapid full-color Fourier ptychographic microscopy via spatially filtered color transfer[J]. Photonics Research, 2022, 10(10): 2410 Copy Citation Text show less
    Diagram of LBP principles. (a) Encoding process of original LBP: (a1) grayscale image; (a2) gray value of a 3×3 neighborhood in the grayscale image; (a3) binary thresholding result of the neighboring pixels; (a4) corresponding weight of each pixel position; (a5) LBP value of the central pixel; (a6) LBP feature mapping image of the grayscale image. (b) Circular neighborhood corresponding to different values of P and R. (c) ULBP patterns including two 0/1 transitions and two special cases in LBP.
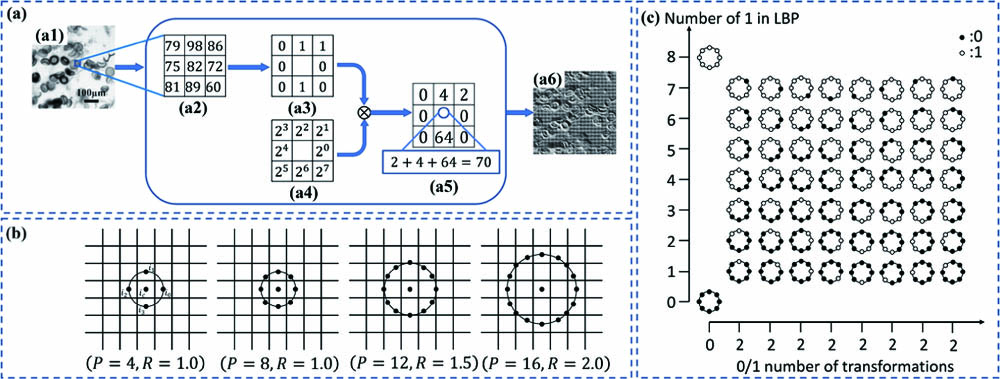
    Fig. 1. Diagram of LBP principles. (a) Encoding process of original LBP: (a1) grayscale image; (a2) gray value of a 3×3 neighborhood in the grayscale image; (a3) binary thresholding result of the neighboring pixels; (a4) corresponding weight of each pixel position; (a5) LBP value of the central pixel; (a6) LBP feature mapping image of the grayscale image. (b) Circular neighborhood corresponding to different values of P and R. (c) ULBP patterns including two 0/1 transitions and two special cases in LBP.
    Schematic diagram of CFFPM method. (a), (b) LR full-color donor and HR grayscale acceptor image. (a1)–(a4) ULBP feature mapping; L, a, and b channel images of a typical tile in the donor image. (b1), (b2) ULBP feature mapping and L channel image of the corresponding tile in the acceptor image; (b3), (b4) color transfer results of a and b channels for the tile calculated by the trilateral filtering algorithm. (c) Reconstruction result of the typical tile and whole image with CFFPM method. (d) Replacing green channel of whole image with CFFPM method. Dashed and solid boxes in (a)–(d) represent the block processing strategy. First, obtain the gray similarity factor Gs, spatial proximity factor Gr, and feature similarity factor Gt contained in the color transfer probability function GσCT. Second, find the point in the color image with the highest color similarity with the grayscale image. Finally, transfer colors to grayscale images through Lab space. Each iteration replaces the green channel of the CFFPM reconstructed image with the HR grayscale receptor image; convert it to gray scale and continue to the next iteration. See the video of Visualization 1 for detailed process.
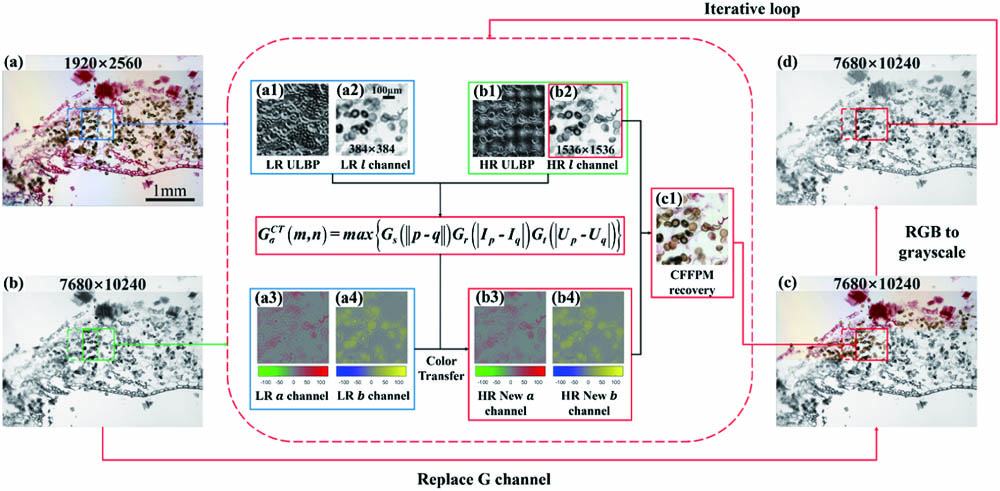
    Fig. 2. Schematic diagram of CFFPM method. (a), (b) LR full-color donor and HR grayscale acceptor image. (a1)–(a4) ULBP feature mapping; L, a, and b channel images of a typical tile in the donor image. (b1), (b2) ULBP feature mapping and L channel image of the corresponding tile in the acceptor image; (b3), (b4) color transfer results of a and b channels for the tile calculated by the trilateral filtering algorithm. (c) Reconstruction result of the typical tile and whole image with CFFPM method. (d) Replacing green channel of whole image with CFFPM method. Dashed and solid boxes in (a)–(d) represent the block processing strategy. First, obtain the gray similarity factor Gs, spatial proximity factor Gr, and feature similarity factor Gt contained in the color transfer probability function GσCT. Second, find the point in the color image with the highest color similarity with the grayscale image. Finally, transfer colors to grayscale images through Lab space. Each iteration replaces the green channel of the CFFPM reconstructed image with the HR grayscale receptor image; convert it to gray scale and continue to the next iteration. See the video of Visualization 1 for detailed process.
    Detailed settings of CFFPM parameters. (a1) LR color image and magnified image for the part of interest; (a2) CFFPM reconstructed image with feature similarity factor; (a3) CFFPM reconstructed image with gray similarity factor and gray similarity factor; (a4) CFFPM reconstructed image. (b1) LR grayscale image within the filter range; (b2) LBP feature mapping of LR color image within the filter range. (c1) HR grayscale image within the filter range; (c2) LBP feature mapping of HR grayscale image within the filter range. (d1)–(d4) Visualization diagrams of Gs, Gr, Gt, and GσCT; (d5) typical spatial proximity factor.
    Fig. 3. Detailed settings of CFFPM parameters. (a1) LR color image and magnified image for the part of interest; (a2) CFFPM reconstructed image with feature similarity factor; (a3) CFFPM reconstructed image with gray similarity factor and gray similarity factor; (a4) CFFPM reconstructed image. (b1) LR grayscale image within the filter range; (b2) LBP feature mapping of LR color image within the filter range. (c1) HR grayscale image within the filter range; (c2) LBP feature mapping of HR grayscale image within the filter range. (d1)–(d4) Visualization diagrams of Gs, Gr, Gt, and GσCT; (d5) typical spatial proximity factor.
    Experimental results of stained resting sporangia. (a) LR color image with the entire FOV of a 4×/0.1 NA objective; (b) FPM grayscale reconstructed image under green channel (515.0 nm); (c) ground truth with the entire FOV of a 10×/0.3 NA objective. (a1) Magnified image of the specific area in (a); (b1) magnified image of the specific area in (b); (c1) magnified image of the specific area in (c). (d) Staining image via conventional R/G/B method; (e) staining image via multiplexing method; (f) staining image via CFPM; (g) staining image via CFFPM. RMSE, IHCS, and runtime values are marked below the corresponding image.
    Fig. 4. Experimental results of stained resting sporangia. (a) LR color image with the entire FOV of a 4×/0.1  NA objective; (b) FPM grayscale reconstructed image under green channel (515.0 nm); (c) ground truth with the entire FOV of a 10×/0.3  NA objective. (a1) Magnified image of the specific area in (a); (b1) magnified image of the specific area in (b); (c1) magnified image of the specific area in (c). (d) Staining image via conventional R/G/B method; (e) staining image via multiplexing method; (f) staining image via CFPM; (g) staining image via CFFPM. RMSE, IHCS, and runtime values are marked below the corresponding image.
    Experimental results of stained emphysema. (a) LR color image with the entire FOV of a 4×/0.1 NA objective; (b) FPM grayscale reconstructed image under green channel (515.0 nm); (c) ground truth with the entire FOV of a 10×/0.3 NA objective. (a1) Magnified image of the specific area in (a); (b1) magnified image of the specific area in (b); (c1) magnified image of the specific area in (c). (d) Staining image via conventional R/G/B method; (e) staining image via multiplexing method; (f) staining image via CFPM; (g) staining image via CFFPM. RMSE, IHCS, and runtime values are marked below the corresponding image.
    Fig. 5. Experimental results of stained emphysema. (a) LR color image with the entire FOV of a 4×/0.1  NA objective; (b) FPM grayscale reconstructed image under green channel (515.0 nm); (c) ground truth with the entire FOV of a 10×/0.3  NA objective. (a1) Magnified image of the specific area in (a); (b1) magnified image of the specific area in (b); (c1) magnified image of the specific area in (c). (d) Staining image via conventional R/G/B method; (e) staining image via multiplexing method; (f) staining image via CFPM; (g) staining image via CFFPM. RMSE, IHCS, and runtime values are marked below the corresponding image.
    Curves of RMSE value with the number of iterations in CFFPM method for (a) stained resting sporangia sample in Fig. 4 and (b) stained emphysema sample in Fig. 5. The dotted lines represent the RMSE value of the conventional R/G/B sequential method.
    Fig. 6. Curves of RMSE value with the number of iterations in CFFPM method for (a) stained resting sporangia sample in Fig. 4 and (b) stained emphysema sample in Fig. 5. The dotted lines represent the RMSE value of the conventional R/G/B sequential method.
    Statistical comparison results of four colorization methods. (a) RMSE curves of three methods for 26 tested samples at a statistical level. (b1), (c1) Respective ground truth of the No. 3 and No. 14 stained biological samples. (b2), (c2); (b3), (c3); (b4), (c4); (b5), (c5) Respective reconstructed results obtained by conventional R/G/B method, multiplexing method, CFPM, and CFFPM. RMSE values are marked below the corresponding results.
    Fig. 7. Statistical comparison results of four colorization methods. (a) RMSE curves of three methods for 26 tested samples at a statistical level. (b1), (c1) Respective ground truth of the No. 3 and No. 14 stained biological samples. (b2), (c2); (b3), (c3); (b4), (c4); (b5), (c5) Respective reconstructed results obtained by conventional R/G/B method, multiplexing method, CFPM, and CFFPM. RMSE values are marked below the corresponding results.
    Block size and overlapping rate. (a1) Effects of filter size and sliding step size on stained resting sporangia; (a2) effects of σr/σs and σt/σs on stained resting sporangia; (b1) effects of filter size and sliding step size on stained emphysema; (b2) effects of σr/σs and σt/σs on stained emphysema.
    Fig. 8. Block size and overlapping rate. (a1) Effects of filter size and sliding step size on stained resting sporangia; (a2) effects of σr/σs and σt/σs on stained resting sporangia; (b1) effects of filter size and sliding step size on stained emphysema; (b2) effects of σr/σs and σt/σs on stained emphysema.
    Algorithm: CFFPM
    Input: LR color image Ic, HR grayscale image Ig, FPM magnification Mag
    Output: new HR color image Icnew
    Obtain ULBP feature mapping of LR color image Uc by Eq. (3);
    Obtain ULBP feature mapping of HR grayscale image Ug by Eq. (3);
    for each block
       Obtain the coordinate variables in the gray similarity factor Gs by u=i/Mag, v=j/Mag;
       for point q in block
         Obtain the gray similarity factor Gs by Eq. (8);
         Obtain the spatial proximity factor Gr by Eq. (9);
         Obtain the feature similarity factor Gt by Eq. (10);
         Obtain the point (m, n) with the highest color similarity in the color image by Eq. (7);
         Transfer the color of point (m, n) to point q in the grayscale image through Lab space;
        end
        Replace green channel of Icnew with Ig.
       end while the relative RMSE of green channel is less than 0.1
    Table 1. Procedures of CFFPM
    MethodsAcquisitionReconstructionColor Transfer
    CPUGPUCPUGPU
    R/G/B22.5  min3  h9  min//
    Multiplexing9  min3  h///
    CFPM7.5  min1  h3  min3  h1  min
    CFFPM7.5  min1  h3  min3  min<1  s
    Table 2. Time Spent in Colorization Methods
    Jiurun Chen, Aiye Wang, An Pan, Guoan Zheng, Caiwen Ma, Baoli Yao. Rapid full-color Fourier ptychographic microscopy via spatially filtered color transfer[J]. Photonics Research, 2022, 10(10): 2410
    Download Citation