Full-color imaging is of critical importance in digital pathology for analyzing labeled tissue sections. In our previous cover story [Sci. China: Phys., Mech. Astron.64, 114211 (2021)SCPMCL1674-734810.1007/s11433-021-1730-x], a color transfer approach was implemented on Fourier ptychographic microscopy (FPM) for achieving high-throughput full-color whole slide imaging without mechanical scanning. The approach was able to reduce both acquisition and reconstruction time of FPM by three-fold with negligible trade-off on color accuracy. However, the method cannot properly stain samples with two or more dyes due to the lack of spatial constraints in the color transfer process. It also requires a high computation cost in histogram matching of individual patches. Here we report a modified full-color imaging algorithm for FPM, termed color-transfer filtering FPM (CFFPM). In CFFPM, we replace the original histogram matching process with a combination of block processing and trilateral spatial filtering. The former step reduces the search of the solution space for colorization, and the latter introduces spatial constraints that match the low-resolution measurement. We further adopt an iterative process to refine the results. We show that this method can perform accurate and fast color transfer for various specimens, including those with multiple stains. The statistical results of 26 samples show that the average root mean square error is only 1.26% higher than that of the red-green-blue sequential acquisition method. For some cases, CFFPM outperforms the sequential method because of the coherent artifacts introduced by dust particles. The reported CFFPM strategy provides a turnkey solution for digital pathology via computational optical imaging.
1. INTRODUCTION
Analyzing pathology slides using an optical microscope remains as gold standard in diagnosing a large number of diseases including almost all types of cancers. Using an eyepiece to examine tissue sections, however, is labor intensive and can be easily disrupted when switching to a different objective lens or a different slide. It is also highly subjective, as different pathologists may arrive at different conclusions or the same pathologist may give different conclusions at different time points. Due to the ever-improving computational power and rapid development of digital imaging devices, pathology has entered the digital age in the past years. Modern digital pathology adopts whole slide imaging (WSI) systems to obtain high-resolution (HR), large field of view (FOV) images [1]. However, challenges remain to be addressed. First, the conventional WSI system requires rapid mechanical scanning for expanding the FOV. Precise mechanical control and pulsed illumination are often needed to shorten the acquisition time. The resultant systems are expensive and of high maintenance. Second, the use of a high numerical aperture (NA) objective lens implies a small depth of field (DOF) for the imaging process. For thick specimens such as cytology samples, axial scanning may be needed, adding another degree of complexity of data handling to the system.
Fourier ptychographic microscopy (FPM) [2–5] is an enabling computational imaging method by implementing the ptychographic scanning concept [6,7] in Fourier space. Different from conventional techniques that have a trade-off between resolution and imaging FOV, FPM achieves the best of both worlds by integrating the innovations of synthetic aperture imaging [8,9] and optical phase retrieval [10,11]. In a typical implementation, FPM employs a programmable LED array for illuminating the sample from different incident angles. A low-NA objective lens is used to acquire the corresponding images. In the reconstruction process, the captured low-resolution (LR) intensity images are synthesized in Fourier space to expand the available bandwidth. The synthesized information is then transformed back to the spatial domain to generate an HR object image containing both intensity and phase properties.
By using a low-NA objective lens, FPM retains the large FOV set by the lens. With the aperture synthesizing process, it can generate HR images. As such, it achieves both HR and large FOV at the same time. Compared with conventional scanning WSI systems, no mechanical scanning is needed in FPM. The use of a low-NA objective also has the benefit of both a long DOF and a long working distance, thereby addressing the above-mentioned challenges of regular WSI systems. Nowadays, FPM has achieved successful applications in different fields, including WSI systems [12,13], circulating tumor cell analysis [14], high-throughput drug screening [15,16], label-free (single shot) high-throughput imaging in situ [17–19], retina imaging [20], 3D imaging [21–23], wafer detection [24], HR optical field imaging [25], optical cryptosystem [26], and remote sensing [9,27], among others. It has evolved from a simple microscope tool to a general technique for different research communities [5].
Sign up for Photonics Research TOC. Get the latest issue of Photonics Research delivered right to you!Sign up now
To adopt FPM for digital pathology, it is important to incorporate color information for analyzing labeled tissue sections. One straightforward strategy is to sequentially illuminate the specimen with red, green, and blue (R/G/B) light in FPM. The recovered R/G/B images are then combined to form a color image. The high-throughput feature of FPM seems not so obvious when we attempt to realize colorful FPM with the R/G/B sequential illuminations compared with conventional incoherent imaging with a chromatic camera, since the throughput will be reduced by three-fold. Other multiplexing strategies can also be implemented to improve data acquisition efficiency, including the use of an R/G/B Bayer filter and wavelength multiplexing [28–31]. However, these multiplexing strategies suffer from the intrinsic trade-off between data acquisition efficiency and color precision. A deep learning approach is an alternative for recovering color information in FPM [32,33]. However, it suffers from data overfitting, difficulty in generalization, the need of large training datasets, and the lack of physical interpretability [32–35]. In addition, there is a method called wavelet-FPM [36], which fuses the LR color image with a monochrome image reconstructed by FPM and restores the HR color image. It not only can get HR color images quickly, but also effectively suppress the dark field noise in FPM reconstruction.
In our previous work, we reported a color transfer algorithm for FPM, termed color-transfer FPM (CFPM) [37]. Our work aims to maintain the high-throughput advantage of FPM via color transfer. Color precision should be the most important factor in full-color FPM imaging, especially for clinical applications; thus, the prime objective is not to simply speed up imaging; otherwise, we could adopt more efficient imaging schemes such as direct imaging by color cameras or deep learning technologies. It is proved that our CFPM method achieves comparable color precision with the conventional R/G/B method, and simultaneously reduces both acquisition and reconstruction time of FPM to 1/3. This method properly testifies that FPM can still preserve its high throughput when color imaging is implemented. However, the method cannot properly stain samples with two or more dyes due to the lack of spatial constraints in the color transfer process. It also requires a high computation cost in histogram matching of individual patches.
In this paper, we report a modified full-color imaging algorithm for FPM, termed color-transfer filtering FPM (CFFPM). In CFFPM, we replace the original histogram matching process by a combination of block processing and trilateral spatial filtering. The former step reduces the search of the solution space for colorization, and the latter introduces spatial constraints that match the LR measurement. We further adopt an iterative process to refine the results for fast convergence. We show that the reported CFFPM algorithm can perform accurate and fast color transfer for various specimens, including those with multiple stains. Compared with CFPM, it also has better performance for samples with a single dye. The statistical results of 26 samples show that the average root mean square error (RMSE) is only 1.26% higher than that of the R/G/B sequential acquisition method. The difference between CFFPM and the ground-truth color image can be hardly detected by human vision. In some cases, it even outperforms the sequential method because of the coherent artifacts introduced by dust particles.
In terms of computational cost, CFFPM can substantially shorten the processing time when compared with CFPM. The reported CFFPM strategy provides a turnkey solution for digital pathology via computational optical imaging. The remainder of the paper is organized as follows. In Section 2, we discuss the basic principles of block processing and spatial filtering for the CFFPM method. The results of the experiments and related descriptions of the experimental setup are presented in Section 3. Finally, we summarize and discuss the results in Section 4.
2. PRINCIPLES AND METHODS
A. Local Binary Patterns and Bilateral Filter
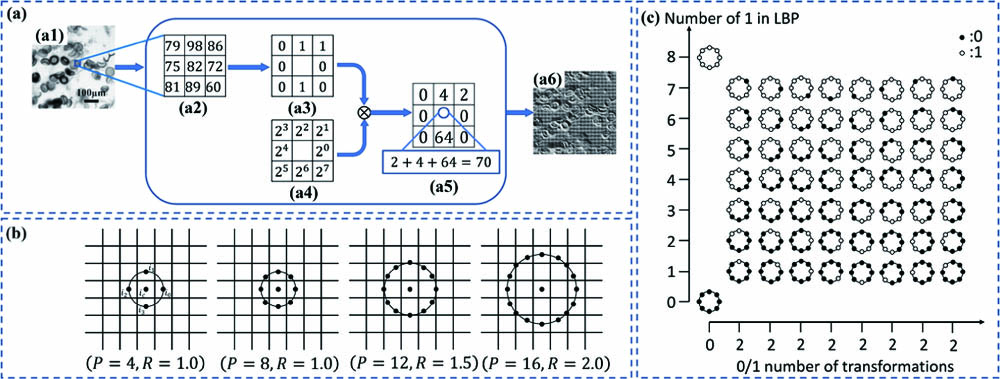
“Local binary patterns” (LBPs) are a popular feature extraction method of grayscale images proposed by Ojala et al. [38]. To be specific, we consider a central pixel and its surrounding rectangular area in Fig. 1(a). The gray value of each pixel in this area is compared with the central pixel and then binarized with the following rule: a pixel value larger than or equal to the central pixel is coded as 1, otherwise 0. The LBP value of the central pixel can be obtained by accumulating the binarized values multiplied by the weight at the corresponding position, which can be described as where (, ) and represent the central pixel and its gray value, respectively, is the total number of pixels in this area except for the central pixel, the gray value of the th pixel is denoted as , and is a symbolic function.
Figure 1.Diagram of LBP principles. (a) Encoding process of original LBP: (a1) grayscale image; (a2) gray value of a neighborhood in the grayscale image; (a3) binary thresholding result of the neighboring pixels; (a4) corresponding weight of each pixel position; (a5) LBP value of the central pixel; (a6) LBP feature mapping image of the grayscale image. (b) Circular neighborhood corresponding to different values of and . (c) ULBP patterns including two 0/1 transitions and two special cases in LBP.
To further enhance the discriminative ability of LBP, Ojala modified the rectangular area into a circular area [39]. As shown in Fig. 1(b), pixels are equally spaced on a circle of radius and form a circularly symmetric neighboring area. If the coordinates of the central pixel are set as (0,0), then the coordinates of the uniformly distributed pixels are given by
The gray values of the neighborhood points that do not accurately fall on the circumference are estimated by bilinear interpolation, namely, . Note that Eq. (1) produces different output values corresponding to the different binary patterns, which can be formed by the pixels in the neighboring area. Therefore, a geometric increase in calculation amount combined with the decrease of recognition rate will arise as the number of sampling points increases.
To address this problem, Ojala observed that certain LBP values represent the most fundamental properties of image textures and appear very frequently in LBP feature extraction, which are termed uniform LBP (ULBP) [39]. We introduce a uniformity measure to define the uniform patterns, which corresponds to the number of binary transitions (bitwise 0/1 changes) and is calculated by
When the patterns are classified with the modified ULBP method, the number of pattern types is reduced from the original to without much loss of information. One typical example is intuitively given in Fig. 1(c), where the number of neighborhood sampling points is eight. A total number of 58 LBP types are listed, and we can see a significant drop compared with the initial number of 256. It turns out that the improvement makes the eigenvectors less dimensional and reduces the effect of high-frequency noise.
“Bilateral filter” (BF) is an improved algorithm based on Gaussian filtering proposed by Tomasi et al. in 1998 [40]. Considering both spatial information and gray information, BF adopts a nonlinear combination of nearby image values to realize noise removal while retaining edge details. In the Lab color space, the operation of BF is tuned to human perception and effectively suppresses the artifacts of colors along edges. The calculation equation of the filtering function is given as follows: where and represent gray values of input and output images at pixel , respectively, denotes the central pixel in the domain pixels set , is the normalization factor, is the gray similarity factor, is the spatial proximity factor, and and are the distance standard deviation and gray standard deviation based on a Gaussian function, respectively.
B. Procedures of CFFPM
Figure 2.Schematic diagram of CFFPM method. (a), (b) LR full-color donor and HR grayscale acceptor image. (a1)–(a4) ULBP feature mapping; , , and channel images of a typical tile in the donor image. (b1), (b2) ULBP feature mapping and channel image of the corresponding tile in the acceptor image; (b3), (b4) color transfer results of and channels for the tile calculated by the trilateral filtering algorithm. (c) Reconstruction result of the typical tile and whole image with CFFPM method. (d) Replacing green channel of whole image with CFFPM method. Dashed and solid boxes in (a)–(d) represent the block processing strategy. First, obtain the gray similarity factor , spatial proximity factor , and feature similarity factor contained in the color transfer probability function . Second, find the point in the color image with the highest color similarity with the grayscale image. Finally, transfer colors to grayscale images through Lab space. Each iteration replaces the green channel of the CFFPM reconstructed image with the HR grayscale receptor image; convert it to gray scale and continue to the next iteration. See the video of Visualization 1 for detailed process.
Step 1 For the large-scale LR color donor image and HR grayscale acceptor image, we calculate their respective ULBP feature mapping, as shown in Figs. 2(a) and 2(b). The image is divided into several small blocks with a certain overlapping rate based on the concept of sliding step size in BF. This strategy facilitates parallel operation to reduce the time required for color transfer (see Appendix A for a discussion of filter size and sliding step size). Assuming the FPM magnification is Mag, the radius value of the grayscale image is set to be Mag times the size of the color image.
Step 2 We introduce spatial information into the Lab color space and perform spatial filtering. The visualization process of spatial filtering in the reported CFFPM is shown in the second dashed box of Fig. 3, where Figs. 3(b1), 3(b2) and 3(c1), 3(c2) describe the acquisition of HR ULBP mapping and channel information according to the determined filtering ranges. On this basis, the trilateral filtering function [Figs. 3(d1)–3(d4)] is further expressed as where Mag is the magnification of FPM, and represents the rounding operation. For point in the input LR color image, and respectively denote its gray value in the channel and its corresponding value of the ULBP feature. and equally follow similar meanings for point in the input HR grayscale image. is the color transfer probability function, which takes the largest value at point (, ). Specifically, for point in the grayscale image, the function is used to find the most similar point (, ) in the color image. In Lab space, we then replace the channel and channel information of point with that of point (, ). The meanings of , , , and are the same as in BF. Additionally, is the feature similarity factor and is the feature standard deviation based on the Gaussian function (see Appendix A for a discussion of the selection of standard deviation).
Figure 3.Detailed settings of CFFPM parameters. (a1) LR color image and magnified image for the part of interest; (a2) CFFPM reconstructed image with feature similarity factor; (a3) CFFPM reconstructed image with gray similarity factor and gray similarity factor; (a4) CFFPM reconstructed image. (b1) LR grayscale image within the filter range; (b2) LBP feature mapping of LR color image within the filter range. (c1) HR grayscale image within the filter range; (c2) LBP feature mapping of HR grayscale image within the filter range. (d1)–(d4) Visualization diagrams of , , , and ; (d5) typical spatial proximity factor.
Figure 4.Experimental results of stained resting sporangia. (a) LR color image with the entire FOV of a objective; (b) FPM grayscale reconstructed image under green channel (515.0 nm); (c) ground truth with the entire FOV of a objective. (a1) Magnified image of the specific area in (a); (b1) magnified image of the specific area in (b); (c1) magnified image of the specific area in (c). (d) Staining image via conventional R/G/B method; (e) staining image via multiplexing method; (f) staining image via CFPM; (g) staining image via CFFPM. RMSE, IHCS, and runtime values are marked below the corresponding image.
We then perform color transfer in Lab space. The Lab color space splits brightness and color texture into different channels, which are independent of each other and conform to the visual perception of human eyes [41]. represents the brightness channel ranging from zero to 100 (pure black to pure white), and respectively represent the red-green and blue-yellow color channels ranging from to 127. To maintain the invariance of the image brightness channel, the Lab color space is better suited to represent the color images considering the strong correlation among the three channels of R/G/B color space. In our method, the conversion from R/G/B color space to Lab color space is realized by the bridge function provided by long, medium, short (LMS) color space [42]. The specific steps of this conversion can be found in a previous work [37]. The inverse conversion from Lab color space to R/G/B color space can be completed with a similar procedure.
We note that the color transfer in CFFPM is not a one-shot operation. We implement an iterative process to refine the results and to achieve the best performance. However, there is a priori information that we know this channel in the R/G/B model. Therefore, for each iteration, after obtaining the full-color image in R/G/B space, we replace the value of a certain channel with that of the initial grayscale acceptor image. The modified full-color image is then transformed into an HR grayscale image, which functions as the new grayscale acceptor image for the next iteration. Since the image collected under different FPM color channels is displayed in the form of gray scale, it already contains parts of the color information of the sample, that is, each channel of R/G/B has information about both the sample and color. However, grayscale and color information are completely separated in Lab space; hence, the value of a certain channel for the final full-color image deviates from the ground truth after mutual conversion between R/G/B and Lab color space. The iterative procedure adopts the initial certain-channel value as a constraint in the grayscale domain, which provides a constant correction for color deviation, while the information of channels and is provided by the LR full-color donor image, imposing a constraint in the color domain. The combined constraints from two aspects advance the iteration towards color transfer results with higher precision, which is very similar to the process of iterative phase retrieval. Note that the transformation between R/G/B and Lab models is also nonlinear. When the RMSE reaches a preset value, the iterative process terminates, and color transfer is completed. This process is similar to conventional transfer learning but based on the physical model and has strong interpretability.
Step 3 According to the size and overlapping ratio of the image after segmentation, several small blocks after color transfer are spliced into a complete HR color image, as shown in Fig. 2(c).
There are two important issues in our proposed method that we need to clarify. First, the BF method is transformed into trilateral filtering by introducing LBP features because it is not enough to determine the similarity of two points only by grayscale information in the process of color transfer. On one hand, it can be known according to the prior information that the LR color image relies on the channel used by FPM while calculating the grayscale similarity factor. On the other hand, two different colors may have the same gray value in R/G/B space. For example, the gray values of color A (, , ) and color B (, , ) are both 63. This type of error may have an obvious impact on color transfer results. As shown in Fig. 3(a1), since FPM imaging uses coherent light illumination, the color image acquired under a low-magnification objective lens produces significant chromatic aberration caused by the ringing effect. Figures 3(a2)–3(a4) compare the color transfer results of CFFPM with and without the introduction of the feature similarity factor. We can see that the distorted colors in the area marked with circles have been effectively suppressed, and the RMSE value has also been gradually reduced.
The design of the spatial proximity factor in CFFPM is different from that in BF. Since FPM restores an HR image whose size is Mag times the original LR image, it is considered that a point (square with side length of one) in the LR image corresponds to a square with side length of Mag in the HR image. Each pixel of the LR image is located exactly at the center of the square in the HR image according to the characteristic of FPM. When Mag is an even number, the point of the LR image coincides with the central point of the square in the HR image. When Mag is an odd number, the point of the LR image is located at the geometric center of the square and each pixel of the HR image is calculated by linear interpolation. When designing the spatial proximity factor, the smooth two-dimensional Gaussian function cannot be calculated simply by substituting the pixel coordinates because the probability value of each point in the square is identical even though the square itself conforms to the two-dimensional Gaussian distribution in space. Figures 3(d2) and 3(d5) show the difference between the spatial proximity factor for FPM and typical spatial proximity factor.
Figure 5.Experimental results of stained emphysema. (a) LR color image with the entire FOV of a objective; (b) FPM grayscale reconstructed image under green channel (515.0 nm); (c) ground truth with the entire FOV of a objective. (a1) Magnified image of the specific area in (a); (b1) magnified image of the specific area in (b); (c1) magnified image of the specific area in (c). (d) Staining image via conventional R/G/B method; (e) staining image via multiplexing method; (f) staining image via CFPM; (g) staining image via CFFPM. RMSE, IHCS, and runtime values are marked below the corresponding image.
Given the above, the CFFPM method overcomes the defect of CFPM that the variance of all pixels in the image needs to be calculated and avoids multi-coloring caused by an over-balanced histogram of the generated HR color image. In addition, Gaussian filtering factors are used in the method to introduce spatial information, which conforms to objective prior knowledge, making the color transfer results more convincing and improving the utilization rate of image information.
3. EXPERIMENTS
A. Experimental Setup and Evaluation Methods
The setup of the FPM platform in our experiments contains a programmable R/G/B LED array (Adafruit, controlled by an Arduino), which is placed 70 mm above the sample. The distance between adjacent LEDs is 4 mm, and only the central LEDs are lighted up sequentially for data acquisition. Tested by the spectrometer of Ocean Optics, the R/G/B LEDs respectively provide illumination wavelengths of 630.1, 515.0, and 462.6 nm. All data are captured by a objective and a 16-bit sCMOS camera (Neo 5.5, Andor, 6.5 μm pixel pitch). To perform high-quality FPM reconstruction, we need to properly consider several important factors such as noise, systematic errors, and vignetting, among others [43–45]. Furthermore, white balance plays a significant role in obtaining correct and accurate color images in our method, which involves the establishment of color space and transformation of different color spaces. Specific procedures are consistent with and can be found in our work in CFPM [37,46].
Two types of evaluation methods are adopted to assess the results of the CFFPM method, including RMSE and image histogram cosine similarity (IHCS). RMSE is given by [46] where and are two virtual images, and denotes the size of images. For color images, the overall RMSE is obtained by adding up the RMSE of each channel. The IHCS method divides the color space of images into 64 areas, corresponding to the 64-dimensional vectors to describe the color histogram, or more explicitly, the basic features of images. The similarity of the two images can then be expressed by the cosine angle between their respective vectors, and we define it as follows [46]: where and are feature vectors of the comparative image histograms. When the two images are the same, the cosine angle is 0°. If the two images have no similar features, the cosine angle is 90°.
B. Experimental Results
Figures 4 and 5 show the CFFPM results of two typical samples stained with different dyes compared with the conventional R/G/B method, multiplexing method, and CFPM. In our method, the filter size and sliding step size are respectively set as 14 and 12, and the fixed ratio of , , is 1:1:1. The LR full-color donor images [Figs. 4(a) and 5(a)] are synthesized from three LR images with normally incident illumination. The HR receptor images [Figs. 4(b) and 5(b)] are reconstructed by the FPM procedure with the illumination of green light (515.0 nm). The ground truth [Figs. 4(c) and 5(c)] is captured by a plane achromatic objective when lighting up all LEDs and synthesized by the conventional R/G/B method. Several images are collected with a 25% overlapping rate and artificially stitched to form the full FOV. The FOV is then cropped to accommodate the objective and no stitching imperfections should be left. As for the multiplexing method, the ordinary scheme generally produces color images that converge to white as the mean values of three monochrome images in R/G/B channels converge to the same. Here, we adopt a modified multiplexing method as in Ref. [30] to address the problem by introducing three extra LR monochrome images for the mean-value correction.
Figures 4(d)–4(g) and 5(d)–5(g) show the reconstructed images of the three methods, with their RMSE, IHCS, and runtime marked precisely below. From the aspect of reconstruction precision, there is no doubt that the conventional R/G/B method generates the optimal reconstruction result because its operation relies on synthesized information of three channels, while both CFPM and CFFPM are performed on only a single channel with loss of information. The multiplexing method provides the poorest reconstruction performance, as both RMSE and IHCS are high, and there is also a problem of color leakage, and the results tend to be gray. The CFFPM method significantly outperforms CFPM for its smaller values of RMSE and IHCS. For example, taking the RMSE value of the conventional R/G/B method as the baseline, the respective differences of the multiplexing method, CFPM, and CFFPM are 7.84%, 2.49%, and 0.40%, respectively, for the sample in Fig. 4. The performance of CFFPM gets much closer to that of the conventional method from the numerical results (similar to Fig. 5). Figure 6 plots the curves of RMSE values as a function of iteration times in the CFFPM method to show the improvement and convergence of the iterative method. For the two samples in Figs. 4 and 5, the curves show a tendency to decrease and terminate at the fifth iteration. Here, we set the CFFPM method to terminate when the RMSE value of the channel reaches convergence. It can be visually identified in the reconstructed images that there is an obvious color difference between the CFPM reconstruction result and the ground truth. The color contrast of CFPM is relatively lower because the CFPM method fails to distinguish samples stained by two or more dyes. CFFPM effectively suppresses the color difference and presents a more natural and high-contrast color display.
Figure 6.Curves of RMSE value with the number of iterations in CFFPM method for (a) stained resting sporangia sample in Fig. 4 and (b) stained emphysema sample in Fig. 5. The dotted lines represent the RMSE value of the conventional R/G/B sequential method.
In terms of time cost, the runtime of the CFFPM method has been reduced from a few hours to several minutes in contrast with CFPM when performed on a CPU. Here, we do not discuss the runtime of the conventional R/G/B method or multiplexing method because the recorded runtime refers to the time required for color transfer, while the processes of the R/G/B method and multiplexing method contain only data acquisition and FPM reconstruction. The three methods are different in core ideas and cannot be compared reasonably at the same level. Table 2 compares the time for each section of colorization methods. It has been proved that the acquisition time and reconstruction time of CFPM are both around 1/3 those of the conventional R/G/B method because CFPM is performed on merely a single channel. CFFPM preserves this advantage for algorithmic improvement alone and hardly produces an impact on the two sections. The time spent on the two sections still has room for improvement because several fast acquisition methods and high-efficiency reconstruction algorithms can be adopted, which is why we focus mainly on the time for color transfer. The multiplexing method obtains an LR color image in a single shot but requires a higher overlapping rate; thus the acquisition time should be slightly more than 1/3 that of the conventional R/G/B method, about 9 min. The reconstruction of the multiplexing method does not reduce computational time, since the algorithm is quite complicated and more iterations are required. It is also not easy to be embedded into the GPU acceleration. Generally speaking, both CFPM and CFFPM have higher method efficiency than the conventional method. In addition, the acceleration of a GPU is almost strictly required for the CFPM method because the several-hour color transfer tie on a CPU does not meet the requirement of high-speed colorization, which greatly increases the hardware cost in turn. However, CFFPM provides outstanding operating efficiency even in the case of a CPU, and thus can be widely promoted to practical applications given its low-cost hardware requirements. Finally, we conclude that CFFPM achieves color transfer with less sacrifice of precision than CFPM and simultaneously decreases the computational burden without acceleration of a GPU.
Time Spent in Colorization Methods
Methods
Acquisition
Reconstruction
Color Transfer
CPU
GPU
CPU
GPU
R/G/B
/
/
Multiplexing
/
/
/
CFPM
CFFPM
To verify the performance of the CFFPM method at a wider scale and more precisely, we tested the method on 26 different pathological or biological samples or tiles (see Appendix A for the list of 26 samples), and the statistical results compared with the multiplexing method, CFPM, and conventional R/G/B method are shown in Fig. 7(a). The 26 samples are randomly drawn from 50 slices to provide statistical-level performance. It can be seen that CFFPM generates reconstruction results with a smaller value of RMSE than CFPM with no exception for all tested samples. The horizontal dotted lines of different colors in Fig. 7(a) plot the RMSE mean values for the three methods. As shown in the legend box, the differences of the multiplexing method, CFPM, and CFFPM compared with the R/G/B method are 3.80%, 4.76%, and 1.26% respectively, which again indicates that CFFPM realizes color transfer with less sacrifice of precision.
Figure 7.Statistical comparison results of four colorization methods. (a) RMSE curves of three methods for 26 tested samples at a statistical level. (b1), (c1) Respective ground truth of the No. 3 and No. 14 stained biological samples. (b2), (c2); (b3), (c3); (b4), (c4); (b5), (c5) Respective reconstructed results obtained by conventional R/G/B method, multiplexing method, CFPM, and CFFPM. RMSE values are marked below the corresponding results.
Judging from the tendency of curves in Fig. 7(a), we find that the colorization precision of the former half samples is generally higher than that of the latter half samples. That is because we have ranked these randomly selected samples according to the complexity of dyeing defined by the number of dyes: the former half samples are stained by two to three dyes, and the latter half samples are stained by four to five dyes. Figures 7(b1)–7(b5) (No. 3) and 7(c1)–7(c5) (No. 14) give the reconstructed images of two typical samples, respectively, from the former half and latter half. Considering that the two samples are both stained by multiple dyes, the color transfer result of CFFPM provides more obvious color discrimination, while CFPM is not capable enough to distinguish the different dyes. Specially, we note that the conventional R/G/B method cannot always provide the best colorization result, though it has been regarded as the baseline of comparison. As shown in Fig. 7(c2), although a white balance has been operated according to the coefficients of three channels, the colorization result seems to be covered with shadow, and the RMSE value is much larger than that of colorization methods based on color transfer, which can be attributed to the mottled background caused by the scattering of dust. Additionally, while a corrected multiplexing method has been used, the color leakage is still significant with various false color spots as shown in Fig. 7(c3).
4. CONCLUSION
In contrast to traditional pathology, digital pathology avoids the high cost of slide storage and inconvenient transportation, which provides global pathology research with uniform standards and higher quality. FPM makes it possible to realize high-throughput imaging in digital pathology through the combination of a synthetic aperture and phase retrieval. However, it requires repeated operations on three channels to obtain a full-color HR image using coherent monochromatic light imaging, which is time consuming and imposes a challenge to medical diagnosis.
In this paper, we reported a CFPM method called CFFPM. Compared with the previous CFPM, the method solves the double-coloring problem and improves both the precision and speed of color transfer. The average RMSE of this method tested on 26 randomly selected samples is 3.5% lower than that of CFPM. In the case of no GPU acceleration, the time required for color transfer maintains the level of several minutes, which proves to be a significant improvement on the several-hour time cost of CFPM. Compared with the conventional R/G/B method, statistical experimental results showed that the average RMSE is only 1.26% higher, which can hardly be detected by human eyes. In some special cases, CFFPM outperforms the conventional method due to coherent artifacts introduced by dust particles in the system.
These attractive advantages stem from the introduction of spatial information into color transfer. The color transfer probability function is obtained by combining bilateral filtering and LBP, and the color information of the two most similar points is exchanged in Lab space. In addition, the iterative procedure in CFFPM further improves the precision of color transfer, which is similar to conventional transfer learning and the process of iterative phase retrieval. The difference is that iterative color transfer in CFFPM is based on the related physical model and can be interpretable. In our future work, we will seek to give rigorous mathematical proof for the feasibility of the iterative procedure in CFFPM, though numerous experiments have proved in this paper that it indeed helps to produce color transfer results with higher precision. It can be expected that the report of the CFFPM method will promote clinical applications of computational optical imaging in digital pathology. The demo code is released on our website for noncommercial use [47].
APPENDIX A: SELECTION OF FILTER SIZE AND SLIDING STEP SIZE
As shown in Figs. 8, the red dashed box is the experimental result of stained resting sporangia, and the blue dashed box is the experimental result of stained emphysema. As shown in Figs. 8(a1) and 8(b1), we set ratio of , , and (which represent distance standard deviation, gray standard deviation, and feature standard deviation, respectively) as 1:1:1 for the two tested samples and make the size of the filter equal . Generally speaking, different samples have their respective block sizes and overlapping rates that are the most suitable, but their effect on RMSE is limited in most cases, for the two-dimensional scatter diagrams presenting a tendency to converge. Considering the calculation time and RMSE, the filter size and sliding step size are respectively set as 14 and 12. As shown in Figs. 8(a2) and 8(b2), it can be seen that is the main influencing factor of RMSE for the two samples, while has less effect. Usually choose a ratio of 1:1:1 to get better RMSE results.
Figure 8.Block size and overlapping rate. (a1) Effects of filter size and sliding step size on stained resting sporangia; (a2) effects of and on stained resting sporangia; (b1) effects of filter size and sliding step size on stained emphysema; (b2) effects of and on stained emphysema.
[1] N. Farahani, A. Parwani, L. Pantanowitz. Whole slide imaging in pathology: advantages, limitations, and emerging perspectives. Pathol. Lab. Med. Int., 7, 23-33(2015).
[10] R. W. Gerchberg, W. O. Saxton. A practical algorithm for the determination of phase from image and diffraction plane pictures. Optik, 35, 237-249(1972).
[19] A. Pan, C. Shen, B. Yao, C. Yang. Single-shot Fourier ptychographic microscopy via annular monochrome LED array. Frontiers in Optics + Laser Science APS/DLS, FTh3F.4(2019).