
Zhongyang Qi, Qingchun Guo, Shu Wang, Mingyue Jia, Xinwei Gao, Minmin Luo, Ling Fu. All-fiber-transmission photometry for simultaneous optogenetic stimulation and multi-color neuronal activity recording[J]. Opto-Electronic Advances, 2022, 5(12): 210081
- Opto-Electronic Advances
- Vol. 5, Issue 12, 210081 (2022)
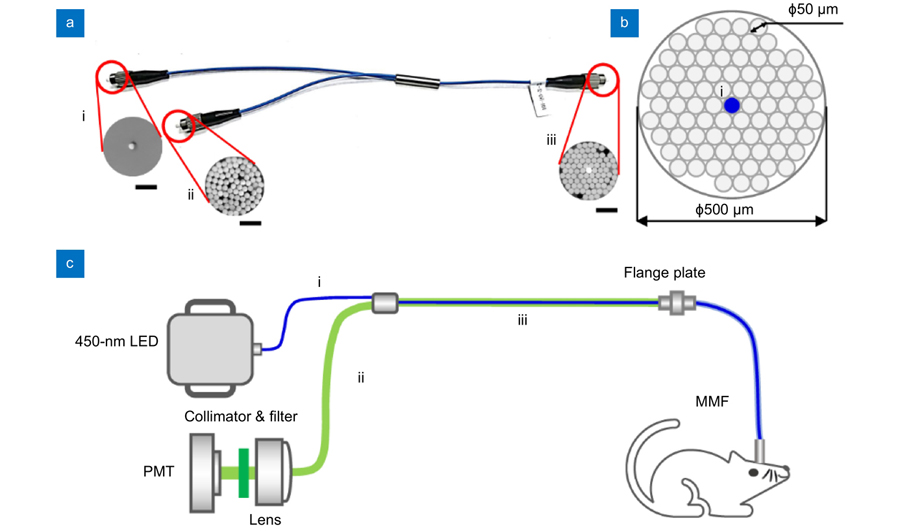
Fig. 1. A custom-designed bifurcated fiber bundle and all-fiber-transmission single-channel fiber photometry system. (a ) An image of the bifurcated fiber bundle. The bifurcated fiber bundle consists of 3 branches in total: the single-fiber branch i, the collection branch ii, and the common branch iii. The total length of this bundle is about 350 mm. The sub-image of iii was acquired using a high-intensity excitation light coupled into the single-fiber branch i. Scale bar, 200 μm. (b ) Diagram of the bifurcated fiber bundle common branch iii. The common branch iii (500 μm) consists of 83 hexagon distributed optical fibers (Φ50 μm/0.54 NA) in total. The single fiber from branch i for excitation light (blue) transmission is placed in the center of branch iii and is surrounded by the other 82 fibers (branch ii) for collecting fluorescence signals. (c ) Schematic diagram of the all-fiber-transmission single-channel fiber photometry system constructed with a custom-designed bifurcated fiber bundle. The excitation light from an LED is coupled into the multi-mode fiber connected to the animal through the single-fiber branch i. The emission fluorescence is then collected by the common branch iii and delivered to the PMT (behind a collimator and a fluorescence filter). Abbreviations: PMT, photo multiplier tube; MMF, multi-mode fiber. LED, light emitting diode.
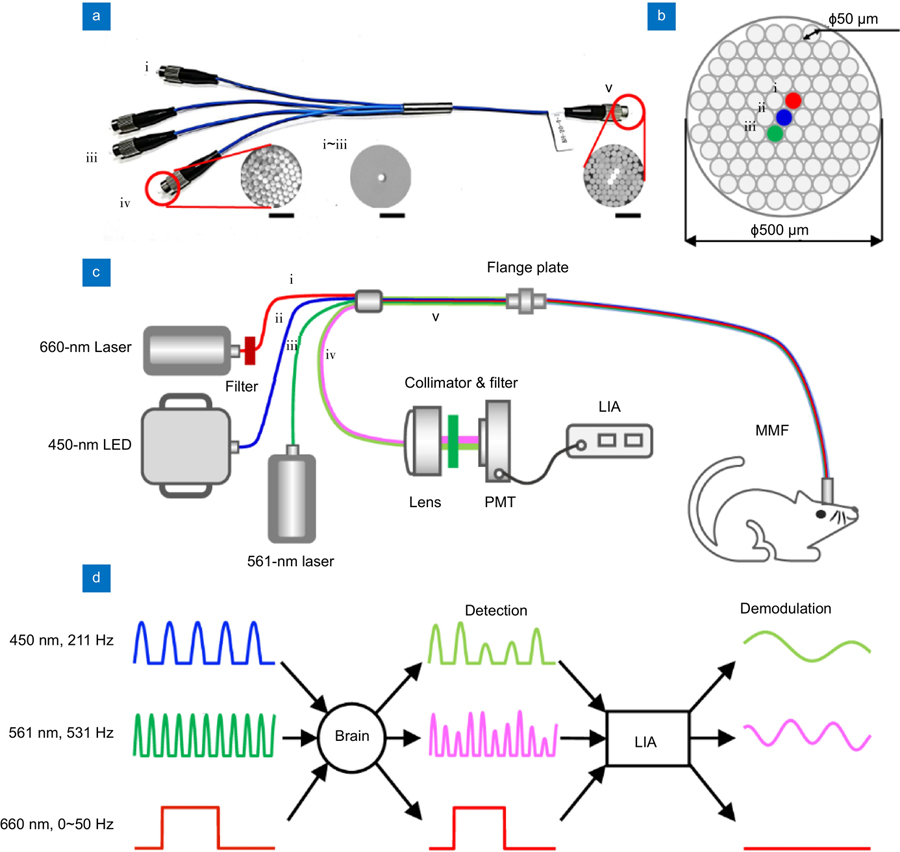
Fig. 2. A custom-designed four-branch fiber bundle and multi-function fiber photometry system. (a ) An image of the four-branch fiber bundle. The fiber bundle consists of 5 branches in total: the single-fiber branch i–iii, the collection branch iv, and the common branch v. The total length of this bundle is about 350 mm. The sub-image represents the end face of the single-fiber branch i–iii, the collection branch iv, and common branch v with high-intensity excitation light coupled into the three single-fiber branches i–iii. Scale bar, 200 μm. (b ) Diagram of the four-branch fiber bundle common branch v. The common branch v (500 μm) consists of 85 hexagon distributed optical fibers (Φ50 μm/0.54 NA) in total. The three brighter fibers in the center of the bundle correspond to the three single-fiber branches i–iii for coupling to three different excitation lights. (c ) Schematic diagram of the multi-function fiber photometry system constructed with the four-branch fiber bundle. Three light sources with different wavelengths are coupled into the multi-mode fiber and are connected to the mouse through the three single-fiber branches i–iii. The emission fluorescence is then collected by the common branch v and delivered to the PMT (behind the collimator and the fluorescence filters). The output signals of the PMT are preprocessed by a custom-designed lock-in amplifier, digitized using a DAQ card, and recorded using a custom LabVIEW script (50 Hz per channel). (d ) Schematic diagram of the lock-in amplifier for the multi-function fiber photometry system. These two excitation lights are modulated by sinusoidal signals with different frequencies (450 nm, 211 Hz; 561 nm, 531 Hz). The fluorescent signals can thus be de-modulated from the output signals of the PMT by the LIA, using the corresponding demodulation signals; note that crosstalk does not occur between the green and red channels. The stimulation artifacts caused by the optogenetic light (0~50 Hz) can be further inhibited. Abbreviations: PMT, Photo Multiplier Tube; MMF, Multi-Mode Fiber. LIA, Lock-in amplifier.
Fig. 3. Evaluation of the light transmission performance of the all-fiber-transmission photometry system. (a , b ) The fitting curve of the fluorescence intensity variation of a traditional epi-fluorescence system with the all-fiber-transmission photometry system based on the bifurcated fiber bundle (a) or the four-branch fiber bundle (b). The dashed line represents the curve for y = x. The red line represents the fitting curve for the single-channel fiber photometry system (f(x) = 1.297x, R-square: 0.9938) and the multi-function fiber photometry system (f(x) = 1.233x, R-square: 0.9982). (c ) The mean fluorescence intensity of the green (450 on: 0.1254 ± 0.0003; both on: 0.1257 ± 0.0004) and red (561 on: 0.3421 ± 0.0069; both on: 0.3456 ± 0.0059) channel between the other excitation light “off” and “on”. P>0.05, Wilcoxon’s signed-rank test;n = 7 pairs. (d ) No significant stimulation artifacts are detected in the green and red channels of the all-fiber-transmission photometry system when applying a 660-nm laser stimulation (P>0.05, Wilcoxon’s signed-rank test;n = 10 pairs). The blue bar indicates the time of stimulation.
Fig. 4. Real-time recording of DA dynamics in the NAcC of a freely moving mouse. (a ) Schematic diagram of the setup for real-time recording of DA dynamics responses to intra-oral 5% sucrose solution delivery through a cheek fistula3. The sucrose solution was randomly infused for 20 trials in one behavioral session. (b ) Histology confirming GRABDA2m expression (green) in the NAcC brain region. GRABDA2m: Ex 450 nm, Em 525 nm. The brain slice is 0.98 mm anterior to the bregma. Scale bar 500 μm. (c ) Representative trace of DA signals (encompassing five sequential trials) during the sucrose delivery experiment. The onset times of 5% sucrose solution delivery are indicated above the trace with blue bars. (d ) Heatmap of DA signal transients aligned to the onset time of sucrose solution delivery. Each row in the heatmap indicates the data for one behavioral trial; 20 trials are plotted. (e ) Averaged DA signal transients in response to sucrose solution delivery. The shaded area represents ±SEM. The blue bar represents a 1 s sucrose delivery event. Orange segments indicate a statistically significant increase from the baseline (*P<0.05, Wilcoxon’s signed-rank test;n = 10 pairs, one mouse). Abbreviations: DA, dopamine; NAc, nucleus accumbens; NAcC, nucleus accumbens core; NAcLat, nucleus accumbens lateral shell; NAcMed, nucleus accumbens medial shell.
Fig. 5. Simultaneous recording of dopamine dynamics and neuronal Ca2+ signals in the NAcLat of a freely moving mouse. (a ) Schematic diagram of dual-color recording surgery: we simultaneously record the DA signals (GRABDA2m, green) and the neuronal activity (jGRECO1a, red) in response to a 1 s unexpected sucrose solution in the NAcLat of a freely moving mouse. (b ) Histology confirming GRABDA2m (green) and jRGECO1a (red) co-expression in the NAcLat (GRABDA2m: Ex 450 nm, Em 525 nm; jGRECO1a: Ex 561 nm, Em 590 nm). The brain slice is 1.1 mm anterior to the bregma. Scale bar, 500 μm. (c ) Representative trace of DA signals and neuronal Ca2+ signals simultaneously acquired (encompassing five sequential trials) during the sucrose delivery experiment. The onset times of 5% sucrose solution delivery are indicated above the trace with blue bars. (d ) Averaged DA signal and neuronal Ca2+ signal transients in response to unexpected sucrose solution. The shaded area represents the SEM (±). The blue bar represents the 1 s sucrose solution. Orange segments indicate a statistically significant increase from the baseline (*P<0.05, Wilcoxon’s signed-rank test;n = 20 pairs, one mouse). (e ) Heatmap of DA signal and neuronal Ca2+ signal transients, aligned to the onset time of sucrose solution delivery. Each row in the heatmap indicates the data for one behavioral trial; 20 trials are plotted. The blue bar represents the delivery of a 1 s sucrose solution. Abbreviations: DA, dopamine; NAc, nucleus accumbens; NAcC, nucleus accumbens core; NAcLat, nucleus accumbens lateral shell; NAcMed, nucleus accumbens medial shell.
Fig. 6. Simultaneous dual-color recording and optogenetic manipulation of neuronal activities in the NAcLat of a freely moving mouse. (a ) Schematic diagram of simultaneous dual-color recording and optogenetic manipulation of neuronal activity surgery: we record GFP and mCherry fluorescence simultaneously, while specifically activating the terminals of VTA-NAc dopaminergic neurons (ChrimsonR: Ex 660 nm) in the NAcLat of a freely moving mouse. Note that GFP was replaced with GRABDA2m and jGRECO1a in subsequent experiments. (b ) Histology confirming GFP (green) labeled neurons and ChrimsonR (red) labeled dopaminergic neuron terminal expression in the NAcLat. The brain slice is 1.1 mm anterior to the bregma. Scale bar, 500 μm. (c ) No stimulation artifacts exist when simultaneously performing optogenetic manipulation and real-time dual-color recording in this system. The red bar indicates the time of stimulation. (P>0.05, Wilcoxon’s signed-rank test;n = 20 pairs, one mouse). (d ) Example of DA and neuronal Ca2+traces simultaneously recorded in the NAcLat of a freely moving mouse. (e ) Averaged DA signal and neuronal Ca2+ signal transients in response to phasic optogenetic stimulation (10 trials). The red bar indicates the time of stimulation. The pulse duration is set to 20 ms at 20 Hz, and lasts for 1 s in each trial. Orange segments indicate a statistically significant increase from the baseline (*P<0.05, Wilcoxon’s signed-rank test;n = 10 pairs, one mouse). (f ) Averaged DA signal and neuronal Ca2+ signal transients in response to tonic optogenetic. The red bar indicates the time of stimulation. The pulse duration is set to 10 ms at 4 Hz, and lasts for 5 s in each trial. No significant fluorescence changes are detected in the DA signals or the neuronal Ca2+ signals. (P>0.05, Wilcoxon’s signed-rank test;n = 10 pairs, one mouse). Abbreviations: DA, dopamine; NAc, nucleus accumbens; NAcC, nucleus accumbens core; NAcLat, nucleus accumbens lateral shell; NAcMed, nucleus accumbens medial shell.


Set citation alerts for the article
Please enter your email address

© Copyright 2018-2021 | Chinese Laser Press. All Rights Reserved 沪ICP备15018463号-20