Abstract
Manipulating and real-time monitoring of neuronal activities with cell-type specificity and precise spatiotemporal resolution during animal behavior are fundamental technologies for exploring the functional connectivity, information transmission, and physiological functions of neural circuits in vivo. However, current techniques for optogenetic stimulation and neuronal activity recording mostly operate independently. Here, we report an all-fiber-transmission photometry system for simultaneous optogenetic manipulation and multi-color recording of neuronal activities and the neurotransmitter release in a freely moving animal. We have designed and manufactured a wavelength-independent multi-branch fiber bundle to enable simultaneous optogenetic manipulation and multi-color recording at different wavelengths. Further, we combine a laser of narrow linewidth with the lock-in amplification method to suppress the optogenetic stimulation-induced artifacts and channel crosstalk. We show that the collection efficiency of our system outperforms a traditional epi-fluorescence system. Further, we demonstrate successful recording of dynamic dopamine (DA) responses to unexpected rewards in the nucleus accumbens (NAc) in a freely moving mouse. We also show simultaneous dual-color recording of neuronal Ca2+ signals and DA dynamics in the NAc upon delivering an unexpected reward and the simultaneous optogenetic activating at dopaminergic terminals in the same location. Thus, our multi-function fiber photometry system provides a compatible, efficient, and flexible solution for neuroscientists to study neural circuits and neurological diseases.Manipulating and real-time monitoring of neuronal activities with cell-type specificity and precise spatiotemporal resolution during animal behavior are fundamental technologies for exploring the functional connectivity, information transmission, and physiological functions of neural circuits in vivo. However, current techniques for optogenetic stimulation and neuronal activity recording mostly operate independently. Here, we report an all-fiber-transmission photometry system for simultaneous optogenetic manipulation and multi-color recording of neuronal activities and the neurotransmitter release in a freely moving animal. We have designed and manufactured a wavelength-independent multi-branch fiber bundle to enable simultaneous optogenetic manipulation and multi-color recording at different wavelengths. Further, we combine a laser of narrow linewidth with the lock-in amplification method to suppress the optogenetic stimulation-induced artifacts and channel crosstalk. We show that the collection efficiency of our system outperforms a traditional epi-fluorescence system. Further, we demonstrate successful recording of dynamic dopamine (DA) responses to unexpected rewards in the nucleus accumbens (NAc) in a freely moving mouse. We also show simultaneous dual-color recording of neuronal Ca2+ signals and DA dynamics in the NAc upon delivering an unexpected reward and the simultaneous optogenetic activating at dopaminergic terminals in the same location. Thus, our multi-function fiber photometry system provides a compatible, efficient, and flexible solution for neuroscientists to study neural circuits and neurological diseases.Introduction
The abilities to optogenetically manipulate and monitor neuronal activity with cell-type specificity are indispensable methods for neuroscientists to study neural circuits in behaving animals1-4. In particular, heterogeneous populations of neurons and various neurotransmitters5 comprise neural circuits of different functions, exhibiting distinctive neuronal activities6 corresponding to specific behaviors4, 7. For example, dopamine (DA) neurons are known to have two different firing patterns: the phasic pattern and the tonic pattern. These patterns induce distinct activities in their downstream neurons, which are involved in diverse physiological functions6, 8, 9. Moreover, the dentate ‘gate’ hypothesis of seizures has been experimentally evaluated in vivo using a closed-loop system to record and optogenetically manipulate the activity of granule cells during seizures in mice10. Thus, simultaneous optogenetic manipulation and multi-color recording to monitor feedback effects resulting from optogenetic circuit interventions are now recognized as the method of dreams for the causal investigations of neural circuits and neurological diseases.
However, previous techniques or systems to optogenetically manipulate or monitor neuronal activity in behaving animals are mostly separated and work independently11-23. Few studies have attempted to combine optogenetic manipulation and neuronal activity recording into a single system24-28. The optrode, which integrates electrophysiological recording29 with the optogenetic stimulations24, 30, is the most widely used method to record and manipulate neurons, but it cannot directly monitor neurotransmitter activities. Enabled by the development of genetically encoded fluorescent indicators (GEFI)31-35, optical imaging technologies including the miniature fluorescence microscope18, 27 and the miniaturized two-photon microscope17, 36 are capable of imaging and manipulating neurons at the same time. By implanting a gradient refractive index (GRIN) lens in the brain, these imaging techniques support direct imaging and optogenetic manipulation of specific types of neurons at single-cell resolution in deep brain regions of freely moving animals37. However, an implanted GRIN lens is usually in a diameter of 500 μm to 1 mm, thus inducing substantial damages to the brain38, 39. Furthermore, the current systems implemented with endoscopic imaging techniques are only capable of optogenetic manipulation and single-channel recording at a single wavelength.
As an alternative technique that induces less invasion, fiber photometry14, 15, 25, 26, 40-42 provides a unique feature for an easy and stable recording of population activities with cell-type specificity in freely moving animals. Various approaches have been proposed to incorporate optogenetics with fiber photometry, enabling wide applications and the discovery of many functional insights25, 26, 41. However, since the excitation spectrum of Channelrhodopsin-2 (ChR2, 473 nm)1, 43 is close to the emission spectrum of the Ca2+ indicator Oregon green 488 BAPTA-1 (OGB-1) or GCaMP (both peak at ~510 nm), and considering that it is quite challenging to completely filter out optogenetic stimulation light with milliwatt, obvious artifacts from optogenetic stimulation are inevitable in a weak (pico watt) fluorescent signal during recording (Supplementary information Fig. S1(a))25. Replacing ChR2 with a fast red-shifted channelrhodopsin, (e.g., bReaChES, 594 nm) can significantly reduce the artifacts observed with ChR2 (Supplementary information Fig. S1(b))26. However, only one type of neuron or neurotransmitter can be monitored in this case, and stimulation artifact is still a problem when involving dual-color recording, as the excitation spectrum of bReaChES overlaps with the emission spectrum of the RFP-based GEFIs (Supplementary information Fig. S1(c)).
To achieve simultaneous optogenetic manipulation and dual-color recording, more wavelength-range fluorescent proteins with spectral spacing (the peak emission wavelength of GEFIs to the effective excitation wavelength of opsin-sensors should exceed ~60 nm, Supplementary information Fig. S1(d)) need to be involved and the optical system is thus required to fully cover the visible spectrum. However, the currently available fiber photometry systems only cover the spectrum of 405~600 nm by using the classical epifluorescence imaging architecture (Supplementary information Fig. S2)26 consists of an objective lens and two or three dichroic mirrors. In this case, more dichroic mirrors are needed to couple the multiple wavelength light beams into one optical fiber, which makes the system more complex to extend the spectrum. Therefore, to make a compatible and flexible system, an all-fiber-transmission optical system can deliver multiple-wavelength light for simultaneous optogenetics and neuronal activity recording, and collect multi-color fluorescence signals.
Here, we developed an all-fiber-transmission photometry system based on a multi-branch fiber bundle44-46 for simultaneous optogenetic manipulation and multi-color recording of neuronal Ca2+ or neurotransmitter signals in a freely moving animal. Briefly, a non-wavelength selective multi-branch fiber bundle is combined with a PMT to replace the traditional imaging structure. The multi-function fiber photometry system can deliver all of the required light using optical fibers, making the system more robust for use in freely behaving experimental contexts. Notably, we adopted a narrow linewidth laser and used a lock-in amplification method47, 48 to successfully manage issues with optogenetic stimulation artifacts and channel crosstalk. We show that our system has excellent light transmission performance. Moreover, it can be readily reconfigured for simultaneous multi-color recording of neuronal Ca2+ signals and neurotransmitter dynamics and precise optogenetic manipulations in freely moving animals.
Materials and methods
Optical setup
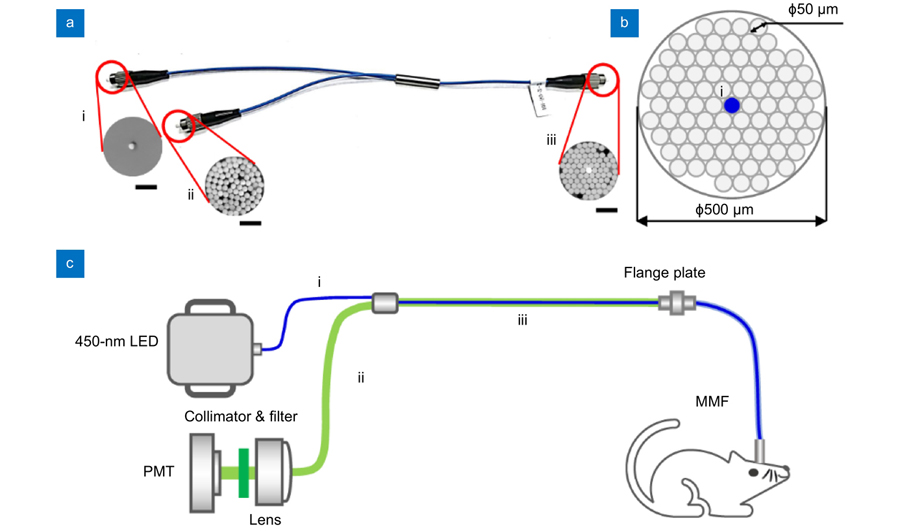
Using a custom-designed bifurcated fiber bundle (AlphaTech), we developed an all-fiber-transmission system for single-channel fiber photometry (Fig. 1). The overall appearance and section image of each branch of the bundle is shown in Fig. 1(a). The bifurcated fiber bundle consists of 3 branches in total: the single-fiber branch i, the collection branch ii, and the common branch iii. All these 83 fibers (branch iii) are hexagonally distributed in the common branch and divided into two branches with 1 (branch i) and 82 (branch ii) fibers in each of them (as Fig. 1(a) sub-image shows). To decrease optical transmission loss, the bundle length was limited to about 350 mm. The structure of common branch iii is shown in Fig. 1(b). The fiber we use in our design is glass optical fiber with 50 μm diameter and 0.54 numerical aperture (NA). To match the currently available 200 μm or 400 μm multi-mode fiber and efficiently collect the returned fluorescence, the diameter of the bundle is designed at approximately 500 μm. The single fiber from branch i for excitation light (blue) transmission is placed in the center of branch iii surrounded by the other 82 fibers (branch ii) for collecting fluorescence signals. Fig. 1(c) is a schematic diagram of the single-channel fiber photometry system we constructed using a bifurcated fiber bundle. Excitation light from a 450-nm LED through the single-fiber branch i is coupled into the multi-mode fiber (200 μm in diameter and 0.37 in NA) connecting to the fiber bundle and the animal. The emission fluorescence is collected by the common branch and delivered to the PMT (Hamamatsu, H10720-210) behind the collimator (DHC, GCL-010131) and the fluorescence filter (Semrock, FF01-525/39-25).

Figure 1.A custom-designed bifurcated fiber bundle and all-fiber-transmission single-channel fiber photometry system. (a) An image of the bifurcated fiber bundle. The bifurcated fiber bundle consists of 3 branches in total: the single-fiber branch i, the collection branch ii, and the common branch iii. The total length of this bundle is about 350 mm. The sub-image of iii was acquired using a high-intensity excitation light coupled into the single-fiber branch i. Scale bar, 200 μm. (b) Diagram of the bifurcated fiber bundle common branch iii. The common branch iii (500 μm) consists of 83 hexagon distributed optical fibers (Φ50 μm/0.54 NA) in total. The single fiber from branch i for excitation light (blue) transmission is placed in the center of branch iii and is surrounded by the other 82 fibers (branch ii) for collecting fluorescence signals. (c) Schematic diagram of the all-fiber-transmission single-channel fiber photometry system constructed with a custom-designed bifurcated fiber bundle. The excitation light from an LED is coupled into the multi-mode fiber connected to the animal through the single-fiber branch i. The emission fluorescence is then collected by the common branch iii and delivered to the PMT (behind a collimator and a fluorescence filter). Abbreviations: PMT, photo multiplier tube; MMF, multi-mode fiber. LED, light emitting diode.
Using a custom-designed four-branch fiber bundle (AlphaTech), we developed a multi-function fiber photometry system (Fig. 2) that can realize multi-color recording while also supporting precise optogenetic stimulation. Figure 2(a) shows a photo of the bundle consisting of 1 common branch v and 4 splitting branches i–iv. As illustrated in Fig. 2(b), 85 glass optical fibers (50 μm in diameter and 0.54 in NA) are hexagonally distributed in the common branch v. The three brighter fibers in the center of the bundle correspond to the three single-fiber branches i–iii for coupling to three different excitation lights. Considering that the small diameter (50 μm) of the single optical fiber will dramatically reduce the coupling efficiency, a higher power excitation light source is needed to achieve the excitation light intensity of GEFIs (15~40 μW) or opsin (2~20 mW). A schematic diagram of the multi-function fiber photometry system we constructed using this fiber bundle is shown in Fig. 2(c). In this system, we used three light sources with different wavelengths (Source 1∶450-nm LED; Source 2∶561-nm laser, Changchun New Industries Optoelectronics Technology, MGL-FN-561-100mW; Source 3∶660-nm laser, Changchun New Industries Optoelectronics Technology, MRL-III-633-200mW) and coupled them into the multi-mode fiber connecting to the animal using the three single-fiber branches i–iii. 450-nm and 561-nm excitation lights are used to excite the two different GEFIs (450-nm for dopamine sensors and 561-nm for the jGRECO1a Ca2+ sensor in this paper) for monitoring neuronal activities, and the 660-nm laser is used for the optogenetic stimulation. The emission fluorescence is then collected by the common branch v and delivered to the PMT (Hamamatsu, H11461-03) behind the collimator (DHC, GCL-010131) and the fluorescence filters (Dual bandpass filter: Chroma, 59012M; 633-nm short-pass filter: Semrock, BSP01-633R-25). The output signals of the PMT are preprocessed by a custom-designed lock-in amplifier (LIA)47, digitized using a DAQ card (NI, USB-6003), and recorded by a custom LabVIEW script (50 Hz per channel).
Figure 2.A custom-designed four-branch fiber bundle and multi-function fiber photometry system.(a) An image of the four-branch fiber bundle. The fiber bundle consists of 5 branches in total: the single-fiber branch i–iii, the collection branch iv, and the common branch v. The total length of this bundle is about 350 mm. The sub-image represents the end face of the single-fiber branch i–iii, the collection branch iv, and common branch v with high-intensity excitation light coupled into the three single-fiber branches i–iii. Scale bar, 200 μm. (b) Diagram of the four-branch fiber bundle common branch v. The common branch v (500 μm) consists of 85 hexagon distributed optical fibers (Φ50 μm/0.54 NA) in total. The three brighter fibers in the center of the bundle correspond to the three single-fiber branches i–iii for coupling to three different excitation lights. (c) Schematic diagram of the multi-function fiber photometry system constructed with the four-branch fiber bundle. Three light sources with different wavelengths are coupled into the multi-mode fiber and are connected to the mouse through the three single-fiber branches i–iii. The emission fluorescence is then collected by the common branch v and delivered to the PMT (behind the collimator and the fluorescence filters). The output signals of the PMT are preprocessed by a custom-designed lock-in amplifier, digitized using a DAQ card, and recorded using a custom LabVIEW script (50 Hz per channel). (d) Schematic diagram of the lock-in amplifier for the multi-function fiber photometry system. These two excitation lights are modulated by sinusoidal signals with different frequencies (450 nm, 211 Hz; 561 nm, 531 Hz). The fluorescent signals can thus be de-modulated from the output signals of the PMT by the LIA, using the corresponding demodulation signals; note that crosstalk does not occur between the green and red channels. The stimulation artifacts caused by the optogenetic light (0~50 Hz) can be further inhibited. Abbreviations: PMT, Photo Multiplier Tube; MMF, Multi-Mode Fiber. LIA, Lock-in amplifier.
As the power of optogenetic stimulation light (2 mW in our experiment) is much higher than the power of excitation light (20~40 μW) for recording, artificial signals may arise during optogenetic stimulation. In our system, we placed a narrow line-width bandpass filter (Thorlabs, FBH660-10) and a short-pass filter (Semrock, BSP01-633R-25) in front of the 660-nm laser and PMT respectively to decrease the stimulation artifacts. Moreover, to separate the fluorescence signals and further inhibit the stimulation artifacts during the dual-color recording and simultaneous optogenetic manipulation, we adopted the lock-in amplification method in our system. As shown in Fig. 2(d), these two excitation lights for recording are modulated by sinusoidal signals with different frequencies (450 nm, 211 Hz; 561 nm, 531 Hz; the modulation frequencies must avoid harmonic interference, eg: powerline harmonics at multiples of 50 Hz)49, 50, and the optogenetic light is often modulated using relatively low frequency (0–50 Hz) square signals. The emission fluorescence signals from the brain are detected by the PMT, and the output signals of the PMT are then de-modulated by the LIA, using the corresponding demodulation signals (211 Hz and 531 Hz sinusoidal signals); the fluorescence signals of different GEFIs can thus be recorded without channel crosstalk and stimulation artifacts.
Lock-in amplifier and data preprocessing
The fluorescence signals are de-modulated from the output signals (fPMT) of the PMT by the LIA, using the corresponding demodulation signals (fref-greenandfref-red). As the frequency of the optogenetic stimulation artifact (0~50 Hz) is quite lower than the modulation frequency of these two excitation lights (f0: 211 Hz;f1: 531 Hz), the artifact component can be treated as a constant noise (nnoise) during the period of stimulation. Thus, the input signal fi (the output signalsfPMT of the PMT) can then be represented as:
where A and B are the signal amplitude, and w0 and w1are the angular frequency (2πf0 and 2πf1 respectively).
The corresponding modulation signal fref-greenand fref-red can be set to be:
where C and D are the amplitude of the corresponding modulation signals.
After the multiplier, the outputs (fc-green andfc-red) are:
According to the
Eqs. (4) and
(5), when the signals pass through the low-pass filter, the high-frequency components are filtered out, and the fluorescence signals fout-green and fout-redcan be separated from the mixed fluorescence signals fi:
Animals
All experiments were approved and were conducted in accordance with the guidelines of the committee on animal health and care of the National Institute of Biological Sciences (NIBS), Beijing.
DAT-Cre mice (JAX Strain 006660) were obtained from the Jackson Laboratory. Male wild-type C57BL6/N mice were purchased from Beijing Vital River Laboratory Animal Technology Co., Ltd (China). All mice were kept under standard conditions of 12/12 hours light-dark cycle (light on 8 PM), with ad libitum food and water, except for the sucrose delivery during the fiber photometry experiments, in which mice were deprived of water for 36 hours before the test.
Viral vector preparation
The pAAV-hSyn-GRABDA2m plasmid (9.4 × 10¹² vg/mL) we used to detect the DA release in NAc was kindly provided by Dr. Yulong Li (Peking University). The AAV-hSyn-Flex-ChrimsonR-mCherry (1013 vg/mL) for VTA-NAc terminal stimulation was purchased from Shanghai Taitool Bioscience Co., China. pAAV9-hsyn-NES-jRGECO1a-WPRE (5.06 × 10¹³ vg/mL) was purchased from Shandong Vigene Biosciences. Inc., China. The AAV-hSyn-EGFP-RPL10 (4.3 × 10¹² vg/mL) plasmid in our control experiment was kindly provided by Dr. Fei Zhao (Chinese Institute for Brain Research, Beijing).
Animal surgery and virus injection
Mice were anesthetized by Avertin (i.p., 250 mg/kg) and fixed in a standard stereotaxic frame (RWD Instruments, China). After disinfection with medical alcohol and exposure of the skull, a small craniotomy was made and ~300 nL viruses were delivered using a calibrated pulled-glass pipette (Sutter Instrument); injection into the unilateral targeted brain areas (46 nL/min). All coordinates for the injection sites, as measured from the bregma, include: Nucleus Accumbens core (NAcC): 0.98 mm anterior, 1.3 mm lateral, 4.3 mm ventral; NAc lateral shell (NAcLat): 1.1 mm anterior, 1.3 mm lateral, 4.6 mm ventral; Ventral tegmental area (VTA): 3.4 mm posterior, 0.3 mm lateral, 4.1 mm ventral. After pausing for an additional 5 minutes, the pipette was removed slowly from the brain.
For the fiber photometry and optogenetic experiments, optical fiber (NA: 0.39, diameter: 200 μm; Thorlabs) was implanted 100 μm above the injection site. The ceramic ferrule outside the fiber was then fixed to the skull with super bond C&B dental silicate cement (Parkell Prod). The animals were maintained in their home cage for 2 weeks for recovery and virus expression prior to any testing.
Histology and imaging
After completion of the recording and testing, mice were anesthetized by an overdose of pentobarbital and perfused intracardially with 0.9% phosphate buffer saline and then 4% paraformaldehyde (PFA). The brains were removed carefully and postfixed in 4% PFA for 4 h at room temperature. After cryoprotection in 30% sucrose, coronal sections (50 μm thickness) were cut using a cryostat (Leica, CM1950). The slices were imaged using a slide scanner (Olympus, VS120) with 10x objectives to confirm virus expression and fiber placements. Images were analyzed using ImageJ (NIH).
Data analysis and statistical tests
For fiber photometry recording, the data were acquired by a data acquisition card (National Instrument, USB-6001) and was processed by a custom MATLAB (MathWork, Inc.) program for further analysis. We defined the value of fluorescence change (∆F/F) by calculating the following equation:
where F0 is the mean value of the 2 s control time immediately before the behavioral event. The ∆F/F value was displayed as a heat map or as an average plot (with a shaded area representing the SEM).
For the statistical significance of the event-related fluorescence (ERF) change analysis3 (Statistically evaluate the degree of correlation between neuronal activity and event stimulation), we performed Wilcoxon signed-rank tests to test the significance of neuronal responses by comparing the ∆F/F value at each time point with the baseline values (the mean ∆F/Fvalue of the 2 s control time immediately before the behavioral event). The P-value of each time was superimposed on the average ERF curve with orange lines, indicating a statistically significant (P<0.05) increase.
Results and discussion
Evaluation of the light transmission performance of the all-fiber-transmission photometry system.
In the all-fiber-transmission photometry system, a multi-channel fiber bundle was designed and manufactured to realize the all-fiber transmission of both the excitation light and the emission light. The spectral transmittance of the multi-channel bundle was about 60% per meter in the range of 400 to 900 nm. To decrease optical transmission loss, the bundle length was limited to about 350 mm, thus about 84% of the light was effectively transmitted.
When using the common branch to collect the fluorescence from the multi-mode fiber, part of the fluorescence is guided back to the light source through the single fiber branch, therefore cannot be detected by the PMT. To characterize the loss in fluorescence signal, we tested the collection efficiency of these two systems using a series of sodium fluorescein solutions with different concentrations and compared the results to those acquired using the traditional epi-fluorescence system used in our previous study3. We used the same laser, PMT, multi-mode fiber, emission filter, and sodium fluorescein solution in the testing with various systems.
Under the same excitation intensity (40 μW), we tested five concentrations (10~50 ng/mL) and calculated the intensity variation (ΔF) by subtracting the value obtained with pure water. As shown in Fig. 3, our system was linearly correlated with the traditional setup: the red lines represent the fitting curves for the single-channel fiber photometry system (Fig. 3(a), f(x) = 1.297x, R-square: 0.9938) and the multi-function fiber photometry system (Fig. 3(b), f(x) = 1.233x, R-square: 0.9982). The slopes of the fitting curve are 1.297 and 1.233, indicating that the fluorescence collection efficiency of our method was 20–30% better than the traditional setup. These results demonstrated that our all-fiber transmission fiber photometry system based on a multi-branch fiber bundle was capable of effectively exciting and collecting fluorescence signals.
Figure 3.Evaluation of the light transmission performance of the all-fiber-transmission photometry system. (a, b) The fitting curve of the fluorescence intensity variation of a traditional epi-fluorescence system with the all-fiber-transmission photometry system based on the bifurcated fiber bundle (a) or the four-branch fiber bundle (b). The dashed line represents the curve for y = x. The red line represents the fitting curve for the single-channel fiber photometry system (f(x) = 1.297x, R-square: 0.9938) and the multi-function fiber photometry system (f(x) = 1.233x, R-square: 0.9982). (c) The mean fluorescence intensity of the green (450 on: 0.1254 ± 0.0003; both on: 0.1257 ± 0.0004) and red (561 on: 0.3421 ± 0.0069; both on: 0.3456 ± 0.0059) channel between the other excitation light “off” and “on”. P>0.05, Wilcoxon’s signed-rank test;n = 7 pairs. (d) No significant stimulation artifacts are detected in the green and red channels of the all-fiber-transmission photometry system when applying a 660-nm laser stimulation (P>0.05, Wilcoxon’s signed-rank test;n = 10 pairs). The blue bar indicates the time of stimulation.
We then evaluated the potential crosstalk between two channels. As shown in Fig. 3(c), we measured the fluorescence intensity of each channel while opening (“on”) and closing (“off”) the 450-nm and 561-nm excitation lights. We observed no significant change in both channels when the other excitation light was “on” or “off”, which demonstrated that no substantial channel crosstalk existed in our all-fiber-transmission photometry system.
We further evaluated the potential stimulation artifacts by measuring the fluorescence intensity of the two channels without the 450-nm and 561-nm excitation light. We observed that the fluorescence intensity of both channels exhibited no response to the optogenetic stimulation (Fig. 3(d)). This demonstrated that the stimulation artifacts can be inhibited to a basal noise level in our all-fiber-transmission photometry system.
Real-time recording of neurotransmitter dynamics in the deep brain region of a freely moving mouse
We then tested the performance of our single-channel fiber photometry system based on a bifurcated fiber bundle by recording DA dynamics at a 100 Hz sampling rate in the nucleus accumbens core (NAcC) of a freely moving mouse. DA is an important neurotransmitter in the brain that exerts functions related to reward, motivation, and motor control8, 51. The dysfunctions of the DA system are associated with neurological disorders such as Parkinson's disease and schizophrenia52. The NAc is known to be a major brain area that accepts DA released from the ventral tegmental area (VTA) DA neurons53.
We used the single-channel fiber photometry system shown in Fig. 1(c) to monitor DA dynamics when delivering a sucrose solution (12.5 μL, 5% w/v) to a 36-hour water-deprived mouse through a cheek fistula (Fig. 4(a)). The genetically encoded GPCR-activation-based-DA sensor (GRABDA2m)33 was expressed in NAcC neurons to monitor the DA release from DA neurons in the VTA in a wild-type mouse. An optical fiber was implanted 100 μm above the injection site for both the delivery of excitation lights and the collection of emitted light. Histology confirmed the locations of the fiber and GRABDA2m expression in the NAcC two weeks later (Fig. 4(b)).
Figure 4.Real-time recording of DA dynamics in the NAcC of a freely moving mouse. (a) Schematic diagram of the setup for real-time recording of DA dynamics responses to intra-oral 5% sucrose solution delivery through a cheek fistula3. The sucrose solution was randomly infused for 20 trials in one behavioral session. (b) Histology confirming GRABDA2m expression (green) in the NAcC brain region. GRABDA2m: Ex 450 nm, Em 525 nm. The brain slice is 0.98 mm anterior to the bregma. Scale bar 500 μm. (c) Representative trace of DA signals (encompassing five sequential trials) during the sucrose delivery experiment. The onset times of 5% sucrose solution delivery are indicated above the trace with blue bars. (d) Heatmap of DA signal transients aligned to the onset time of sucrose solution delivery. Each row in the heatmap indicates the data for one behavioral trial; 20 trials are plotted. (e) Averaged DA signal transients in response to sucrose solution delivery. The shaded area represents ±SEM. The blue bar represents a 1 s sucrose delivery event. Orange segments indicate a statistically significant increase from the baseline (*P<0.05, Wilcoxon’s signed-rank test;n = 10 pairs, one mouse). Abbreviations: DA, dopamine; NAc, nucleus accumbens; NAcC, nucleus accumbens core; NAcLat, nucleus accumbens lateral shell; NAcMed, nucleus accumbens medial shell.
We measured DA signals in a freely moving mouse upon a 1 s unexpected sucrose solution that was delivered at random inter-trial intervals of 15–25 s (Fig. 4(c)). As shown in Fig. 4(d, e) (Supplementary information Fig. S3), the DA fluorescence signals, excited by 40 μW of 450-nm LED light, significantly increased immediately following the delivery of the unexpected reward (∆F/F = 11.5 ± 0.9%, mean ± SEM; P<0.05, Wilcoxon’s signed-rank test;n = 20 trials with one mouse). It indicated that the dynamics of DA release from the VTA-NAc DA neurons were positively correlated with the reward, consistent with previous studies33, 53. These results together demonstrated that our all-fiber transmission fiber photometry system can effectively detect temporal fluorescence dynamics and can be used for real-time monitoring of neurotransmitter dynamics in freely moving animals.
Simultaneous recording of neurotransmitter dynamics and neuronal Ca2+ signals in the deep brain region of a freely moving mouse
We then tested the performance of a multi-channel fiber photometry system based on a four-branch fiber bundle by simultaneously recording DA dynamics and neuronal Ca2+ signals in the NAc lateral shell (NAcLat). Multiple neuron types that release different neurotransmitters can show various activities in response to a specific function in the NAc or other nucleus; thus, the ability to simultaneously record neuronal activities labeled by multiple-color was essential to study the interactions amongst distinct neuron types in behaving animals54. The DA sensor GRABDA2m (450-nm excitation) and the red Ca2+ indicator jGRECO1a (561-nm excitation)32 were co-expressed in the NAcLat of a wild-type mouse (Fig. 5(a)), and the excitation lights (20 µW) were delivered to the brain through the same optical fiber. Histology confirmed the locations of the fiber and the expression of both GRABDA2m and jGRECO1a in the NAcLat two weeks later (Fig. 5(b)).
Figure 5.Simultaneous recording of dopamine dynamics and neuronal Ca2+ signals in the NAcLat of a freely moving mouse. (a) Schematic diagram of dual-color recording surgery: we simultaneously record the DA signals (GRABDA2m, green) and the neuronal activity (jGRECO1a, red) in response to a 1 s unexpected sucrose solution in the NAcLat of a freely moving mouse. (b) Histology confirming GRABDA2m (green) and jRGECO1a (red) co-expression in the NAcLat (GRABDA2m: Ex 450 nm, Em 525 nm; jGRECO1a: Ex 561 nm, Em 590 nm). The brain slice is 1.1 mm anterior to the bregma. Scale bar, 500 μm. (c) Representative trace of DA signals and neuronal Ca2+ signals simultaneously acquired (encompassing five sequential trials) during the sucrose delivery experiment. The onset times of 5% sucrose solution delivery are indicated above the trace with blue bars. (d) Averaged DA signal and neuronal Ca2+ signal transients in response to unexpected sucrose solution. The shaded area represents the SEM (±). The blue bar represents the 1 s sucrose solution. Orange segments indicate a statistically significant increase from the baseline (*P<0.05, Wilcoxon’s signed-rank test;n = 20 pairs, one mouse). (e) Heatmap of DA signal and neuronal Ca2+ signal transients, aligned to the onset time of sucrose solution delivery. Each row in the heatmap indicates the data for one behavioral trial; 20 trials are plotted. The blue bar represents the delivery of a 1 s sucrose solution. Abbreviations: DA, dopamine; NAc, nucleus accumbens; NAcC, nucleus accumbens core; NAcLat, nucleus accumbens lateral shell; NAcMed, nucleus accumbens medial shell.
We recorded the DA signals and neuronal activities in response to unexpected rewards in a freely moving mouse following the same protocol as described above (Fig. 5(c)). As shown in Fig. 5(d, e), we observed that DA fluorescence signals and neuronal Ca2+ signals both significantly increased upon the delivery of unexpected sucrose solutions (DA: ∆F/F = 11.2 ± 0.4%, jGRECO1a: ∆F/F = 8.5 ± 0.8%, mean ± SEM; P<0.05, Wilcoxon’s signed-rank test;n = 20 trials with one mouse). It indicated that NAcLat neurons and the VTA-NAc DA neurons were positively correlated with the rewards, consistent with previous studies33, 34, 53. However, we noted that these activities had a clear difference in the time course3 for unexpected rewards (Supplementary information Fig. 4). Throughout the recording session, the DA signals were correlated with, yet lagged behind, the neuronal Ca2+ signals (DA: peak time = 1.91 ± 0.14 s, median latency to peak = 0.99 ± 0.14 s; jGRECO1a: peak time = 0.96 ± 0.02 s, median latency to peak = 0.34 ± 0.04 s, mean ± SEM). Further, the DA signals displayed an overall prolongment of activation (DA: decay duration = 3.81 ± 0.16 s; jGRECO1a: decay duration = 1.08 ± 0.04 s, mean ± SEM). Given that GRABDA2m and jGRECO1a exhibited similarly rapid rising times32, 33, the result thus suggested that NAc neurons received reward signals from two separate sources: a yet-to-identified input triggered the earlier Ca2+ increase, and another input likely from the VTA triggered the slightly later DA release. Together, the results showed strong evidence of heterogeneous neuronal activities in local neuronal circuits. These results also demonstrated that our all-fiber transmission fiber photometry system based on the four-branch fiber bundle can simultaneously detect dynamic fluorescence signals from different GEFIs and was suitable for real-time monitoring of multiple, distinct neuronal activities in freely moving animals.
Simultaneous dual-color recording and optogenetic manipulation of neuronal activities in the deep brain region of a freely moving mouse
We then tested the performance of our multi-function fiber photometry system for simultaneous dual-color recording and precise optogenetic manipulation of neuronal activity in the NAc of a freely moving mouse. Many studies have demonstrated the power of combining simultaneous recording of cell-type-specific neurons and precise optogenetic manipulation of specific neuron types during animal behavior for studies of functional connectivity, activity dynamics, causation between neuronal activities and behaviors, and the physiological functions of neural circuits4, 25, 54, 55.
VTA dopaminergic neurons are known to project to the NAc and to regulate a variety of physiological processes, including reward, motivation, and motor control48, 56. We first verified that our system does not elicit stimulation artifacts when simultaneously performing optogenetic manipulation and real-time dual-color recording in vivo. A schematic diagram of the experiment is shown in Fig. 6(a): we specifically labeled the VTA DA neurons in a DAT-Cre mouse using a DIO-ChrimsonR-mCherry AAV vector and expressed GFP in all NAcLat neurons. Histology conducted two weeks later confirmed the location of the fiber, the expression of GFP in the somata of NAcLat neurons, and the expression of mCherry in the VTA-NAc dopaminergic terminals (Fig. 6(b)). No significant fluorescence changes were observed in the GFP or mCherry channels during optogenetic stimulation (2 mW, 20 ms per pulse, and 20 Hz for 1 s) (Fig. 6(c), P>0.05, Wilcoxon’s signed-rank test;n= 10 trials with one mouse), supporting that no obvious stimulation artifacts occurred with our system in this experiment.
Figure 6.Simultaneous dual-color recording and optogenetic manipulation of neuronal activities in the NAcLat of a freely moving mouse. (a) Schematic diagram of simultaneous dual-color recording and optogenetic manipulation of neuronal activity surgery: we record GFP and mCherry fluorescence simultaneously, while specifically activating the terminals of VTA-NAc dopaminergic neurons (ChrimsonR: Ex 660 nm) in the NAcLat of a freely moving mouse. Note that GFP was replaced with GRABDA2m and jGRECO1a in subsequent experiments. (b) Histology confirming GFP (green) labeled neurons and ChrimsonR (red) labeled dopaminergic neuron terminal expression in the NAcLat. The brain slice is 1.1 mm anterior to the bregma. Scale bar, 500 μm. (c) No stimulation artifacts exist when simultaneously performing optogenetic manipulation and real-time dual-color recording in this system. The red bar indicates the time of stimulation. (P>0.05, Wilcoxon’s signed-rank test;n = 20 pairs, one mouse). (d) Example of DA and neuronal Ca2+traces simultaneously recorded in the NAcLat of a freely moving mouse. (e) Averaged DA signal and neuronal Ca2+ signal transients in response to phasic optogenetic stimulation (10 trials). The red bar indicates the time of stimulation. The pulse duration is set to 20 ms at 20 Hz, and lasts for 1 s in each trial. Orange segments indicate a statistically significant increase from the baseline (*P<0.05, Wilcoxon’s signed-rank test;n = 10 pairs, one mouse). (f) Averaged DA signal and neuronal Ca2+ signal transients in response to tonic optogenetic. The red bar indicates the time of stimulation. The pulse duration is set to 10 ms at 4 Hz, and lasts for 5 s in each trial. No significant fluorescence changes are detected in the DA signals or the neuronal Ca2+ signals. (P>0.05, Wilcoxon’s signed-rank test;n = 10 pairs, one mouse). Abbreviations: DA, dopamine; NAc, nucleus accumbens; NAcC, nucleus accumbens core; NAcLat, nucleus accumbens lateral shell; NAcMed, nucleus accumbens medial shell.
Finally, we recorded neuronal Ca2+ signals and DA dynamics simultaneously while activating the VTA-NAC dopaminergic terminals in a freely moving mouse. We specifically labeled the VTA DA neurons in a DAT-Cre mouse using a DIO-ChrimsonR-mCherry virus, and co-expressed the DA sensor GRABDA2m and the red Ca2+ indicator jGRECO1a in NAcLat neurons. We recorded the DA signals and jRGECO1a fluorescence signals in a freely moving mouse (50 Hz per channel). As we know, DA neurons exhibit two different firing patterns to induce distinct activities in their downstream neurons and involve diverse physiological functions6, 8. Then, two different patterns of light pulse stimulations were delivered to the VTA-NAC dopaminergic terminals to induce tonic or phasic firing patterns48. We observed that optogenetic phasic stimulation (20-ms per pulse and 20 Hz for 1 s) evoked a significant, time-locked rising trend in the DA signals (DA: ∆F/F = 6.3 ± 0.7%, mean ± SEM; P<0.05, Wilcoxon’s signed-rank test;n = 10 trials with one mouse), consistent with a previous study33. However, we noted that neuronal Ca2+ signals displayed only a slight rising trend (Fig. 6(e), Supplementary. Fig. 5). Upon applying the tonic stimulation (10-ms per pulse and 4 Hz for 5 s), there were no significant changes in either the DA signals or the neuronal Ca2+ signals (Fig. 6(f),P>0.05, Wilcoxon’s signed-rank test;n= 10 trials with one mouse).
These results support previous findings that dopamine is acutely released in the NAcLat when evoked by a burst stimulation of the VTA-NAC dopaminergic terminals48, 57, and suggest that Ca2+ signals from population activity are not sensitive to DA release from the VTA neurons in the NAcLat. Notably, to our understanding, such results could not be obtained using conventional electrophysiological recordings: it cannot directly monitor the level of neurotransmitter release58. These results support that our system can perform simultaneous dual-color recording of various neuronal populations while also enabling precise optogenetic manipulation; these combined capacities seem likely to make our system useful for diverse neuroscience functional investigations of various neuron populations and circuits.
Conclusions
We developed a flexible all-fiber transmission fiber photometry system that supports simultaneous dual-color recording of neuronal or neurotransmitter activities combined with precise optogenetic manipulation in freely moving animals. In this system, we designed and manufactured a non-wavelength selective multi-branch fiber bundle to realize the all-fiber transmission of both the excitation light and the emission light, which simplified the system and increased its robustness in freely moving animal experiments. Adopting a laser of narrow line-width for the stimulation and a lock-in amplification method, our system can extract fluorescence signals of two different colors (GFP-based and RFP-based GEFIs) while inhibiting the potential artifacts caused by the optogenetic manipulation (channelrhodopsin with far red-shifted excitation spectrum, 660 nm). Importantly, we showed that our system’s collection efficiency was better than a conventional epi-fluorescence system, and we successfully recorded DA dynamics in the NAc of a freely moving mouse. Finally, we successfully recorded both neuronal Ca2+ and neurotransmitter dynamic signals in the NAc while also applying precise optogenetic manipulation of the dopaminergic terminals in the same site in a freely moving mouse.
Optogenetic manipulation and monitoring of neuronal activity in a freely moving animal are essential methods for rodent-based neuroscience investigations of brain connectivity and function1, 2. Several previous studies24-27 have attempted to combine these two methods to achieve real-time feedback after applying optogenetic stimulation to directly test whether inferred models of dynamics, connectivity, and causation are accurate in vivo4. However, these methods—including the optrode24, the miniature fluorescent miniscope27, the miniaturized two-photon microscope17, and fiber photometry25, 26, 41—only support the monitoring of one type of neuronal activity when applying optogenetic manipulation at present. A major reason for this is that the action spectrums of the commonly used opsin-sensors43 like ChR2 (470 nm), eArch3.0 (566 nm), and ChrimsonR (590 nm) are relatively limited, which either have spectral overlap to the excitation spectrum or are too close to the emission spectrum of GEFIs31, 32 like GCaMP6 (510 nm) and jRGECO1a (588 nm). Therefore, when using both the GFP-based and RFP-based GEFIs to label the neurons simultaneously, it is very challenging to completely filter out high-power stimulation light (2~20 mW). And the residual optogenetic stimulation light detected by the detector will lead to obvious artifacts in the acquired signals4, 25, 26, 41. Fluorescent proteins with more spectral spacing need to be involved and the optical system is required to fully cover the visible spectrum.
Our design adopted the strategy of all-fiber-transmission by using a small multi-branch fiber bundle to replace the dichroic mirrors and an objective lens, which realized—in a single fiber bundle—three excitation or stimulation lights and two emission lights. In this way, we dramatically simplified the multichannel system and made it more robust and flexible for use in freely behaving experimental contexts. We adopted a laser of narrow line-width of 660-nm to activate the red light–drivable channelrhodopsin (ChrimsonR), therefore inhibited the stimulation-induced artifacts using a lock-in amplification method, which also allowed us to separate the fluorescence signals of the dual-color channels. Our system can be easily modified into different variants for other fluorescent probes and opsin-based sensors by changing the light sources and filter positions before the PMT without adjusting the optical path.
With rapid developments of fluorescent indicators31, 32, such as neurotransmitter probes33, 34, 54, light-activated conversion technologies59, 60, a multi-function system is required for neuroscience research4, 10. Our all-fiber-transmission photometry system supports simultaneous dual-color recording of neuronal or neurotransmitter activities simultaneously with precise optogenetic manipulation in freely moving animals. Thus, it is especially well-suited for the study of interactions amongst different neuron types or neurotransmitters in behaving animals for multiple processes, such as reward34 or sleep homeostasis54. More importantly, our system has the potential to be modified into a closed-loop system that can guide optogenetic manipulation informed by real-time monitoring feedback effects4, 10, 25. The all-fiber-transmission photometry system should be a valuable tool for neuroscientists seeking to comprehensively profile neural circuit functions3, 53, 54 and to study neurological diseases10.