
Wei ZHANG, Chen LIU, Yuantao CHEN, Wangsuo WU. Removal of Boron from Water by Mg-Al-Ce Hydrotalcite Adsorption [J]. Journal of Inorganic Materials, 2020, 35(3): 337
- Journal of Inorganic Materials
- Vol. 35, Issue 3, 337 (2020)
Abstract
Boron is an important micronutrient for plants, animals, and humans. However, high concentrations of boron are harmful to animals and plants[
In this work, we prepared Mg-Al-Ce-HT by co- precipitation method and studied the effects of initial pH, adsorbent content, initial boric acid concentration, temperature, and contact time on the adsorption performance.
1 Experimental section
1.1 Sample preparation
All reagents were chemical reagent grade and used without further purification. The Mg-Al-Ce hydrotalcite was synthesized by the co-precipitation method. Mg(NO3)2·6H2O (25 mmol), Al(NO3)3·9H2O (1 mmol), and Ce(NO3)3·6H2O (4 mmol) were dissolved in 40 mL deionized water (Solution I). NaOH (3.47 g) and Na2CO3 (0.35 g) were dissolved in 40 mL of deionized water (Solution II). The solution I was added into solution II with stable stirring and placed at room temperature for 6 h. The resulting precipitate was separated by centrifugation and washed several times with deionized water until the pH of the supernatant reached nearly 8.0. The sediment was dried in vacuum at 60 ℃ for 12 h. The dried product was calcined at 400 ℃ for 4 h.
1.2 Boron adsorption
In boron adsorption studies, the amount of Mg-Al-Ce- HT was added into 50 mL aqueous solution of 100 mg·L-1 H3BO3. The mixture was placed in a conical flask and shaken in a temperature-controlled shaker for 12 h at 25 ℃. The adsorbent was filtered off and the boron concentration of the residual solution was tested by ICP-OES. In order to explore the impact of different factors, the amount of adsorbent, initial pH, initial concentration of boric acid, and contact time varied across different batch experiments. For the adsorption and thermodynamics study, Mg-Al-Ce-HT was added into a series of aqueous boric acid solutions at different temperatures (308, 313, and 323 K). The adsorbent was dispersed into these boron solutions with 200 mg. The mixtures were placed in 50 mL conical flasks and shaken in a temperature- controlled shaker for 12 h. Upon completion of the adsorption process, the adsorbents were filtered off and the boron concentration was analyzed by ICP-OES.
1.3 Data analysis
The boron adsorption was studied using batch experimentation method. The effects of adsorbent content, initial pH, initial concentration, and adsorption isotherm contact time, were investigated. The adsorption percentages (Y) and adsorption capacity (Cs) were calculated with the following equations, using the experimental data of the boric acid concentration after adsorption.
Where C0 (mg·L-1) is the initial boric acid concentration; Ce (mg·L-1) is the equilibrium concentration of boric acid; m (g) is the mass of the adsorbent; V (mL) is the volume of the solution.
2 Results and discussion
2.1 Characterization
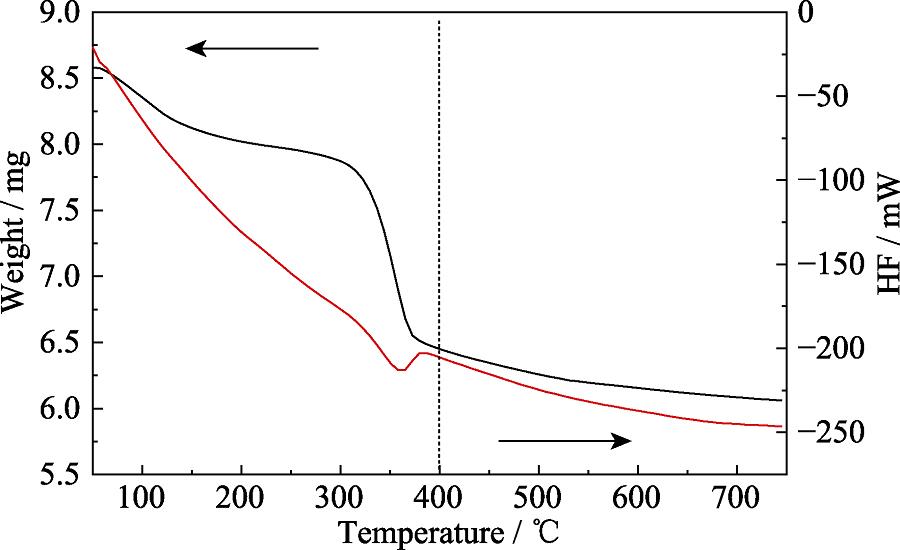
Fig. 1 shows the TG-DSC curve for the Mg-Al-Ce-HT precursor, which indicates a broad endothermic peak for Mg-Al-Ce and a calcination temperature from 300 ℃ to 400 ℃ with a corresponding mass loss in the TG curve. Meanwhile, the DSC curve shows a broad exothermic peak at 350 ℃, which corresponds to the dehydration of Mg-Al-Ce-HT to form the final hydrotalcite structure. The dehydration is attributed to the loss of bound water in Mg-Al-Ce-HT, leading to the change in the material’s structure and the formation of the hydrotalcite structure. At the temperature higher than 400 ℃, the structure tends to stabilize and do not change further. Therefore, 400 ℃ is considered as the optimum calcination temperature for Mg-Al-Ce-HT, and the material is used for all subsequent experiments.
![]()
Figure .TG-DSC curve of Mg-Al-Ce-HT precursor
To compare the adsorption performances of the materials and confirm their structures, we conducted XRD analyses of the materials before calcination (Mg-Al-Ce-HT precursor), before (Mg-Al-Ce-HT) and after (adsorbed Mg-Al-Ce-HT) adsorption. The XRD patterns of Mg-Al-Ce-HT precursor (a), Mg-Al-Ce-HT adsorbent (b), and adsorbed Mg-Al-Ce-HT material (c) are shown in Fig. 2. From the diffraction patterns, the (003), (006), (009), (018), (110), and (113) crystal planes are registered in (a) and (b) curves, and the results are in agreement with those in the literature [20], which confirms the formation of the hydrotalcite structure. Because Mg-Al-Ce precursor is the unheat-treated material, the free water and nitrate radical reduces the diffraction peak intensity. Upon calcination of material (b), the free water and nitrate radicals are removed, and the intensity of the diffraction peaks is strengthened. The diffraction patterns of the calcined material (b) indicate the characteristic diffraction peaks of metal oxides. The peaks at 2θ=28.68° and 47.68° (JCPDS 02-1306) correspond to cerium oxide, and those of aluminum oxide and magnesium oxide are observed at 2θ=33.20°, 56.50° (JCPDS 29-0063) and 2θ=38.14°, 62.08° (JCPDS 65-0467), respectively. In Fig. 2 (b), because of the calcination of the materials, a part of the material changed to metal oxide. Owing to the memory effects of hydrotalcite materials, the structure of the adsorbed material (c) resembles that before the calcination, and the crystal plane peaks are similar with those in the Fig. 2(a).
![]()
Figure .XRD patterns of Mg-Al-Ce precursor (a), Mg-Al-Ce-HT before adsorption (b), and Mg-Al-Ce-HT after adsorption(c)
FT-IR spectra of Mg-Al-Ce-HT precursor (a), the Mg-Al-Ce-HT material (b), and the adsorbed Mg-Al-Ce-HT material (c) are shown in Fig. 3. Compared to these curves, the structure of this material was stabilized. In the 3400-3650 cm-1 broad-band range, all curves display characteristic absorption bands, which are attributed to the stretching mode of the structural O-H groups in the metal hydroxide layer. At 1636.78 cm-1, the bending vibrations of the hydroxyl group O-H bonds are clearly observed. On the curves (a) and (c), a sharp peak locates at 3699.76 cm-1 which corresponds to the dissociated O-H vibration of residual water. The bands in the curve (b) at 1384.64 and 1456.47 cm-1 are attributed to the CO32- in the material. The metal-oxygen-metal stretching vibrations are found at 1048.12 cm-1. Owing to the weak interaction during adsorption, the peak corresponding to boron is not observed in thes spectra.
![]()
Figure .FT-IR spectra of Mg-Al-Ce-HT precursor (a); Mg-Al-Ce-HT materials (b) and adsorbed materials (c)
Scanning Electron Microscopy (SEM) images of Mg-Al-Ce-HT are shown in Fig. 4 (a) and indicate that Mg-Al-Ce-HT is composed of flaky shaped particles with irregular sizes (10-100 μm). Further, the samples does not have crystalline structures.
![]()
Figure .SEM images of Mg-Al-Ce-HT (a) and EDS analysis of Mg-Al-Ce-HT (b) and the corresponding EDS mappings of O (c), Mg (d), Ce (e), and Al (f) elements
Energy Dispersive Spectroscopy (EDS) analysis of Mg-Al-Ce-HT is shown in Fig. 4. The sample (b) has the same morphology as those of Mg-Al-Ce-HT (a), and the Fig. 4(c-f) showed that the O, Mg, Ce, and Al atoms are well-distributed in the materials, respectively. The ratio of abundances of these elements is 27.20% : 1.17% : 3.51%, which is in agreement with the proportion used for the synthesis. Furthermore, the presence of several oxygen atoms in this material indicates that it exists as metal oxide or hydrate. Combined with the results of FT-IR analysis, it is proved that the oxygen in the materials exists in the form of hydroxyl groups. The hydroxyl group plays an important role in boron removal.
In order to confirm the possible mechanism of boron removal in Mg-Al-Ce-HT, X-ray photoelectron spectroscopy (XPS) of Mg-Al-Ce samples was conducted, and the results are shown in Scheme 1 (b). From the patterns, the peaks for Mg 2p, Al 2p, Ce 3d, C 1s, and O 1s exist in the adsorbent. Furthermore, the pattern shows that the structure of the material is nearly unchanged in the adsorption process. In the materials subjected to adsorption, the boron peaks appear at 198 eV, which proves the successful adsorption of boron in these materials.
![]()
Figure .Schematic of the B(OH)3 adsorption process on the surface of Mg-Al-Ce-HT material(a), and XPS patterns of full elemental spectrogram (b)
The strong XPS peaks of Mg 2p, Al 2p, and Ce 3d in Mg-Al-Ce-HT particles before and after the adsorption display in Fig. 5. The Mg 2p, Al 2p, and Ce 3d peaks appear at 48.7, 73.4, and 881.3 eV, respectively, which indicate that the structure of Mg-Al-Ce-HT is nearly unchanged after the adsorption process, and the results were in good agreement with the XRD and FT-IR analyses.
![]()
Figure .XPS spectra of Mg 2p, Al 2p, Ce 3d, C 1s, and O 1s in Mg-Al-Ce-HT before and after adsorption
The C 1s and O 1s XPS spectra of Mg-Al-Ce-HT particles before and after adsorption are shown in Fig. 5. The strong peaks at 283.8 and 284.7 eV correspond to the C 1s spectrum and the carbon atoms of carbonate CO32- on the surface. The strong peaks at 528.5 eV correspond to the metal oxide (M-O), and the band energy of 529.7 and 531.2 eV represent the hydroxyl groups bonded to the metal (M-OH) and the oxygen of water (H2O), respectively. In contrast, the examination of the peaks before and after adsorption reveal that the CO32- disappears, and the amount of metal oxide increases, which suggests the participation of the -OH groups on the adsorbent surface in the boric acid adsorption.
With the hydration creating, when the pH of solution above 8.0, the -OH is massive produced and dispersed in the solution, and the H3BO3 (B(OH)3) gradually changes into B(OH)4- in solution[
In short, the driving forces for the adsorption reaction mainly depend on the reaction of the boric acid with the hydroxyl produced by hydration of the metal ions. Upon hydration of the metal ions in water, the hydroxyl groups on the surface of the metal are released, and the boric acid reacts with the hydroxyl groups adsorbed on the metals. Due to the hydration reaction, the dissociated hydroxyls in the solution increase gradually, and then the boric acid reacts with the dissociated hydroxyls directly, leading to the inhibition of the adsorption of boric acid on the materials.
2.2 Effect of initial pH and mechanism of adsorption
The initial pH of boric acid considerably affects the adsorption behavior. In order to investigate the effect of initial pH on boron removal, we carried out experiments at different pH. The experimental conditions were the same as those for the adsorption experiment, but the initial pH was set in the 3.0-12.0 range. The equilibrium amounts of boron adsorbed onto the Mg-Al-Ce-HT are plotted in Fig. 6(a), which show that at the pH range of 3.0 to 8.0, the values of Cs for Mg-Al-Ce-HT are almost constant around 21 mg·g-1. At pH above 8.0, Cs decreases with increasing pH, and at pH above 12.0, the Cs of the adsorbent drops to 2 mg·g-1. At the boron concentration below 216.68 mg·L-1, it often exists in the B(OH)3 or B(OH)4- forms[
![]()
Figure .Effect of initial pH on adsorption efficiency (a) and the relationship between the conversion of H3BO3 and B(OH)4- (b)
The relationship between the conversion of these two materials is shown in Fig. 6(b). With the increase of pH, the concentration of B(OH)3 reduces and that of B(OH)4- increases. In this experiment, at the high initial pH, the B(OH)3 in the solutions becomes B(OH) 4-. Because the massive B(OH)4- restrains the adsorption process and reduces the adsorption capacity. Therefore, the boric acid species removed in the adsorption process existed in the B(OH)3 form.
2.3 Effect of amount adsorbent
In order to investigate the effect of adsorbent content, a series of experiments were conducted. The experimental conditions were the same as those of the adsorption experiment, but the adsorbent dosage varied from 50 mg to 350 mg. The effect of adsorbent content is shown as Fig. 7, and the results show that the adsorption capacity decreases with the increase in the adsorbent content, and the adsorption percentages increase under the same condition. At the low adsorbent content, the amount of effective adsorption sites in the system is low, which causes the lower levels of adsorption percentages and the higher levels of adsorbent capacity. With the increase of the adsorbent content, the effective adsorption sites gradually increases, leading to the decrease of the adsorption capacity from 35 to 15 mg·g-1 and the increase of the adsorption percentages from 30% to 90%. At 200 mg of the adsorbent capacity, the system reaches the adsorption equilibrium. Therefore, 200 mg is considered as the optimum adsorbent content for boric acid and was used for all subsequent experiments.
![]()
Figure .Effect of adsorbents, adsorption percentages, and adsorption capacity
2.4 Effect of initial concentration
In order to investigate the effect of the initial concentration of boric acid on boron removal, we conducted experiments at different concentrations. The effect of initial boric acid concentrations was investigated from 20 to 200 mg·L-1 at 298 K. As shown in Fig. 8(a), the amounts of boron adsorbed on Mg-Al-Ce-HT are significantly affected by the initial feed concentrations of boron. Further, the adsorbent content increases with the increase in the initial concentration and reaches the adsorption equilibrium at 140.00 mg·L-1, and the curve maintained balance with the increase of the initial boric acid concentration. The reasons for this phenomenon are as follows: At the initial low concentration of boric acid, the effect of the adsorption sites is excessive in the system. With the increase of the boric acid concentration, the fraction of concentration and adsorption sites increase, and the adsorption efficiency also increases. When the adsorbent reaches the adsorption saturation, the efficiency did not change further.
![]()
Figure .Effect of initial concentration of boric acid (a) and the Langmuir model (b)
The maximum adsorption capacity is confirmed by Langmuir model fitting, and the result displays in Fig. 8(b). The fitting data reveals that the maximum adsorption capacity is 32.52 mg·g-1. The correlation coefficient of the fitting data is 0.9271, which is within the permitted range of errors.
2.5 Effect of contact time and sorption kinetics
The effect of the contact time was explored next, and different contact times between the adsorbent and boric acid solutions were examined, and the experimental curve is shown in Fig. 9. In the first 100 min, with the increase of the contact time, the adsorption capacity increases quickly. Then, the adsorption efficiency gradually weakenes, and at 160 min, the adsorption reaches the equilibrium, and the adsorption capacity increases slowly. The reason for this phenomenon is the particular ratio of the adsorbent and concentration of boric acid. At the beginning of the adsorption, a high concentration of boric acid is present in the solution, and the adsorbent concentration is also massive in the system. Therefore, the adsorption process is fast at the beginning, and with the increase in adsorption, the adsorption capacity gradually reaches saturation, and the adsorption speed gradually slowed down. When the adsorption reaches the equilibrium, the adsorption capacity remains unchanged with increasing contact time.
![]()
Figure .Effect of contact time on boron adsorption and kinetics model
The contact time data is fitted by pseudo-first-order and pseudo-second-order adsorption kinetics models. The equations for these models are described as follows:
The results show that the pseudo-second-order correlation coefficient (R2=0.9133) is higher than the pseudo-first-order correlation coefficient (R2=0.7548). Therefore, the pseudo-second-order kinetics model is best fitted for the adsorption.
2.6 Effect of temperature and adsorption isotherms
The thermodynamic parameters for the adsorption of boron on Mg-Al-Ce-HT were calculated. The Gibbs free energy change (ΔG, kJ·mol-1), enthalpy (ΔH, kJ·mol-1), and entropy change (ΔS, kJ·mol-1·K-1) were calculated according to the following equations:
Where R (8.314 kJ·mol-1) is the universal gas constant; T is the temperature of the experimental process in Kelvin; Kc is the distribution coefficient by the Henry model. The ΔG, ΔH, and ΔS can be obtained using Van’s Hoff plot of lnKcvs. 1/T (Fig. 10). The data obtained for ΔG, ΔH, ΔS, and the fitting R-square are shown in Table 1. Owing to the positive value obtained for ΔG, the adsorption process on Mg-Al-Ce-HT for the removal of boron is determined to be a non-spontaneous endothermic process. The ΔH in the thermodynamic parameters is positive, and the boron adsorption capacity increases with the increase in the temperature, which confirms that the adsorption is endothermic.
![]()
Figure .Van’s Hoff plot of boron adsorption on Mg-Al-Ce-HT
| Δ | Δ | Δ | ||
|---|---|---|---|---|
| 308 | 12.16 | 89.90 | 0.25 | 0.99 |
| 313 | 10.90 | |||
| 323 | 8.37 |
Table 1.
Thermodynamic parameters for boron adsorption on Mg-Al-Ce-HT
3 Conclusion
The Mg-Al-Ce-HT with high boric acid adsorption performance was successfully prepared. SEM and EDS analyses show the patterns of Mg-Al-Ce-HT and provide the distribution of Mg, Al, Ce, and O. The XPS results reveal that boron is fully adsorbed into the materials. We explored the effects of initial pH, initial boric acid concentration, temperature, and contact time on boron removal. At initial pH greater than 8.0, the adsorption capacity stabilize at the maximum value. The adsorption capacity decreases, and the adsorption percentages increases. The adjusted adsorbent content for boron removal is determined to be 200 mg. The initial concentration of boric acid is another key factor for efficient boron removal. As the initial concentration of boric acid increases, the adsorption capacity increases until the initial concentration reaches a certain extent, beyond which the adsorption capacity stabilizes. The optimal initial concentration of boric acid is 100.00 mg·g-1, and the adsorption reaches the equilibrium at 160 min. The results fit best the pseudo-second-order adsorption kinetics model for the adsorption process.
References
[1] M TANAKA, T FUJIWARA. Physiological roles and transport mechanisms of boron: perspectives from plants. Pflügers Archiv- European Journal of Physiology, 456, 671-677(2008).
[2] G BLEVINS D, M LUKASZEWSKI K. Proposed physiologic functions of boron in plants pertinent to animal and human metabolism. Environmental Health Perspectives, 102, 31-33(1994).
[3] Y DUYDU, S AYDIN, U UNDEGER et al. Is boric acid toxic to reproduction in humans?assessment of the animal reproductive toxicity data and epidemiological study results. Current Drug Delivery, 13, 324-329(2016).
[4] N GEFFEN, R SEMIAT, S EISEN M et al. Boron removal from water by complexation to polyol compounds. Journal of Membrane Science, 286, 45-51(2006).
[5] O C TÜRKER, T BARAN. Evaluation and application of an innovative method based on various chitosan composites and Lemna gibba for boron removal from drinking water. Carbohydrate Polymers, 166, 209-218(2017).
[6] A HARADA, T TAKAGI, S KATAOKA et al. Boron adsorption mechanism on polyvinyl alcohol. Adsorption-journal of the International Adsorption Society, 17, 171-178(2011).
[7] E KIR, B GURLER, A GULEC. Boron removal from aqueous solution by using plasma-modified and unmodified anion-exchange membranes. Desalination, 267, 114-117(2011).
[8] A SARI M, S CHELLAM. Mechanisms of boron removal from hydraulic fracturing wastewater by aluminum electrocoagulation. Journal of Colloid & Interface Science, 458, 103-111(2015).
[9] M ARIFFIN, A HASSAN, S HUI L et al. Removal of boron from industrial wastewater by chitosan
[10] E HUERTAS, M HERZBERG, G ORON et al. Influence of biofouling on boron removal by nanofiltration and reverse osmosis membranes. Journal of Membrane Science, 318, 264-270(2008).
[11] Q PING, I M ABU-REESH, Z HE. Boron removal from saline water by a microbial desalination cell integrated with donnan dialysis. Desalination,, 376, 55-61(2015).
[12] D WAITE T, A DAVIS J, E PAYNE T et al. Uranium(VI) adsorption to ferrihydrite: application of a surface complexation model. Geochimica Et Cosmochimica Acta, 58, 5465-5478(1994).
[13] B DARWISH N, V KOCHKODAN, N HILAL. Boron removal from water with fractionized Amberlite IRA743 resin. Desalination, 370, 1-6(2015).
[14] I POLOWCZYK, J ULATOWSKA, T KOŹLECKI et al. Studies on removal of boron from aqueous solution by fly ash agglomerates. Desalination, 310, 93-101(2013).
[15] J LI, P CAO, P NI et al. Enhanced boron removal from metallurgical grade silicon by the slag refining method with the addition of tin. Separation Science & Technology, 51, 1598-1603(2016).
[16] A WANI M. Adsorption and desorption of boron as influenced by soil properties in temperate soils of lesser himalayas. Communications in Soil Science & Plant Analysis, 46, 683-698(2015).
[17] T KAMEDA, J OBA, T YOSHIOKA. New treatment method for boron in aqueous solutions using Mg-Al layered double hydroxide: kinetics and equilibrium studies. Journal of Hazardous Materials, 293, 54-63(2015).
[18] N AY A, B ZÜMREOGLU-KARAN, A TEMEL. Boron removal by hydrotalcite-like, carbonate-free Mg-Al-NO3-LDH and a rationale on the mechanism. Microporous & Mesoporous Materials, 98, 1-5(2007).
[19] J LYU, Z ZENG, N ZHANG et al. Pyrocatechol-modified resins for boron recovery from water: synthesis, adsorption and isotopic separation studies. Reactive & Functional Polymers, 112, 1-8(2017).
[20] E RODRIGUES, P PEREIRA, T MARTINS et al. Novel rare earth (Ce and La) hydrotalcite like material: synthesis and characterization. Materials Letters, 78, 195-198(2012).
[21] L THEISS F, A AYOKO G, L FROST R. Removal of boron species by layered double hydroxides: a review. Journal of Colloid & Interface Science, 402, B114-121(2013).
[22] B WANG, X GUO, P BAI. Removal technology of boron dissolved in aqueous solutions - a review. Colloids & Surfaces A Physicochemical & Engineering Aspects, 444, 338-344(2014).


Set citation alerts for the article
Please enter your email address

© Copyright 2018-2021 | Chinese Laser Press. All Rights Reserved 沪ICP备15018463号-20