• Photonics Research
  • Vol. 10, Issue 7, 1594 (2022)
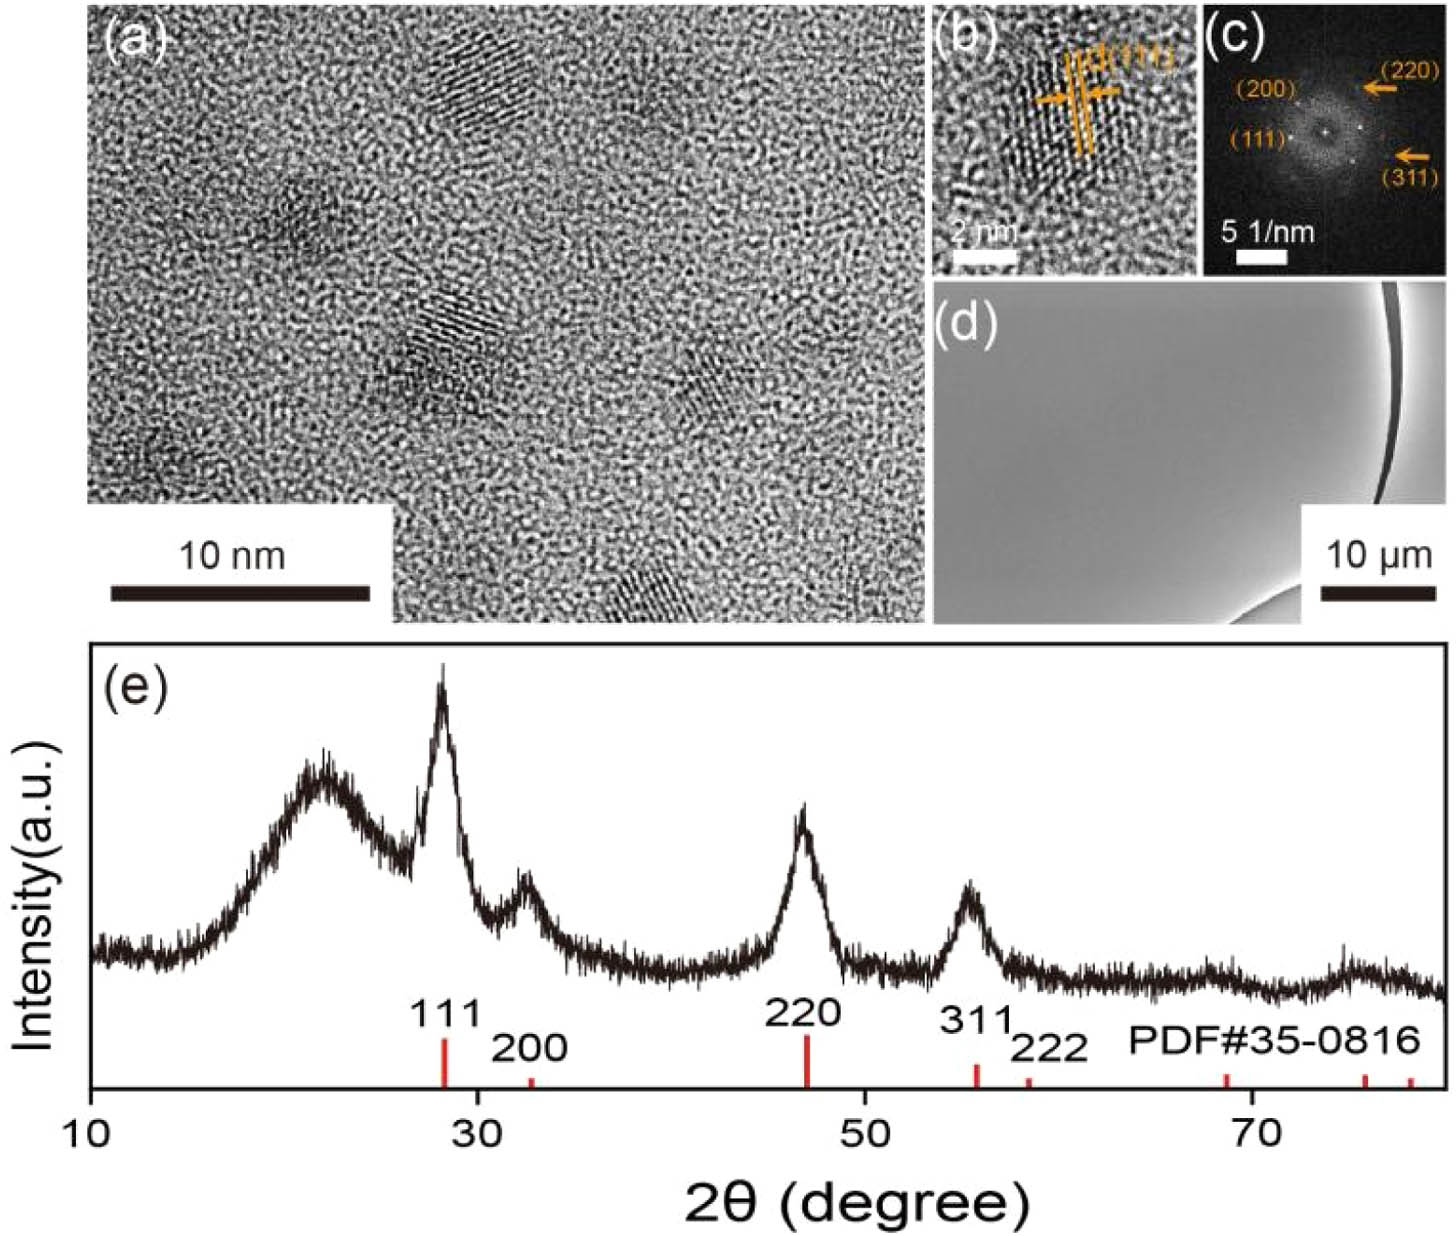
Limin Jin1、4、*, Zhuo Liu1, Yuqi Zhang1, Yunkai Wu1, Yilin Liu1, Huachun Deng1, Qinghai Song1、2、3、5、*, and Shumin Xiao1、2、3、6、*
Author Affiliations
  • 1Ministry of Industry and Information Technology Key Laboratory of Micro-Nano Optoelectronic Information System, Harbin Institute of Technology, Shenzhen 518055, China
  • 2Collaborative Innovation Center of Extreme Optics, Shanxi University, Taiyuan 030006, China
  • 3Pengcheng Laboratory, Shenzhen 518055, China
  • 4e-mail: jinlimin@hit.edu.cn
  • 5e-mail: qinghai.song@hit.edu.cn
  • 6e-mail: shumin.xiao@hit.edu.cn
  • show less
    DOI: 10.1364/PRJ.456381 Cite this Article Set citation alerts
    Limin Jin, Zhuo Liu, Yuqi Zhang, Yunkai Wu, Yilin Liu, Huachun Deng, Qinghai Song, Shumin Xiao. Lanthanide-doped nanocrystals in high-Q microtoroids for stable on-chip white-light lasers[J]. Photonics Research, 2022, 10(7): 1594 Copy Citation Text show less
    Characterization of CaF2:Yb35Tm1.5Er0.5-SiO2 film. (a) TEM image, (b) HRTEM image, and (c) FFT pattern of (b). (d) Top view SEM image of the synthesized glass film. (e) XRD spectrum.
    Fig. 1. Characterization of CaF2:Yb35Tm1.5Er0.5-SiO2 film. (a) TEM image, (b) HRTEM image, and (c) FFT pattern of (b). (d) Top view SEM image of the synthesized glass film. (e) XRD spectrum.
    Structural characterization of CaF2:Yb35Tm1.5Er0.5-SiO2 glass films. (a) EDS, (b) transmission, and (c) absorption spectra of the glass film obtained from the optimized conditions. The inset in (b) shows the optical image of the corresponding bulk glass. (d) TG/DTA curves for the xerogel treated in air. (e) XRD patterns of the xerogels treated at different temperatures.
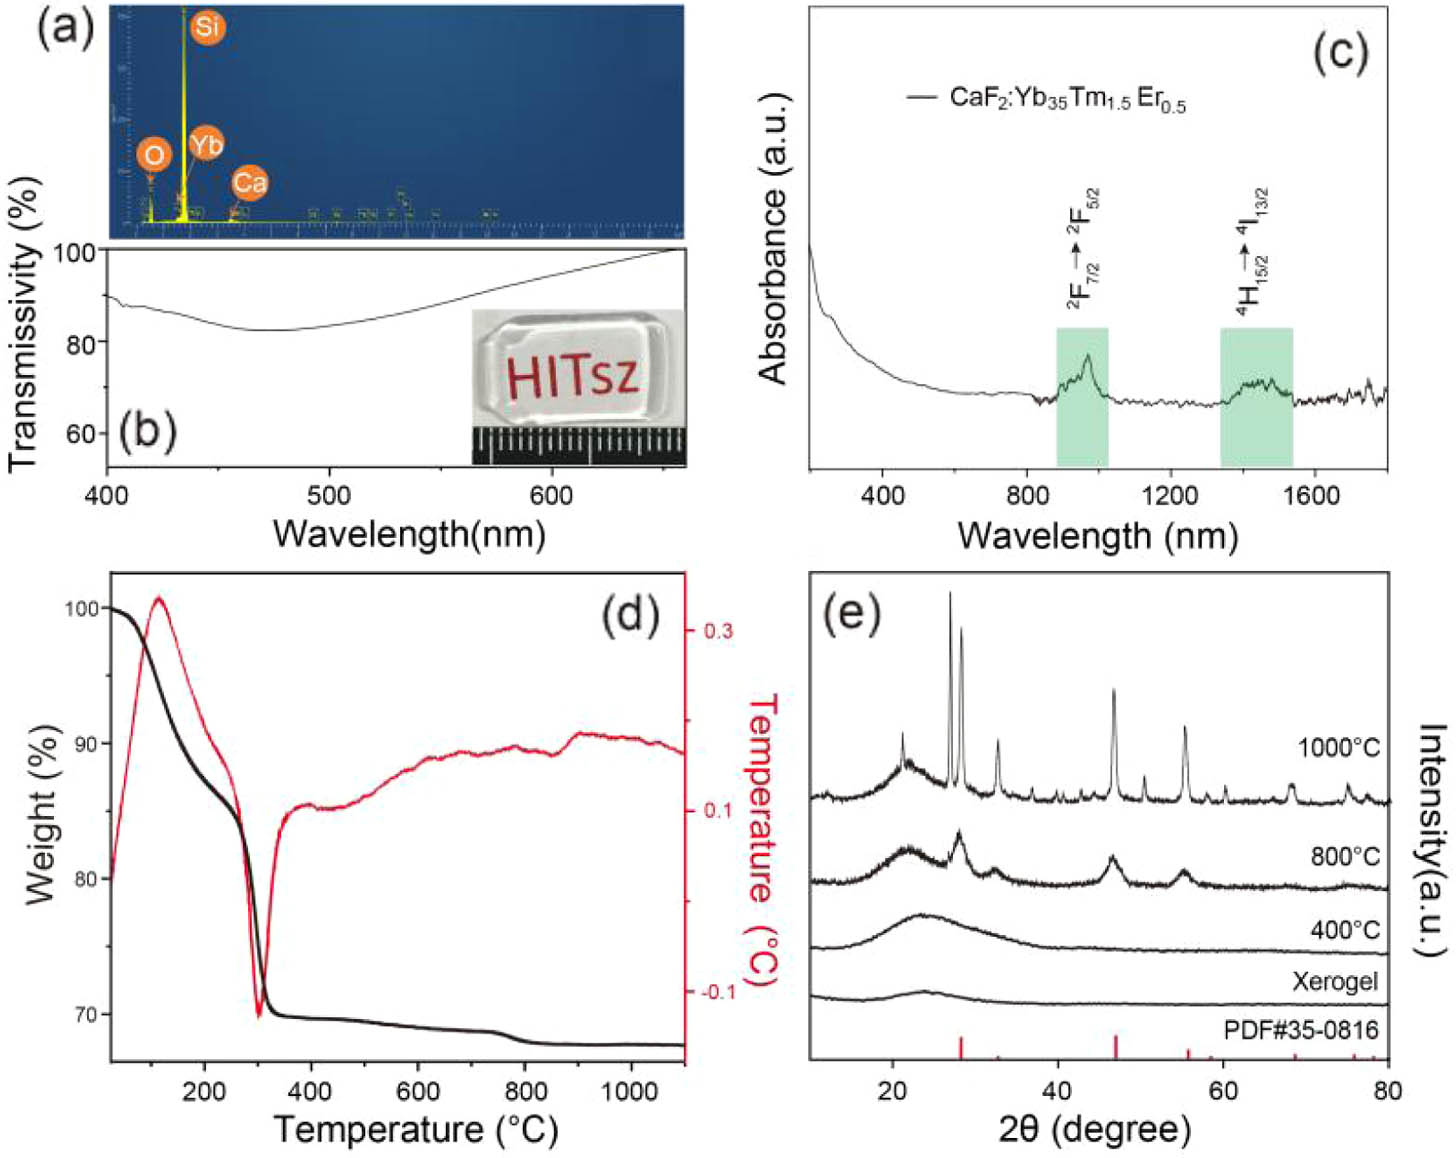
    Fig. 2. Structural characterization of CaF2:Yb35Tm1.5Er0.5-SiO2 glass films. (a) EDS, (b) transmission, and (c) absorption spectra of the glass film obtained from the optimized conditions. The inset in (b) shows the optical image of the corresponding bulk glass. (d) TG/DTA curves for the xerogel treated in air. (e) XRD patterns of the xerogels treated at different temperatures.
    Crystallization characteristics. TEM images of the films annealed at (a) room temperature, (b) 400°C, (c) 800°C, and (d) 1000°C, respectively. Size distribution of the observed NCs by counting more than 100 particles is also indicated in (c) and (d). The scale bars are 20, 20, 20, and 50 nm, respectively.
    Fig. 3. Crystallization characteristics. TEM images of the films annealed at (a) room temperature, (b) 400°C, (c) 800°C, and (d) 1000°C, respectively. Size distribution of the observed NCs by counting more than 100 particles is also indicated in (c) and (d). The scale bars are 20, 20, 20, and 50 nm, respectively.
    Evolution of surface roughness. Photographs of CaF2:Yb35Tm1.5Er0.5-SiO2 glass films under different heat treatment before cooling down to room temperature. (a) 25°C–800°C (at a rate of 1°C min−1). (b) 25°C–260°C (0.5°C min−1), staying at 260°C for 20 min, and 260°C–800°C (5°C min−1). (c) 25°C–260°C (0.5°C min−1), staying at 260°C for 20 min, 260°C–400°C (1°C min−1), and 400°C–800°C (5°C min−1). (d) 25°C–110°C (0.25°C min−1) and staying at 110°C for 20 min, 110°C–260°C (0.5°C min−1), 260°C–400°C (1°C min−1), and 400°C–800°C (5°C min−1).
    Fig. 4. Evolution of surface roughness. Photographs of CaF2:Yb35Tm1.5Er0.5-SiO2 glass films under different heat treatment before cooling down to room temperature. (a) 25°C–800°C (at a rate of 1°Cmin1). (b) 25°C–260°C (0.5°Cmin1), staying at 260°C for 20 min, and 260°C–800°C (5°Cmin1). (c) 25°C–260°C (0.5°Cmin1), staying at 260°C for 20 min, 260°C–400°C (1°Cmin1), and 400°C–800°C (5°Cmin1). (d) 25°C–110°C (0.25°Cmin1) and staying at 110°C for 20 min, 110°C–260°C (0.5°Cmin1), 260°C–400°C (1°Cmin1), and 400°C–800°C (5°Cmin1).
    Optical characterization of CaF2:Ln3+ NCs-doped glass film. (a) Simplified energy level diagram of Er3+ and Tm3+ ions showing the radiative recombination processes responsible for the observed RGB light. (b) Emission spectra of the NCs-doped glass films under CW 980 nm irradiation at a power density of 20 W cm−2. The insets give the corresponding photographs of the excited bulk glasses.
    Fig. 5. Optical characterization of CaF2:Ln3+ NCs-doped glass film. (a) Simplified energy level diagram of Er3+ and Tm3+ ions showing the radiative recombination processes responsible for the observed RGB light. (b) Emission spectra of the NCs-doped glass films under CW 980 nm irradiation at a power density of 20  Wcm2. The insets give the corresponding photographs of the excited bulk glasses.
    White and full-color tunable photoluminescence. Emission spectra from glass films containing (a) Yb30-Tmx (x=0.5–2.5), (b) Yby-Tm1.5 (y=25–45), (c) Ybz-Er1 (z=15–95), and (e) Yb30-Tm1.5-Erw (w=0.1–2.0) under the excitation of a CW 980 nm laser. The pumping powers are (a), (b) 58 W cm−2 and (c)–(f) 20 W cm−2, respectively. (d) The evolution of integrated intensity of red and green color bands, as well as red to green ratio as a function of Yb3+ doping concentration in (c). (f) Chromaticity diagram showing the achievable color space from CaF2:Ln3+ luminescent glass films, compared with the sRGB benchmark. The indicated color coordinates are extracted from the spectra in (a), (b), (c), (e). The color photographs are the excited Yb35-Tm1.5 (blue), Yb35-Tm1.5-Er0.5 (white), Yb15-Er1 (green), Yb35-Er1 (yellow), and Yb95-Er1 (red) co-doped samples, respectively.
    Fig. 6. White and full-color tunable photoluminescence. Emission spectra from glass films containing (a) Yb30-Tmx (x=0.52.5), (b) Yby-Tm1.5 (y=2545), (c) Ybz-Er1 (z=1595), and (e) Yb30-Tm1.5-Erw (w=0.12.0) under the excitation of a CW 980 nm laser. The pumping powers are (a), (b) 58  Wcm2 and (c)–(f) 20  Wcm2, respectively. (d) The evolution of integrated intensity of red and green color bands, as well as red to green ratio as a function of Yb3+ doping concentration in (c). (f) Chromaticity diagram showing the achievable color space from CaF2:Ln3+ luminescent glass films, compared with the sRGB benchmark. The indicated color coordinates are extracted from the spectra in (a), (b), (c), (e). The color photographs are the excited Yb35-Tm1.5 (blue), Yb35-Tm1.5-Er0.5 (white), Yb15-Er1 (green), Yb35-Er1 (yellow), and Yb95-Er1 (red) co-doped samples, respectively.
    Fabrication of chip-scale CaF2:Yb35Tm1.5Er0.5-SiO2 microtoroid device. (a) Schematic diagram illustrating the typical fabrication procedures. (b) Top view and (c) oblique view SEM images of an individual microtoroid (i.e., 117 μm in diameter). (d) Top view SEM image of the microtoroids array. The scale bars of (b)–(d) are 20, 20, and 200 μm, respectively.
    Fig. 7. Fabrication of chip-scale CaF2:Yb35Tm1.5Er0.5-SiO2 microtoroid device. (a) Schematic diagram illustrating the typical fabrication procedures. (b) Top view and (c) oblique view SEM images of an individual microtoroid (i.e., 117 μm in diameter). (d) Top view SEM image of the microtoroids array. The scale bars of (b)–(d) are 20, 20, and 200 μm, respectively.
    Pure SiO2 microdisks before the reflow process. (a) Top view and (b) oblique view SEM images of an individual microdisk. (c) Top view SEM image of the microdisks array. The scale bars are (a), (b) 40 μm and (c) 600 μm, respectively. The exact diameter of each microdisk is found to be around 120 μm.
    Fig. 8. Pure SiO2 microdisks before the reflow process. (a) Top view and (b) oblique view SEM images of an individual microdisk. (c) Top view SEM image of the microdisks array. The scale bars are (a), (b) 40 μm and (c) 600 μm, respectively. The exact diameter of each microdisk is found to be around 120 μm.
    Upconversion lasing characterization of CaF2:Yb35Tm1.5Er0.5-SiO2 microtoroid. (a) Dependence of the cavity Q factor on the coating thickness. The insets give the testing setup and the representative transmission spectra for Q factor measurement. (b) Light-light curves for RGB emissions under the excitation of a 980 nm pulsed laser. (c)–(e) Plots of RGB emission spectra versus different power density. The diameter of the microtoroid is around 86 μm.
    Fig. 9. Upconversion lasing characterization of CaF2:Yb35Tm1.5Er0.5-SiO2 microtoroid. (a) Dependence of the cavity Q factor on the coating thickness. The insets give the testing setup and the representative transmission spectra for Q factor measurement. (b) Light-light curves for RGB emissions under the excitation of a 980 nm pulsed laser. (c)–(e) Plots of RGB emission spectra versus different power density. The diameter of the microtoroid is around 86 μm.
    White-light lasing characterization of CaF2:Yb35Tm1.5Er0.5-SiO2 microtoroid. (a) Plots of Pth and 1/Δλ extracted from the RGB emissions versus d of the microtoroids. The error bars stand for the standard deviations from three sets of measurements. (b) Simultaneous RGB emission spectra of each microtoroid with d equal to 56, 86, and 117 μm, respectively, and the corresponding (c) color coordinates in the CIE1931(x, y) chromaticity diagram. (d) CIE1931(x, y) chromaticity diagram extracted from the emission spectra of an excited 86 μm microtoroid at different power densities (i.e., 2.25, 2.4, and 2.5 mJ cm−2). The insets give the enlarged drawing of the selected area in (c) and (d), respectively.
    Fig. 10. White-light lasing characterization of CaF2:Yb35Tm1.5Er0.5-SiO2 microtoroid. (a) Plots of Pth and 1/Δλ extracted from the RGB emissions versus d of the microtoroids. The error bars stand for the standard deviations from three sets of measurements. (b) Simultaneous RGB emission spectra of each microtoroid with d equal to 56, 86, and 117 μm, respectively, and the corresponding (c) color coordinates in the CIE1931(x, y) chromaticity diagram. (d) CIE1931(x, y) chromaticity diagram extracted from the emission spectra of an excited 86 μm microtoroid at different power densities (i.e., 2.25, 2.4, and 2.5  mJcm2). The insets give the enlarged drawing of the selected area in (c) and (d), respectively.
    Limin Jin, Zhuo Liu, Yuqi Zhang, Yunkai Wu, Yilin Liu, Huachun Deng, Qinghai Song, Shumin Xiao. Lanthanide-doped nanocrystals in high-Q microtoroids for stable on-chip white-light lasers[J]. Photonics Research, 2022, 10(7): 1594
    Download Citation