• Photonics Research
  • Vol. 10, Issue 7, 1594 (2022)
Limin Jin1、4、*, Zhuo Liu1, Yuqi Zhang1, Yunkai Wu1, Yilin Liu1, Huachun Deng1, Qinghai Song1、2、3、5、*, and Shumin Xiao1、2、3、6、*
Author Affiliations
  • 1Ministry of Industry and Information Technology Key Laboratory of Micro-Nano Optoelectronic Information System, Harbin Institute of Technology, Shenzhen 518055, China
  • 2Collaborative Innovation Center of Extreme Optics, Shanxi University, Taiyuan 030006, China
  • 3Pengcheng Laboratory, Shenzhen 518055, China
  • 4e-mail: jinlimin@hit.edu.cn
  • 5e-mail: qinghai.song@hit.edu.cn
  • 6e-mail: shumin.xiao@hit.edu.cn
  • show less
    DOI: 10.1364/PRJ.456381 Cite this Article Set citation alerts
    Limin Jin, Zhuo Liu, Yuqi Zhang, Yunkai Wu, Yilin Liu, Huachun Deng, Qinghai Song, Shumin Xiao. Lanthanide-doped nanocrystals in high-Q microtoroids for stable on-chip white-light lasers[J]. Photonics Research, 2022, 10(7): 1594 Copy Citation Text show less

    Abstract

    The plentiful energy states of lanthanide (Ln3+)-doped nanomaterials make them very promising for on-chip integrated white-light lasers. Despite the rapid progresses, the Ln3+-based white upconversion emissions are strongly restricted by their low upconversion quantum efficiency and the color stability. Herein, we combine the CaF2:Yb35Tm1.5Er0.5 nanocrystals and the high-Q microtoroids, and experimentally demonstrate the chip-integrated stable white-light laser. By optimizing the sizes, density, and distributions of Ln3+-doped nanocrystals, the Q factors of Ln3+-doped microtoroids are maintained as high as 5×10⁵. The strong light matter interaction in high-Q microtoroids greatly enhances the upconversion emission and dramatically reduces the laser thresholds at 652 nm, 545 nm, and 475 nm to similarly low values (1.892.10 mJ cm-2). Consequently, robust white-light microlaser has been experimentally achieved from a single microtoroid. This research has paved a solid step toward the chip-scale integrated broadband microlasers.

    1. INTRODUCTION

    On-chip integrated multicolor microlasers have been intensively studied owing to their practical applications ranging from miniaturized coherent light source, optical sensing, to visible light communication [17]. Compared with the combination of several microlasers, the white-light microlaser from a single nanomaterial is more attractive for on-chip integration [816]. In 2015, Fan et al. reported a monolithic white-light laser by parallelly combining ZnCdSSe-based segments into the same microcrystal [8]. Soon after, multicolor microlasers were widely observed in various systems, e.g., V2C-based quantum dots, luminescent polymers, organic dyes-doped polymer, and liquid crystals [914]. Despite the continuous success, these white-light microlasers are either simple compositions of parallel microlasers or generated by the reabsorption and the re-emission. From the point view of practical applications, these multicolor microlasers usually come from different locations and the eventual white colors are strongly dependent on the excitation density.

    Benefiting from their intrinsic features of plentiful energy levels and long decay lifetimes, lanthanide (Ln3+) ions have shown their ability of photon emission across the entire ultraviolet-visible (UV-vis) spectrum [1722]. Two main approaches have been proposed to utilize the characteristics of Ln3+ in on-chip lasing actions [2329]. The first one is the combination of Ln3+ ions with on-chip integrated microcavities with ultrahigh quality (Q) factors, e.g., microtoroids [2329]. By preserving Q factors at 107, on-chip integrated microlasers have been successfully demonstrated at near-infrared, green, and blue light wavelengths [2327]. Nevertheless, the lasing performance at the short wavelength is highly constrained by its low doping concentration, small absorption cross section, and large nonradiative relaxation loss due to the direct interaction between Ln3+ ions and silica matrix [23,24]. Recently, the core-shell structures [22,3033] have been developed to tackle these problems and improve the lasing actions [17,3436]. However, the size of upconversion nanocrystals (UCNCs) is relatively large, introducing strong scattering loss and constraining the intrinsic Q factors of Ln3+-based microresonators. Therefore, the development of stable white-light lasers is facing a severe challenge of the trade-off between high doping concentration and high-Q microcavity. Herein, by the introduction of cunning CaF2 NCs and the controlled growth of Ln3+-doped NCs, we experimentally demonstrate the high-Q UCNCs-doped microtoroid. The high-Q factors improve the blue, green, and red lasers to similar thresholds, resulting in stable white-light microlasers.

    2. RESULTS AND DISCUSSION

    The controlled growth of CaF2:Yb35Tm1.5Er0.5 UCNCs in the silica film was implemented through a solgel technique followed by a spin-coating operation (see Section 4) [37,38]. The doping concentration of Ln3+ ions is deduced from the stoichiometric amounts of precursors in the fabrication process. Note that the efficient CaF2 host [39,40] and CMOS-compatible SiO2 matrix [4144] were chosen for their similar group refractive index values. Figure 1 shows the structural characterization of UCNCs-doped silica glass film with a thickness of around 630 nm. This nanofilm obtained from the optimized growth conditions exhibits an average variation in the vertical direction of less than 20 nm. The transmission electron microscopy (TEM) image in Fig. 1(a) reveals that NCs with an average size of 4.3 nm were uniformly separated in the silica glass matrix. The high-resolution TEM image [HRTEM, Fig. 1(b)] and the corresponding fast Fourier transforms [FFTs, Fig. 1(c)] confirm the single-crystalline structure of NCs, demonstrating that CaF2 crystallized with (111) preferred orientation in the silica glass matrix [39,40,45]. This is consistent with the X-ray diffraction (XRD) data in Fig. 1(e). Indeed, four diffraction peaks due to CaF2 (JCPDS card #35-0816) with a pure cubic phase can be observed from the XRD pattern except for a broad band centered at 22°, which can be ascribed to amorphous SiO2. Moreover, there are no obvious cracks and roughness even from the scanning electron microscopy [SEM, Fig. 1(d)] result. Such ultrasmooth surface of glass film would determine the Q factor of the resultant UCNCs-doped microtoroid cavity [46].

    Characterization of CaF2:Yb35Tm1.5Er0.5-SiO2 film. (a) TEM image, (b) HRTEM image, and (c) FFT pattern of (b). (d) Top view SEM image of the synthesized glass film. (e) XRD spectrum.

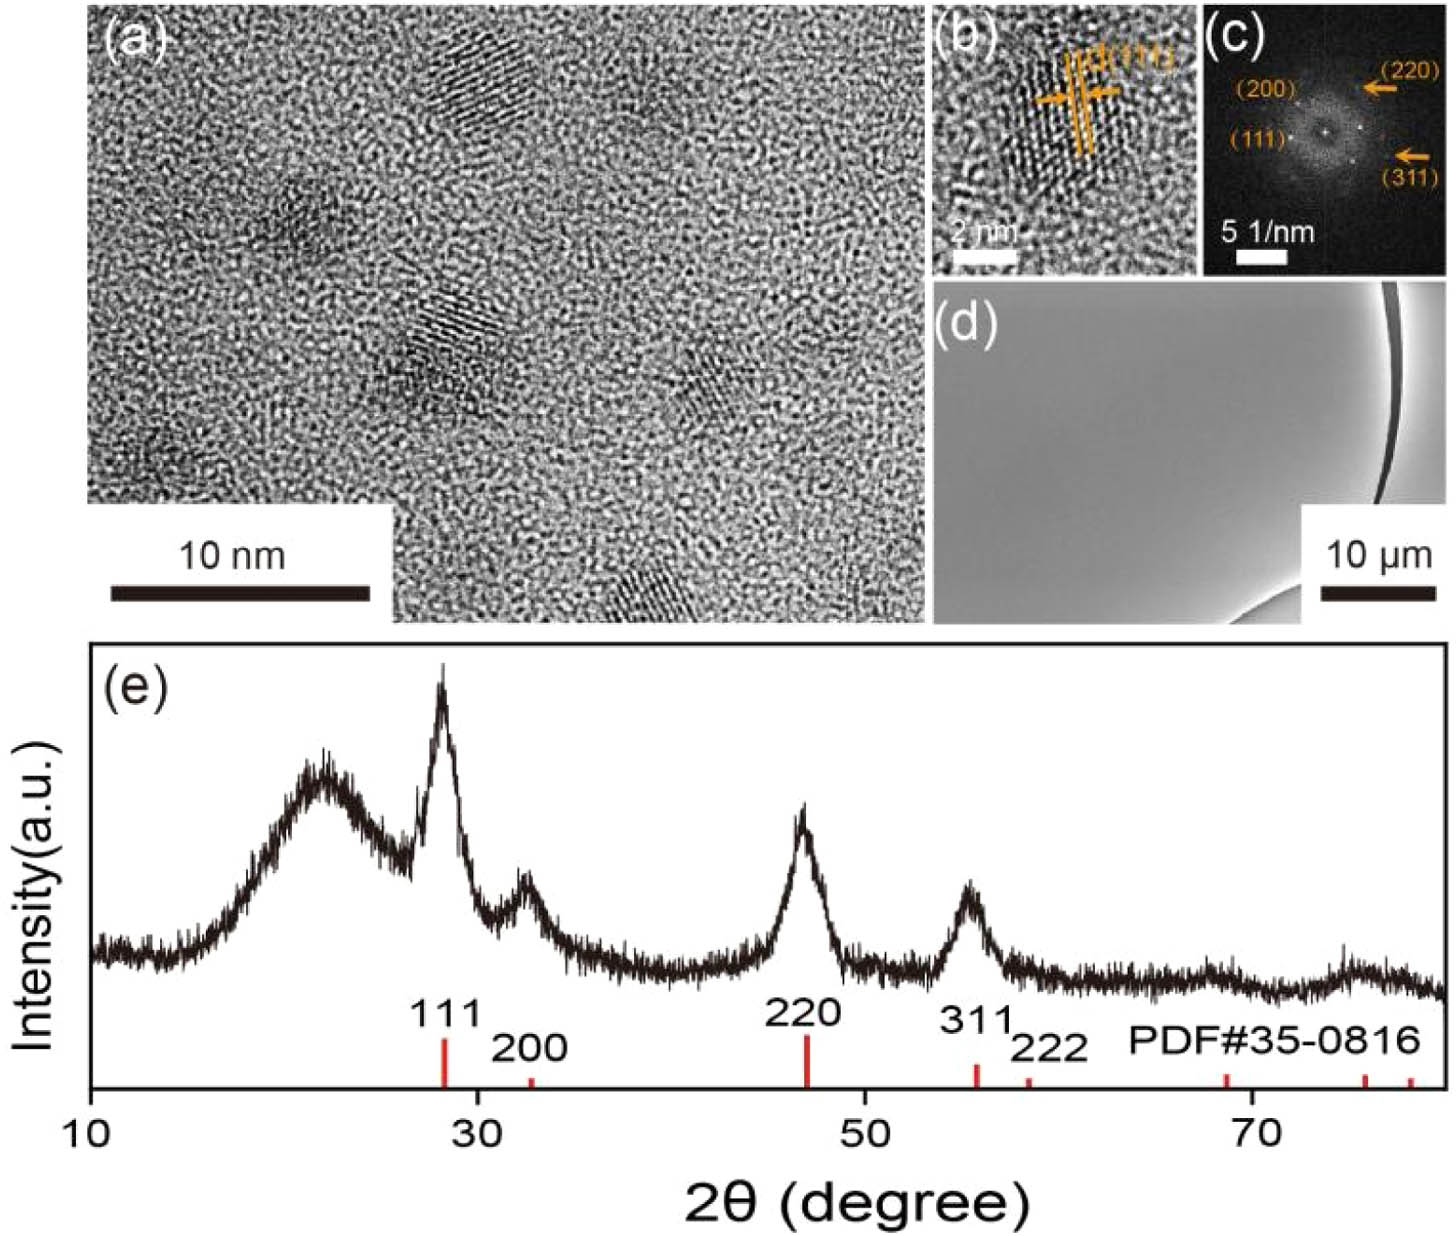
    Figure 1.Characterization of CaF2:Yb35Tm1.5Er0.5-SiO2 film. (a) TEM image, (b) HRTEM image, and (c) FFT pattern of (b). (d) Top view SEM image of the synthesized glass film. (e) XRD spectrum.

    The chemical composition of the glass film can be verified according to the energy-dispersive X-ray spectroscopy (EDS), UV-vis, and photoluminescence (PL) results. Only Si, O, Ca, and Yb elements can be detected from the EDS measurement [Fig. 2(a)]; however, there are characteristic emitting peaks associated with Tm3+ and Er3+ ions from the PL spectra later shown in Fig. 5(b). In addition, two broad absorption peaks [Fig. 2(c)] were observed at around 973 and 1520 nm, which can be attributed to the F27/2F5/22 transition of Yb3+ ions, and the I15/24I13/24 transition of Er3+ ions, respectively. No second phase can be identified from the XRD pattern of the glass film after doping Ln3+ (i.e., Yb3+, Tm3+, and Er3+) ions. This clearly suggests the successful incorporation of Ln3+ ions into the CaF2 host lattice.

    Structural characterization of CaF2:Yb35Tm1.5Er0.5-SiO2 glass films. (a) EDS, (b) transmission, and (c) absorption spectra of the glass film obtained from the optimized conditions. The inset in (b) shows the optical image of the corresponding bulk glass. (d) TG/DTA curves for the xerogel treated in air. (e) XRD patterns of the xerogels treated at different temperatures.

    Figure 2.Structural characterization of CaF2:Yb35Tm1.5Er0.5-SiO2 glass films. (a) EDS, (b) transmission, and (c) absorption spectra of the glass film obtained from the optimized conditions. The inset in (b) shows the optical image of the corresponding bulk glass. (d) TG/DTA curves for the xerogel treated in air. (e) XRD patterns of the xerogels treated at different temperatures.

    To understand the crystallization of the glass matrix, we carried out thermogravimetry/differential thermal analysis (TG/DTA) and XRD measurements. The amorphous-to-crystalline phase transition was also consistently recorded in TEM results (Fig. 3). Together with the exothermic/endothermic peaks in the DT profile, the TG curve of xerogel in Fig. 2(d) shows four stages of weight loss in air, which can be ascribed to the evaporation of water and organic solvent between 25°C and 110°C, the burnout of excess acetic acid and ethanol between 110°C and 260°C, the complete combustion of polyester via the hydrolysis reaction of tetraethyl orthosilicate (TEOS) and acetates between 260°C and 400°C, and the crystallization of the cubic CaF2 phase between 400°C and 800°C, respectively. As evidenced by the XRD patterns [Fig. 2(e)] and TEM images (Fig. 3) for a series of CaF2:Yb35Tm1.5Er0.5-SiO2 nanofilms annealed at different temperatures, the films remain amorphous below 400°C accompanying with the phase separation and nucleation of amorphous clustering ions at this stage, which satisfies the nonclassical nucleation theory [47]. Then, well-organized crystalline grains can be obtained at a relatively high temperature (i.e., 800°C). This clearly suggests the occurrence of crystallization and growth of NCs, which follows the CN theory [47]. From Fig. 2(e), the corresponding diffraction peaks emerging from the broadband spectrum can be ascribed to (111), (200), (220), and (311) planes of the cubic CaF2 NCs, respectively [39,40,45]. Moreover, the impurity phases are observed from the film annealed at 1000°C. Meanwhile, the observed NCs experience obvious increases in size (Fig. 3). These are because heat treatment at elevated temperature promotes the relocation of dopant ions across the initial crystalline surface, thus resulting in the reconstruction and recrystallization of the crystalline grains [47,48].

    Crystallization characteristics. TEM images of the films annealed at (a) room temperature, (b) 400°C, (c) 800°C, and (d) 1000°C, respectively. Size distribution of the observed NCs by counting more than 100 particles is also indicated in (c) and (d). The scale bars are 20, 20, 20, and 50 nm, respectively.

    Figure 3.Crystallization characteristics. TEM images of the films annealed at (a) room temperature, (b) 400°C, (c) 800°C, and (d) 1000°C, respectively. Size distribution of the observed NCs by counting more than 100 particles is also indicated in (c) and (d). The scale bars are 20, 20, 20, and 50 nm, respectively.

    Accordingly, we have explored the dependence of surface quality on the heating rates during the multistep calcination. On the basis of the TG/DTA results, a group of CaF2:Yb35Tm1.5Er0.5-SiO2 film samples were obtained under different heat treatment before cooling down to room temperature. The photographs of annealed coatings (Fig. 4) visually reflect the evolution of the surface roughness. Clearly, the NCs-doped glass film treated by an optimized four-stage calcination [Fig. 4(d)] shares high transparency in the visible region [Fig. 2(b)] and ultrasmooth surface finish [Fig. 1(d)]. This is reasonable since the rapid rate, especially at the first heating stage, results in sharp strains from the evaporation, highly restricting the development of ultrasmooth surface. Also, it is worth noting that the sizes, density, and distribution of CaF2:Ln3+ NCs in glass matrix can be optimized through the precise control of the dopant concentration in the precursor solution, the duration time, and temperature of calcination at each stage.

    Evolution of surface roughness. Photographs of CaF2:Yb35Tm1.5Er0.5-SiO2 glass films under different heat treatment before cooling down to room temperature. (a) 25°C–800°C (at a rate of 1°C min−1). (b) 25°C–260°C (0.5°C min−1), staying at 260°C for 20 min, and 260°C–800°C (5°C min−1). (c) 25°C–260°C (0.5°C min−1), staying at 260°C for 20 min, 260°C–400°C (1°C min−1), and 400°C–800°C (5°C min−1). (d) 25°C–110°C (0.25°C min−1) and staying at 110°C for 20 min, 110°C–260°C (0.5°C min−1), 260°C–400°C (1°C min−1), and 400°C–800°C (5°C min−1).

    Figure 4.Evolution of surface roughness. Photographs of CaF2:Yb35Tm1.5Er0.5-SiO2 glass films under different heat treatment before cooling down to room temperature. (a) 25°C–800°C (at a rate of 1°Cmin1). (b) 25°C–260°C (0.5°Cmin1), staying at 260°C for 20 min, and 260°C–800°C (5°Cmin1). (c) 25°C–260°C (0.5°Cmin1), staying at 260°C for 20 min, 260°C–400°C (1°Cmin1), and 400°C–800°C (5°Cmin1). (d) 25°C–110°C (0.25°Cmin1) and staying at 110°C for 20 min, 110°C–260°C (0.5°Cmin1), 260°C–400°C (1°Cmin1), and 400°C–800°C (5°Cmin1).

    An extensive optical characterization was performed to validate white-light emission behavior of CaF2:Ln3+-SiO2 glass films, including multicolor emission spanning the visible spectrum, particularly red, green, and blue (RGB) colors. In this study, Yb3+ ions are selected as the sensitizer to absorb 980 nm irradiation and then transfer to the neighboring activator ions, while Er3+ and Tm3+ ions act as the activator to produce RGB emission. Figure 5(b) shows the upconversion multicolor emitting spectra of CaF2:Yb35Tm1.5, CaF2:Yb35Er1.0, and CaF2:Yb35Tm1.5Er0.5 NCs-doped films under the excitation of a continuous-wave (CW) 980 nm laser. The simplified energy level diagram for the observed light is depicted in Fig. 5(a). Mainly, the emission lines can be assigned to blue (D21F43 and G41H63 of Tm3+), green (H11/22I15/24 and S3/24I15/24 of Er3+), and red (G41F43 of Tm3+, and F9/24I15/24 of Er3+) bands, respectively [15,16,19,20]. The upconversion mechanism responsible for these characteristic emissions is attributed to energy transfer upconversion processes [1522]. Emission peaks at the red (648 and 653 nm) and green (527 and 545 nm) bands are attributed to two-photon upconversion process, while that at the blue (450 and 475 nm) one is due to three-photon upconversion process [35,36]. In the case, the origin of the white-light emission can be well understood by a combination of two complementary colors (i.e., blue and yellow ones).

    Optical characterization of CaF2:Ln3+ NCs-doped glass film. (a) Simplified energy level diagram of Er3+ and Tm3+ ions showing the radiative recombination processes responsible for the observed RGB light. (b) Emission spectra of the NCs-doped glass films under CW 980 nm irradiation at a power density of 20 W cm−2. The insets give the corresponding photographs of the excited bulk glasses.

    Figure 5.Optical characterization of CaF2:Ln3+ NCs-doped glass film. (a) Simplified energy level diagram of Er3+ and Tm3+ ions showing the radiative recombination processes responsible for the observed RGB light. (b) Emission spectra of the NCs-doped glass films under CW 980 nm irradiation at a power density of 20  Wcm2. The insets give the corresponding photographs of the excited bulk glasses.

    As predicted, the decreasing concentration of Yb3+ dopants predominately favors the green emission, whereas at higher concentrations, both the cross-relaxation and concentration quenching effects facilitate the red emission in the co-doped system [Fig. 6(c)] [16,19]. Thus, the yellow one happens as a result of the precise control of Yb3+ doping concentration. Clear evidence of yellow light [Figs. 6(c), 6(d), and 6(f)] appears from the excited CaF2:YbxEr1-SiO2 (x=3545) samples, of which the corresponding color coordinates locate at around (0.484, 0.510) in the Commission Internationale de l’Éclairage (CIE) 1931 chromaticity diagram. As the increase of the Yb3+ dopant, the CIE color points gradually change from (0.323,0.662) to (0.584,0.401) with the emitting color evolving from green through yellow to red. Note that the low green-to-red ratio is necessary to the generation of yellow light. In addition, the relative intensity of blue light was maximized in the CaF2:Yb35Tm1.5-SiO2 film sample. A further increase of Tm3+ [above 1.5 mol.%, Fig. 6(a)] and Yb3+ [above 35% mole fraction, Fig. 6(b)] concentration leads to the decrease of blue light, which is largely owing to the concentration quenching effect [20,22].

    White and full-color tunable photoluminescence. Emission spectra from glass films containing (a) Yb30-Tmx (x=0.5–2.5), (b) Yby-Tm1.5 (y=25–45), (c) Ybz-Er1 (z=15–95), and (e) Yb30-Tm1.5-Erw (w=0.1–2.0) under the excitation of a CW 980 nm laser. The pumping powers are (a), (b) 58 W cm−2 and (c)–(f) 20 W cm−2, respectively. (d) The evolution of integrated intensity of red and green color bands, as well as red to green ratio as a function of Yb3+ doping concentration in (c). (f) Chromaticity diagram showing the achievable color space from CaF2:Ln3+ luminescent glass films, compared with the sRGB benchmark. The indicated color coordinates are extracted from the spectra in (a), (b), (c), (e). The color photographs are the excited Yb35-Tm1.5 (blue), Yb35-Tm1.5-Er0.5 (white), Yb15-Er1 (green), Yb35-Er1 (yellow), and Yb95-Er1 (red) co-doped samples, respectively.

    Figure 6.White and full-color tunable photoluminescence. Emission spectra from glass films containing (a) Yb30-Tmx (x=0.52.5), (b) Yby-Tm1.5 (y=2545), (c) Ybz-Er1 (z=1595), and (e) Yb30-Tm1.5-Erw (w=0.12.0) under the excitation of a CW 980 nm laser. The pumping powers are (a), (b) 58  Wcm2 and (c)–(f) 20  Wcm2, respectively. (d) The evolution of integrated intensity of red and green color bands, as well as red to green ratio as a function of Yb3+ doping concentration in (c). (f) Chromaticity diagram showing the achievable color space from CaF2:Ln3+ luminescent glass films, compared with the sRGB benchmark. The indicated color coordinates are extracted from the spectra in (a), (b), (c), (e). The color photographs are the excited Yb35-Tm1.5 (blue), Yb35-Tm1.5-Er0.5 (white), Yb15-Er1 (green), Yb35-Er1 (yellow), and Yb95-Er1 (red) co-doped samples, respectively.

    Then, the possibilities to support white-light emission from the luminescent films were studied from a series of CaF2:Yb35Tm1.5Ery-SiO2 (y=0.12.0) film samples [Figs. 6(e) and 6(f)]. Obviously, CaF2:Yb35Tm1.5Er0.5-SiO2 film generates the resulting white light, with the color coordinate at (0.329, 0.331), excited by a CW 980 nm laser at a power density of 20  Wcm2, which is very close to that of the white point CIE standard white illuminant coordinates (0.33, 0.33). Furthermore, as the Er3+ concentration increases from 0 to 2.0% (mole fraction), Fig. 6(f) presents the sequence of the color evolution from blue through white to yellow. More importantly, a large range of the CIE(x,y) color space is enclosed by three elementary color samples, involving red (CaF2:Yb95Er1-SiO2), green (CaF2:Yb15Er1-SiO2), and blue (CaF2:Yb35Tm1.5-SiO2) ones. This is comparable to that of the standard RGB (sRGB) benchmark, implying that this combined strategy by controlling the relative intensity of three elementary color bands should permit fluorescence of the Ln3+-doped system spanning the full-visible color range. Hence, this luminescent glass film would be an excellent lasing candidate for a CMOS-compatible device.

    To confirm this assumption, the CaF2:Ln3+ NCs-doped SiO2 microtoroid cavity is fabricated upon a silicon substrate with a 2 μm thick oxide layer. A combination of a three-step patterning process, a spin-coating operation, and a subsequent laser-induced reflow process is employed to obtain the CaF2:Ln3+ NCs-doped SiO2 microtoroid cavity with ultrasmooth surface [17,37,38]. The fabrication details are depicted in Fig. 7(a). Initially, a thin negative photoresist layer (AZ2020) was spin-coated (4000 r/min, 60 s) onto the thoroughly cleaned oxidized silicon substrate and patterned using a mask aligner (Sichuan Nanguang HC 25). Through the standard photolithography (SVC Model H94-25C) and inductively coupled plasma (ICP, Oxford Plasmalab System100 ICP 180) etching processes, the circular pattern was transferred from initial mask, to negative photoresist, to silica layer, and finally to silicon substrate in sequence. In the ICP process, C4F8 and SF6 gases were specifically selected for the purpose of anisotropic silica etching and isotropic silicon etching, respectively. Consequently, a silica microdisk holding by the underlying silicon pillar was achieved. After removing the photoresist layer, the precursor containing Ln3+ ions was spin-coated onto the preformed SiO2 substrate, followed by an optimized four-stage calcination. Finally, an additional CO2 laser (CWQ800K)-assisted reflow was conducted to melt the microdisks along the periphery and therefore smooth the rims. The typical SEM images of such surface-tension-induced CaF2:Yb35Tm1.5Er0.5-SiO2 microtoroids are shown in Figs. 7(b)–7(d), where the microtoroid cavity well inherits the initial shape of pure silica microdisk (Fig. 8) after going through several pattern transferring processes. It is found that the overall disk diameter shrinks to form an 86 μm microtoroid. The height of the silicon pillar supporting the microtoroid was around 24 μm. No obvious variances in size and shape can be detected from those microtoroid cavities as long as the pumping power of the CO2 laser is fixed at a constant value.

    Fabrication of chip-scale CaF2:Yb35Tm1.5Er0.5-SiO2 microtoroid device. (a) Schematic diagram illustrating the typical fabrication procedures. (b) Top view and (c) oblique view SEM images of an individual microtoroid (i.e., 117 μm in diameter). (d) Top view SEM image of the microtoroids array. The scale bars of (b)–(d) are 20, 20, and 200 μm, respectively.

    Figure 7.Fabrication of chip-scale CaF2:Yb35Tm1.5Er0.5-SiO2 microtoroid device. (a) Schematic diagram illustrating the typical fabrication procedures. (b) Top view and (c) oblique view SEM images of an individual microtoroid (i.e., 117 μm in diameter). (d) Top view SEM image of the microtoroids array. The scale bars of (b)–(d) are 20, 20, and 200 μm, respectively.

    Pure SiO2 microdisks before the reflow process. (a) Top view and (b) oblique view SEM images of an individual microdisk. (c) Top view SEM image of the microdisks array. The scale bars are (a), (b) 40 μm and (c) 600 μm, respectively. The exact diameter of each microdisk is found to be around 120 μm.

    Figure 8.Pure SiO2 microdisks before the reflow process. (a) Top view and (b) oblique view SEM images of an individual microdisk. (c) Top view SEM image of the microdisks array. The scale bars are (a), (b) 40 μm and (c) 600 μm, respectively. The exact diameter of each microdisk is found to be around 120 μm.

    The microcavities were first characterized in the 1550 nm band with a tapered fiber waveguide, as shown in the left inset of Fig. 9(a) [44,49]. A concise survey on the dependence of the Q factor over a range of the coating thickness was conducted by recording the calculated Q values. In this study, the thickness of the glass film could be determined by the spin-coating speed and repetition times, and a minimum layer thickness to achieve high Q microtoroid resonator is found to be around 66 nm. From the right inset of Fig. 9(a), the loaded Q of the CaF2:Yb35Tm1.5Er0.5-SiO2 microtoroid is as high as 5.04×10⁵ in air through the equation Q=λ/δλ, where λ is the resonant wavelength and δλ is the full width at half-maximum (FWHM) of the transmission peak [3436]. Obviously, the reflow operation facilitates the formation of an ultrasmooth cavity surface, which is consistent with the observations from the SEM images in Fig. 7.

    The lasing characterization of the as-prepared microtoroid [Figs. 9(b)–9(e)] was performed by the free-space excitation. Generally, a pulsed 980 nm laser (6 ns, 10 Hz) from a 355 nm frequency-tripled Q-switched Nd:YAG laser (Continuum Surelite II-10) excited optical parameter oscillator (Continuum Horizon I) was directly focused on the top surface of the microtoroid. The emission from the edge of the resonator was collected by an optical fiber and recorded by an iHR-320 monochromator attached with a photomultiplier tube. To determine the onset of lasing action, Fig. 9(b) presents the RGB emission intensity over a range of power density. Clearly, the light-light curves exhibit S-like shapes, implying the transition from spontaneous emission through amplified spontaneous emission to lasing oscillation. Accordingly, the threshold values (Pth), as reflected by the second kink in Fig. 9(b), are found to be as low as 1.99, 1.89, and 2.10  mJcm2 for the red, green, and blue emissions, respectively. These similarly low threshold values verify the high Q of such an active microtoroid cavity. As expected, the slopes (i.e., between the Pa and Pth) of the blue emission are larger than the red and green counterparts, while those of the red and green emissions share a similar value. This is reasonable since the blue emission and the green/red emissions are due to three-photon and two-photon upconversion process, respectively.

    The spectral evolution of RGB emissions with the increase of pumping power is depicted in Figs. 9(c)–9(e). Only broadband emission peaks are observed at low power density. Then, periodic peaks maxima at 653, 545, and 475 nm sequentially occur and quickly dominate the emission spectra as the pumping power increases. Owing to the occurrence of stimulated emission, the FWHMs of these peaks collapse to less than 0.8 nm. We further investigate the mode spacing of the RGB bands. At a pumping level above 2  mJcm2, the mode spacing, Δλ, can be clearly observed from the high-resolution spectra, which are recorded at around 0.56, 0.75, and 1.0 nm for blue, green, and red emissions, respectively. The calculated Δλ can be taken from the equation Δλ=λ02/neffπd, where λ0, neff, and d are the emitting wavelength, the group refractive index, and the diameter of the microtoroid, respectively. Typically, for λ=653  nm, neff=1.45 at 653 nm, and the diameter of the microtoroid cavity d=86  μm, the theoretical Δλ is around 1.08 nm, which is in reasonable agreement with the measured one. Furthermore, the inset of Fig. 9(e) presents the numerical simulation of the excited whispering gallery modes (WGMs) at the wavelength of 653 nm in 2D geometry. This is a clear indication of the formation of WGMs via total internal reflection along the interface of the volume, which is consistent with the measured results [46]. All these features unambiguously demonstrate that our microtoroid cavities can simultaneously support RGB lasing through the resonance of WG modes.

    As has been previously realized, the efficiency of upconversion lasing, especially that at higher lying states, is suppressed due to the depletion of energy related to the high nonradiative recombination loss of Ln3+ ions in pure silica [23,24]. In sharp contrast with those SiO2:Ln3+ microcavity, our device fabrication allows Ln3+ ions to disperse in the CaF2 crystalline host lattice, which were selectively encapsulated in silica microtoroid as the gain medium. In this study, both the ultrasmall size and uniform distribution of NCs ensure a high Q factor of the microtoroid (>105), implying strong light field confinement in the small volume. The doping density of Ln3+ ions can be increased to reach a high optical gain, whereas the clustering and detrimental interactions of Ln3+ ions are effectively suppressed due to the firmly confined Ln3+ in cubic CaF2 lattice and the uniform distribution of NCs in the matrix [32,50]. Multiphoton upconversion processes are also improved for the inherent low phonon energy of the CaF2 host [39,40,45]. Thus, an efficient white-light upconversion lasing was realized from the as-prepared CaF2:Ln3+-SiO2 microtoroid cavities.

    Further evidence for stable white-light lasing behavior in the CaF2:Yb35Tm1.5Er0.5-SiO2 microtoroid can be seen in Fig. 10. Figure 10(a) presents the measured Pth and 1/Δλ of the RGB emissions as a function of d. As anticipated, the Pth values decrease as the cavity size increases [3436,51,52]. This can be defined with the equation Pthexp(αd), where α is the curvature loss [35]. In addition, the Δλ of the RGB bands remains inversely proportional to d, and the variations can be linearly fitted by the blue lines in Fig. 10(a) [3436]. Figure 10(b) exhibits the simultaneous RGM emission spectra (i.e., above Pth) of each microtoroid with different d values (i.e., 56, 86, and 117 μm, respectively). The corresponding color points, involving (0.324, 0.354), (0.327, 0.355), and (0.377, 0.324), are depicted in Fig. 10(c). Furthermore, the CIE 1931 chromaticity diagram in Fig. 10(d) shows the calculated color coordinates, which locate at (0.327, 0.355), (0.335, 0.365), and (0.346, 0.361), respectively, of the excited microtoroid (d86  μm) at different power densities. Intriguingly, all these points fall within the white-light region with a very tiny shift when the pumping density is above 2.25  mJcm2.

    Upconversion lasing characterization of CaF2:Yb35Tm1.5Er0.5-SiO2 microtoroid. (a) Dependence of the cavity Q factor on the coating thickness. The insets give the testing setup and the representative transmission spectra for Q factor measurement. (b) Light-light curves for RGB emissions under the excitation of a 980 nm pulsed laser. (c)–(e) Plots of RGB emission spectra versus different power density. The diameter of the microtoroid is around 86 μm.

    Figure 9.Upconversion lasing characterization of CaF2:Yb35Tm1.5Er0.5-SiO2 microtoroid. (a) Dependence of the cavity Q factor on the coating thickness. The insets give the testing setup and the representative transmission spectra for Q factor measurement. (b) Light-light curves for RGB emissions under the excitation of a 980 nm pulsed laser. (c)–(e) Plots of RGB emission spectra versus different power density. The diameter of the microtoroid is around 86 μm.

    White-light lasing characterization of CaF2:Yb35Tm1.5Er0.5-SiO2 microtoroid. (a) Plots of Pth and 1/Δλ extracted from the RGB emissions versus d of the microtoroids. The error bars stand for the standard deviations from three sets of measurements. (b) Simultaneous RGB emission spectra of each microtoroid with d equal to 56, 86, and 117 μm, respectively, and the corresponding (c) color coordinates in the CIE1931(x, y) chromaticity diagram. (d) CIE1931(x, y) chromaticity diagram extracted from the emission spectra of an excited 86 μm microtoroid at different power densities (i.e., 2.25, 2.4, and 2.5 mJ cm−2). The insets give the enlarged drawing of the selected area in (c) and (d), respectively.

    Figure 10.White-light lasing characterization of CaF2:Yb35Tm1.5Er0.5-SiO2 microtoroid. (a) Plots of Pth and 1/Δλ extracted from the RGB emissions versus d of the microtoroids. The error bars stand for the standard deviations from three sets of measurements. (b) Simultaneous RGB emission spectra of each microtoroid with d equal to 56, 86, and 117 μm, respectively, and the corresponding (c) color coordinates in the CIE1931(x, y) chromaticity diagram. (d) CIE1931(x, y) chromaticity diagram extracted from the emission spectra of an excited 86 μm microtoroid at different power densities (i.e., 2.25, 2.4, and 2.5  mJcm2). The insets give the enlarged drawing of the selected area in (c) and (d), respectively.

    This white-light microlaser is intrinsically different from the previous reports [9,12,13]. In conventional designs, the thresholds of RGB microlasers are quite different. As a result, the ratios between different colors change dramatically, strongly affecting the stability of the white-light laser. In contrast, the color coordinates of our white-light lasing roughly remain stable (i.e., above Pth) even with the increase of pumping power. On the one hand, such stability is reasonable owing to the conspicuous difference between unsaturated upconversion [1315] dominating in photoluminescence and gain saturation [17,22,51,52] dominating in lasing emission. Generally, the double-logarithmic dependence of blue emission (i.e., three-photon upconversion process) and red, green emissions (i.e., two-photon upconversion process) on the pumping power can be well fitted by a linear equation, lgIem=klgIex, where Iem is the integrated output intensity, Iex is the pumping power, and k is the slope representing the absorbed excitation photons [13,14]. For PL, the k values of the RGB emissions are very different due to distinct multiphoton upconversion processes. Thus, the resulting luminescent color related to the proportions of RGB emissions changes over a wide range with the increasing irradiation. On the contrary, the RGB emissions dominating at higher power intensity (i.e., above Pth) share slopes of around 1 as the onset of lasing emission [17,22,51,52]. On the other hand, the simultaneous RGB lasers exhibit similar thresholds due to the highly confined WG modes. Consequently, the ratio of R:G:B emissions remains roughly the same for a wide power range other than negligible changes in the proportions of the blue and red color bands in the total integrated intensity. All these well explain the stability of our high-Q white-light laser on a chip.

    3. CONCLUSION

    In conclusion, we have demonstrated a high-Q (i.e., exceeding 105) CaF2:Ln3+ UCNCs-doped SiO2 toroidal microcavity on a silicon chip. The key to our successful demonstration is a controlled growth approach that permits a uniform distribution of the ultrasmall CaF2:Ln3+ NCs in SiO2 matrix, and therefore the development of a high-Q active microtoroid. By stoichiometric doping of Ln3+ ions, such microlasers are capable of generating simultaneous RGB lasing with similar thresholds and robust white-light upconversion lasing from a single gain medium. Meanwhile, as the onset of highly confined WGM lasing, the increasing rates of the RGB emissions above Pth are roughly the same, thus resulting in the similar proportions of the RGB light in the total integrated intensity, which determines the excellent stability of the resultant on-chip white-light lasing. Benefiting from the doping flexibility, such high-Q chip-integrated lasers that could lase at any color of interest with high stability see critical applications in many fields.

    4. MATERIALS AND METHODS

    Reagents. All chemical regents, involving ytterbium (III) acetate hydrate (99.9%), thulium (III) acetate hydrate (99.9%), erbium (III) acetate hydrate (99.9%), calcium acetate hydrate (99.0%), trifluoroacetic acid (TFA, 99.0%), TEOS (99.99%), ethanol absolute, acetic acid (AA, 99.7%), were used as received without further purification.

    Synthesis ofCaF2:Ln3+nanocrystals-doped silica film. A series of CaF2:Yb3+/Tm3+/Er3+ (x, y, z represent mole fractions of individual ions) nanocrystals-doped silica nanofilm was synthesized by solgel and spin-coating procedure [37,38]. In a typical synthesis, raw TEOS was treated in dilute ethanol (TEOS:ethanol=1:1, volume ratio) with required amounts of AA as catalytic agent under vigorous stirring at 70°C. TEOS, de-ionized H2O, and AA were added in the molar ratio of 1:10:0.5. Stoichiometric amounts of the lanthanide (III) and calcium acetate salts were dissolved in TFA. The molar ratio of metal ions to F was 1:10, and that of metal ions to silica was 8:92. The mixture was heated at 70°C and magnetically stirred for 90 min for a clear solution. After cooling down to room temperature, the solution was added to the silica precursor dropwise. The resultant solution was stirred for 1 h to form a sol and then spin-coated on an oxidized silicon substrate. Finally, the coatings were annealed by the following steps: (i) dried from room temperature to 110°C at a heating rate of 0.25°Cmin1, and staying for 20 min; (ii) heated to 260°C at a rate of 0.5°Cmin1; (iii) heated to 400°C at a rate of 1°Cmin1; and (iv) heated to 800°C at a rate of 5°Cmin1.

    Characterization. The formation of CaF2:Ln3+-SiO2 nanofilm was confirmed by scanning electron microscopy (Hitachi Model S-4700, 10–30 kV), transmission electron microscopy (FEI/Philips Tecnai 12 BioTWIN, 120 kV), high-resolution TEM (JEOL-JEM 2100F, 200 kV), and X-ray diffraction (Bruker AXS D2). The thickness of the silica film was analyzed by a thickness gauge (Dektak 150). The thermogravimetry/differential thermal analysis was carried out on a Netzsch STA 449 F5 thermal analyzer. The ultraviolet-visible absorption and transmission spectra of the film were performed on a Shimadzu UV-2550 spectrometer. High-resolution emission spectra were recorded by an iHR-320 monochromator (Horiba) attached with a photomultiplier. The resolution of the spectrometer is 0.06 nm.

    Acknowledgment

    Acknowledgment. The authors also acknowledge support from the Shenzhen Engineering Laboratory on Organic-Inorganic Perovskite Devices.

    References

    [1] L. Jin, X. Chen, Y. Wu, X. Ai, X. Yang, S. Xiao, Q. Song. Dual-wavelength switchable single-mode lasing from a lanthanide-doped resonator. Nat. Commun., 13, 1727(2022).

    [2] B.-S. Moon, T. K. Lee, W. C. Jeon, S. K. Kwak, Y.-J. Kim, D.-H. Kim. Continuous-wave upconversion lasing with a sub-10  W cm−2 threshold enabled by atomic disorder in the host matrix. Nat. Commun., 12, 4437(2021).

    [3] H. Xin, Y. Li, Y.-C. Liu, Y. Zhang, Y.-F. Xiao, B. Li. Optical forces: from fundamental to biological applications. Adv. Mater., 32, 2001994(2020).

    [4] Y. Hu, L. Shao, S. Arnold, Y.-C. Liu, C.-Y. Ma, Y.-F. Xiao. Mode broadening induced by nanoparticles in an optical whispering-gallery microcavity. Phys. Rev. A, 90, 043847(2014).

    [5] C. Zhang, C.-L. Zou, Y. Zhao, C.-H. Dong, C. Wei, H. Wang, Y. Liu, G.-C. Guo, J. Yao, Y. S. Zhao. Organic printed photonics: from microring lasers to integrated circuits. Sci. Adv., 1, e1500257(2015).

    [6] C. Huang, C. Zhang, S. Xiao, Y. Wang, Y. Fan, Y. Liu, N. Zhang, G. Qu, H. Ji, J. Han. Ultrafast control of vortex microlasers. Science, 367, 1018-1021(2020).

    [7] X.-R. Mao, Z.-K. Shao, H.-Y. Luan, S.-L. Wang, R.-M. Ma. Magic-angle lasers in nanostructured moiré superlattice. Nat. Nanotechnol., 16, 1099-1105(2021).

    [8] F. Fan, S. Turkdogan, Z. Liu, D. Shelhammer, C. Z. Ning. A monolithic white laser. Nat. Nanotechnol., 10, 796-803(2015).

    [9] D. Huang, Y. Xie, D. Lu, Z. Wang, J. Wang, H. Yu, H. Zhang. Demonstration of a white laser with V2C MXene-based quantum dots. Adv. Mater., 31, 1901117(2019).

    [10] K. Ge, X. Shi, Z. Xu, L. Cui, T. Zhai. Full-color WGM lasing in nested microcavities. Nanoscale, 13, 10792-10797(2021).

    [11] X. Shi, Y. Bian, J. Tong, D. Liu, Z. Wang. Chromaticity-tunable white random lasing based on a microfluidic channel. Opt. Express, 28, 13576-13585(2020).

    [12] A. Adamow, A. Szukalski, L. Sznitko, L. Persano, D. Pisignano, A. Camposeo, J. Mysliwiec. Electrically controlled white laser emission through liquid crystal/polymer multiphases. Light Sci. Appl., 9, 19(2020).

    [13] P. Guo, M. K. Hossain, X. Shen, H. Sun, W. Yang, C. Liu, C. Y. Ho, C. K. Kwok, S. Tsang, Y. Luo, J. C. Ho, K. M. Yu. Room-temperature red-green-blue whispering-gallery mode lasing and white-light emission from cesium lead halide perovskite (CsPbX3, X = Cl, Br, I) microstructures. Adv. Opt. Mater., 6, 1700993(2018).

    [14] H.-L. Dai, C. Yin, Z.-Y. Xiao, Z.-Q. Cao, X.-F. Chen. White beam lasing from a hybrid microcavity with slab-capillary mode coupling. Phys. Rev. Appl., 11, 064055(2019).

    [15] T. Wang, H. Yu, C. K. Siu, J. Qiu, X. Xu, S. F. Yu. White-light whispering-gallery-mode lasing from lanthanide-doped upconversion NaYF4 hexagonal microrods. ACS Photon., 4, 1539-1543(2017).

    [16] G. Haider, H.-I. Lin, K. Yadav, K.-C. Shen, Y.-M. Liao, H.-W. Hu, P. K. Roy, K. P. Bera, K.-H. Lin, H.-M. Lee, Y.-T. Chen, F.-R. Chen, Y.-F. Chen. A highly-efficient single segment white random laser. ACS Nano, 12, 11847-11859(2018).

    [17] L. Jin, Y. Wu, Y. Wang, S. Liu, Y. Zhang, Z. Li, X. Chen, W. Zhang, S. Xiao, Q. Song. Mass-manufactural lanthanide-based ultraviolet B microlasers. Adv. Mater., 31, 1807079(2019).

    [18] X. Zhu, X. Yu, W. Gao, H. Liu, L. Nie, H. Guo, F. Zhao, S. Yu, T. Wang. Optical enhancement of nonstoichiometry-induced heterojunction in lanthanide doped double perovskite phosphors for WLEDs and scintillation applications. Chem. Eng. J., 442, 136235(2022).

    [19] K. Zheng, Y. Liu, Z. Liu, Z. Chen, W. Qin. Color control and white upconversion luminescence of LaOF:Ln3+(Ln = Yb, Er, Tm) nanocrystals prepared by the sol-gel Pechini method. Dalton Trans., 42, 5159-5166(2013).

    [20] C. Zhang, L. Yang, J. Zhao, B. Liu, M. Y. Han, Z. Zhang. White-light emission from an integrated upconversion nanostructure: toward multicolor displays modulated by laser power. Angew. Chem. Int. Ed., 127, 11693-11697(2015).

    [21] P. Chen, Q. Li, S. Grindy, N. Holten-Andersen. White-light-emitting lanthanide metallogels with tunable luminescence and reversible stimuli-responsive properties. J. Am. Chem. Soc., 137, 11590-11593(2015).

    [22] X. Chen, L. Jin, W. Kong, T. Sun, W. Zhang, X. Liu, J. Fan, S. F. Yu, F. Wang. Confining energy migration in upconversion nanoparticles towards deep ultraviolet lasing. Nat. Commun., 7, 10304(2016).

    [23] T. Lu, L. Yang, R. V. A. Van Loon, A. Polman, K. J. Vahala. On-chip green silica upconversion microlaser. Opt. Lett., 34, 482-484(2009).

    [24] S. Mehrabani, A. M. Armani. Blue upconversion laser based on thulium-doped silica microcavity. Opt. Lett., 38, 4346-4349(2013).

    [25] T. J. Kippenberg, J. Kalkman, A. Polman, K. J. Vahala. Demonstration of an erbium-doped microdisk laser on a silicon chip. Phys. Rev. A, 74, 051802(2006).

    [26] X.-F. Jiang, Y.-F. Xiao, C.-L. Zou, L. He, C.-H. Dong, B.-B. Li, Y. Li, F.-W. Sun, L. Yang, Q. Gong. Highly unidirectional emission and ultralow-threshold lasing from on-chip ultrahigh-Q microcavities. Adv. Mater., 24, OP260-OP264(2012).

    [27] L. Chang, X. Jiang, S. Hua, C. Yang, J. Wen, L. Jiang, G. Li, G. Wang, M. Xiao. Parity-time symmetry and variable optical isolation in active-passive-coupled microresonators. Nat. Photonics, 8, 524-529(2014).

    [28] L. Yang, D. K. Armani, K. J. Vahala. Fiber-coupled erbium microlasers on a chip. Appl. Phys. Lett., 83, 825-826(2003).

    [29] C. J. Bekker, C. G. Baker, W. P. Bowen. Optically tunable photoluminescence and up-conversion lasing on a chip. Phys. Rev. Appl., 15, 034022(2021).

    [30] X. Chen, D. Peng, Q. Ju, F. Wang. Photon upconversion in core-shell nanoparticles. Chem. Soc. Rev., 44, 1318-1330(2015).

    [31] G. Chen, H. Ågren, T. Y. Ohulchanskyy, P. N. Prasad. Light upconverting core–shell nanostructures: nanophotonic control for emerging applications. Chem. Soc. Rev., 44, 1680-1713(2015).

    [32] F. Wang, R. Deng, J. Wang, Q. Wang, Y. Han, H. Zhu, X. Chen, X. Liu. Tuning upconversion through energy migration in core-shell nanoparticles. Nat. Mater., 10, 968-973(2011).

    [33] H. Wen, H. Zhu, X. Chen, T. F. Hung, B. Wang, G. Zhu, S. F. Yu, F. Wang. Upconverting near-infrared light through energy management in core-shell-shell nanoparticles. Angew. Chem. Int. Ed., 52, 13419-13423(2013).

    [34] T. Sun, B. Chen, Y. Guo, Q. Zhu, J. Zhao, Y. Li, X. Chen, Y. Wu, Y. Gao, L. Jin, S. T. Chu, F. Wang. Ultralarge anti-Stokes lasing through tandem upconversion. Nat. Commun., 13, 1032(2022).

    [35] H. Zhu, X. Chen, L. M. Jin, Q. J. Wang, F. Wang, S. F. Yu. Amplified spontaneous emission and lasing from lanthanide-doped up-conversion nanocrystals. ACS Nano, 7, 11420-11426(2013).

    [36] L. M. Jin, C. Xian, C. K. Siu, W. Feng, S. F. Yu. Enhancing multiphoton upconversion from NaYF4:Yb/Tm@NaYF4 core–shell nanoparticles via the use of laser cavity. ACS Nano, 11, 843-849(2017).

    [37] S. Sivakumar, F. C. M. Van Veggel, P. S. May. Near-infrared (NIR) to red and green up-conversion emission from silica sol-gel thin films made with La0.45Yb0.50Er0.05F3 nanoparticles, hetero-looping-enhanced energy transfer (Hetero-LEET):  a new up-conversion process. J. Am. Chem. Soc., 129, 620-625(2007).

    [38] M. Yu, J. Lin, Z. Wang, J. Fu, S. Wang, H. J. Zhang, Y. C. Han. Fabrication, patterning, and optical properties of nanocrystalline YVO4:A (A = Eu3+, Dy3+, Sm3+, Er3+) phosphor films via sol-gel soft lithography. Chem. Mater., 14, 2224-2231(2002).

    [39] G. Wang, Q. Peng, Y. Li. Upconversion luminescence of monodisperse CaF2:Yb3+/Er3+ nanocrystals. J. Am. Chem. Soc., 131, 14200-14201(2009).

    [40] X. Chen, B. Zhang, X. Qian, J. Wang, L. Zheng, J. Hou, Y. Fang, L. Su. Upconversion color tenability and white light generation in Yb3+/Er3+/Tm3+ tri-doped CaF2 single crystals. Opt. Mater., 90, 40-45(2019).

    [41] D. K. Armani, T. J. Kippenberg, S. M. Spillane, K. J. Vahala. Ultra-high-Q toroid microcavity on a chip. Nature, 421, 925-928(2003).

    [42] K. A. Knapper, K. D. Heylman, E. H. Horak, R. H. Goldsmith. Chip-scale fabrication of high-Q all-glass toroidal microresonators for single-particle label-free imaging. Adv. Mater., 28, 2945-2950(2016).

    [43] D. Korn, M. Lauermann, S. Koeber, P. Appel, L. Alloatti, R. Palmer, P. Dumon, W. Freude, J. Leuthold, C. Koos. Lasing in silicon–organic hybrid waveguides. Nat. Commun., 7, 10864(2016).

    [44] Y. Wang, N. Zhang, Z. Jiang, L. Wang, Y. Xiao, W. Sun, N. Yi, S. Liu, X. Gu, S. Xiao, Q. Song. Chip-scale mass manufacturable high-Q silicon microdisks. Adv. Mater. Technol., 2, 1600299(2017).

    [45] L. Zhou, D. Chen, W. Luo, Y. Wang, Y. Yu, F. Liu. Transparent glass ceramic containing Er3+:CaF2 nano-crystals prepared by sol-gel method. Mater. Lett., 61, 3988-3990(2007).

    [46] L. He, Ş. K. Özdemir, Y. Lan. Whispering gallery microcavity lasers. Laser Photonics Rev., 7, 60-82(2013).

    [47] T. Wang, W. Lu, X. Xu, J. Qiu, S. F. Yu. Study of crystallization and coalescence of nanocrystals in amorphous glass at high temperature. Inorg. Chem., 58, 9500-9504(2019).

    [48] B. Chen, D. Peng, X. Chen, X. Qiao, X. Fan, F. Wang. Establishing the structural integrity of core-shell nanoparticles against elemental migration using luminescent lanthanide probes. Angew. Chem. Int. Ed., 54, 12788-12790(2015).

    [49] N. Zhang, Z. Gu, S. Liu, Y. Wang, S. Wang, Z. Duan, W. Sun, Y.-F. Xiao, S. Xiao, Q. Song. Far-field single nanoparticle detection and sizing. Optica, 4, 1151-1156(2017).

    [50] J. Wang, R. Deng, M. A. Macdonald, B. Chen, J. Yuan, F. Wang, D. Chi, T. S. A. Hor, P. Zhang, G. Liu, Y. Han, X. Liu. Enhancing multiphoton upconversion through energy clustering at sublattice level. Nat. Mater., 13, 157-162(2014).

    [51] C. Huang, W. Sun, S. Liu, S. Li, S. Wang, Y. Wang, N. Zhang, H. Fu, S. Xiao, Q. Song. Highly controllable lasing actions in lead halide perovskite-Si3N4 hybrid micro-resonators. Laser Photonics Rev., 13, 1800189(2019).

    [52] C. Huang, W. Sun, Y. Fan, Y. Wang, Y. Gao, N. Zhang, K. Wang, S. Liu, S. Wang, S. Xiao, Q. Song. Formation of lead halide perovskite based plasmonic nanolasers and nanolaser arrays by tailoring the substrate. ACS Nano, 12, 3865-3874(2018).

    Limin Jin, Zhuo Liu, Yuqi Zhang, Yunkai Wu, Yilin Liu, Huachun Deng, Qinghai Song, Shumin Xiao. Lanthanide-doped nanocrystals in high-Q microtoroids for stable on-chip white-light lasers[J]. Photonics Research, 2022, 10(7): 1594
    Download Citation