• Laser & Optoelectronics Progress
  • Vol. 57, Issue 20, 201011 (2020)
Suhui Yang1, Zhiwei Lin1、3、4、*, Shaojun Lai2, and Jinfu Liu1、5、6、**
Author Affiliations
  • 1College of Computer and Information Sciences, Fujian Agriculture and Forestry University, Fuzhou, Fujian 350002, China
  • 2Fuzhou Meteorological Bureau, Fuzhou, Fujian 350014, China
  • 3College of Forestry, Fujian Agriculture and Forestry University, Fuzhou, Fujian 350002, China
  • 4Forestry Post-Doctoral Station, Fujian Agriculture and Forestry University, Fuzhou, Fujian 350002, China
  • 5Cross-Strait Nature Reserve Research Center, Fujian Agriculture and Forestry University, Fuzhou, Fujian 350002, China
  • 6Key Laboratory of Fujian Universities for Ecology and Resource Statistics, Fuzhou, Fujian 350002, China
  • show less
    DOI: 10.3788/LOP57.201011 Cite this Article Set citation alerts
    Suhui Yang, Zhiwei Lin, Shaojun Lai, Jinfu Liu. Precipitation Nowcasting Based on Dual-Flow 3D Convolution and Monitoring Images[J]. Laser & Optoelectronics Progress, 2020, 57(20): 201011 Copy Citation Text show less
    Dual-flow 3D convolution neural network
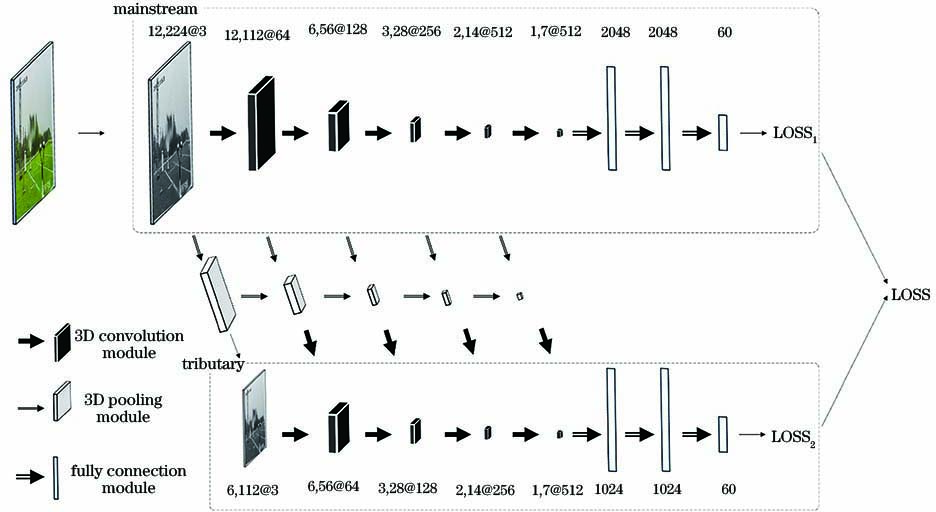
    Fig. 1. Dual-flow 3D convolution neural network
    Convolution operation
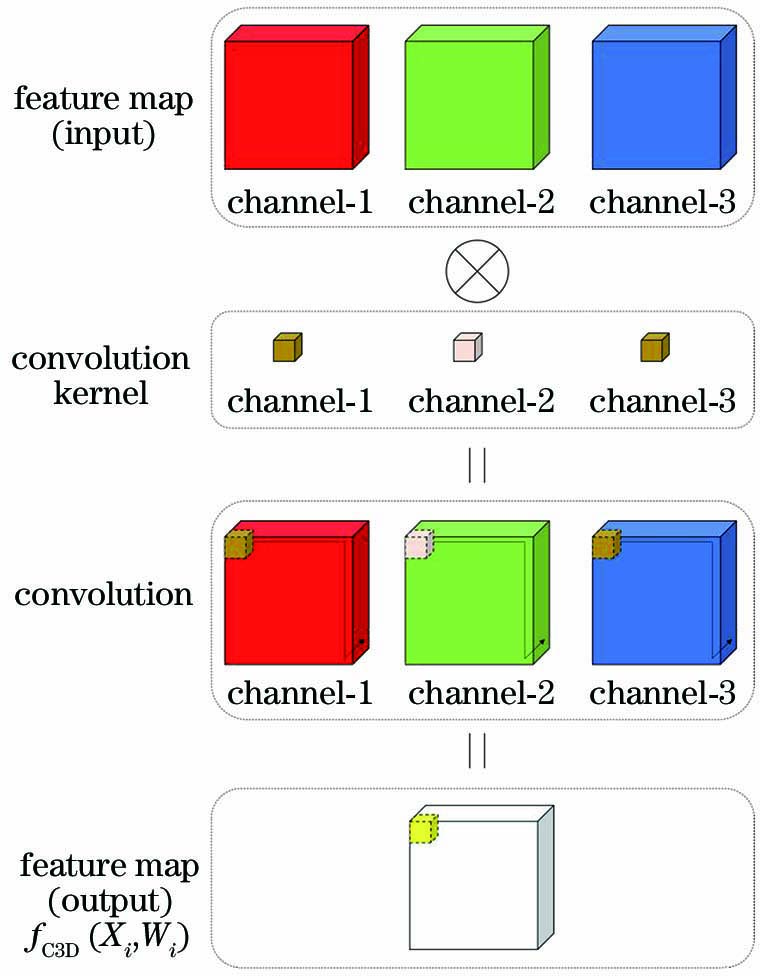
    Fig. 2. Convolution operation
    Max pooling operation
    Fig. 3. Max pooling operation
    Fully connection operation
    Fig. 4. Fully connection operation
    Prediction effect. (a)Proposed network; (b)ConvLSTM network; (c)C3D network; (d) Asy 3D network
    Fig. 5. Prediction effect. (a)Proposed network; (b)ConvLSTM network; (c)C3D network; (d) Asy 3D network
    Accuracy and loss value under training. (a) Accuracy; (b) loss value
    Fig. 6. Accuracy and loss value under training. (a) Accuracy; (b) loss value
    Accuracy and loss value under test. (a) Accuracy; (b) loss value
    Fig. 7. Accuracy and loss value under test. (a) Accuracy; (b) loss value
    Characteristic graphs under different depth convolution modules
    Fig. 8. Characteristic graphs under different depth convolution modules
    ModelABCDE
    Single- flowSingle lossNo pooling
    Dual-flowSingle lossMax pooling
    No pooling
    Dual lossMax pooling
    average pooling
    A/%82.1981.0084.2384.2084.46
    Table 1. Ablation experiment
    PI/(mL·h-1)Proposed networkConvLSTMC3DAsy 3DSamplesize
    PFAR /%↓PPOD /%↑PCSI /%↑PFAR /%↓PPOD /%↑PCSI /%↑PFAR /%↓PPOD /%↑PCSI /%↑PFAR /%↓PPOD /%↑PCSI /%↑
    00.110.960.920.240.890.820.120.950.910.180.860.841227
    10.190.780.790.420.610.590.180.740.780.310.670.68501
    20.220.720.750.350.470.550.290.720.720.430.620.60261
    30.220.760.770.350.610.630.290.730.720.360.690.67193
    40.240.760.760.370.570.600.270.720.730.320.510.59103
    50.170.700.760.300.510.590.260.700.720.360.430.5269
    60.030.690.810.320.400.510.130.620.720.380.600.6142
    70.230.590.670.270.280.410.290.560.630.390.440.5139
    80.240.620.680.110.380.530.360.670.650.540.520.4921
    90.260.560.640.100.360.510.180.560.670.470.400.4525
    100.210.550.650.140.300.440.170.500.620.330.900.7720
    110.210.810.800.110.300.440.160.780.810.270.410.5227
    120.200.800.800.000.200.330.000.800.890.330.400.505
    130.000.710.830.000.430.600.000.570.730.000.710.837
    140.330.890.760.330.440.530.250.670.710.330.440.539
    150.000.330.500.000.330.500.000.330.500.250.500.606
    161.000.000.001.000.000.001.000.000.000.001.001.001
    170.000.800.890.000.400.570.000.800.891.000.000.005
    180.000.750.860.000.500.670.000.750.860.000.500.674
    190.000.430.600.000.290.440.250.430.550.000.860.927
    200.250.860.800.380.710.670.330.860.750.000.430.607
    210.001.001.000.330.330.440.290.830.770.200.670.736
    220.001.001.000.001.001.000.001.001.000.001.001.002
    240.000.500.670.000.500.670.000.500.670.001.001.002
    250.501.000.670.001.001.000.001.001.000.001.001.001
    270.001.001.000.000.330.500.251.000.860.000.670.803
    291.000.000.001.000.000.001.000.000.001.000.000.001
    320.001.001.000.001.001.000.001.001.000.001.001.001
    341.000.000.001.000.000.001.000.000.001.000.000.001
    381.000.000.001.000.000.001.000.000.000.001.001.001
    461.000.000.001.000.000.001.000.000.000.001.001.001
    560.001.001.001.000.000.000.001.001.000.000.500.672
    Table 2. Comparison of test results of each precipitation intensity
    Suhui Yang, Zhiwei Lin, Shaojun Lai, Jinfu Liu. Precipitation Nowcasting Based on Dual-Flow 3D Convolution and Monitoring Images[J]. Laser & Optoelectronics Progress, 2020, 57(20): 201011
    Download Citation