Author Affiliations
1Zhejiang University, College of Information Science and Electronic Engineering, Interdisciplinary Center for Quantum Information, State Key Laboratory of Modern Optical Instrumentation, Hangzhou, China2Air Force Engineering University, Air and Missile Defend College, Xi’an, China3Zhejiang University, ZJU-Hangzhou Global Science and Technology Innovation Center, Key Laboratory of Advanced Micro/Nano Electronic Devices and Smart Systems of Zhejiang, Hangzhou, China4Ningbo University, Department of Physics, Faculty of Science, Ningbo, Chinashow less
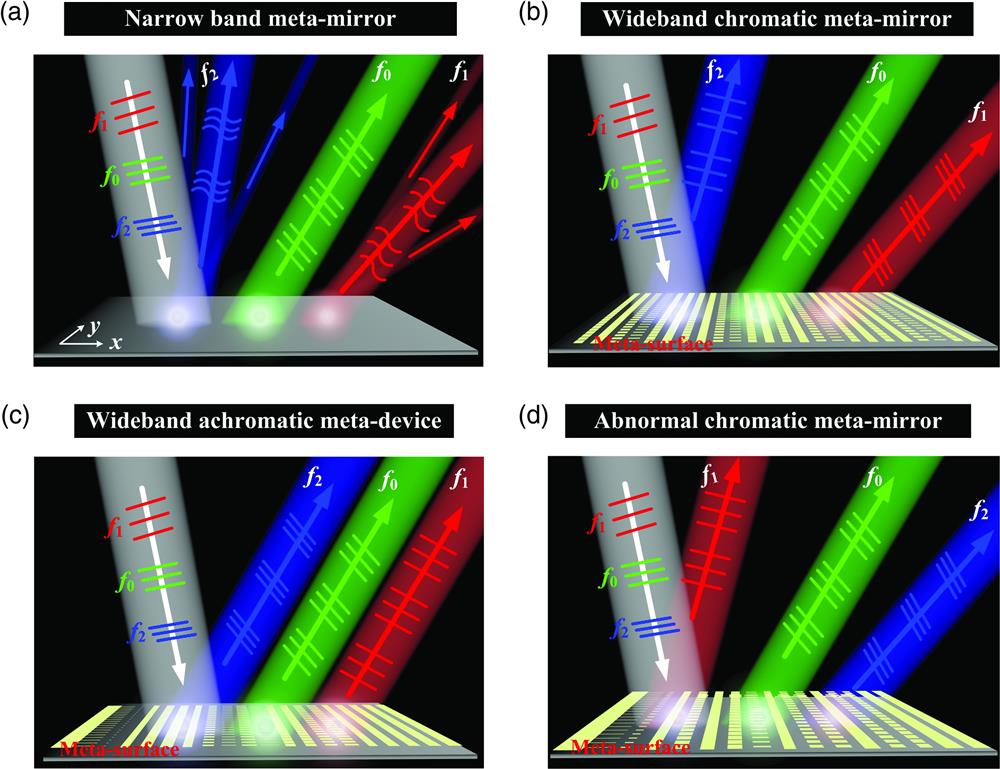
Fig. 1. Schematics and working principles of highly efficient and wideband chromatic aberration-free meta-mirrors. (a) Typical scattering patterns of narrow band meta-mirrors with high performance only at the frequency of , while other scattering modes, such as the specular reflection, appear at nonworking frequencies. Typical scattering patterns of (b) wideband chromatic meta-mirror, (c) achromatic meta-mirror, and (d) abnormal chromatic meta-mirror with high performance within a wide bandwidth. The reflection angle at low frequency is larger than that at high frequency for (a) and (b) for the same phase gradients within the frequency interval from to . The reflection angle for the achromatic meta-mirror is the same as shown in (c). While the reflection angle satisfies a linear function for the abnormal chromatic meta-mirror in (d), the larger frequency exhibits a larger reflection angle. The frequencies satisfy .
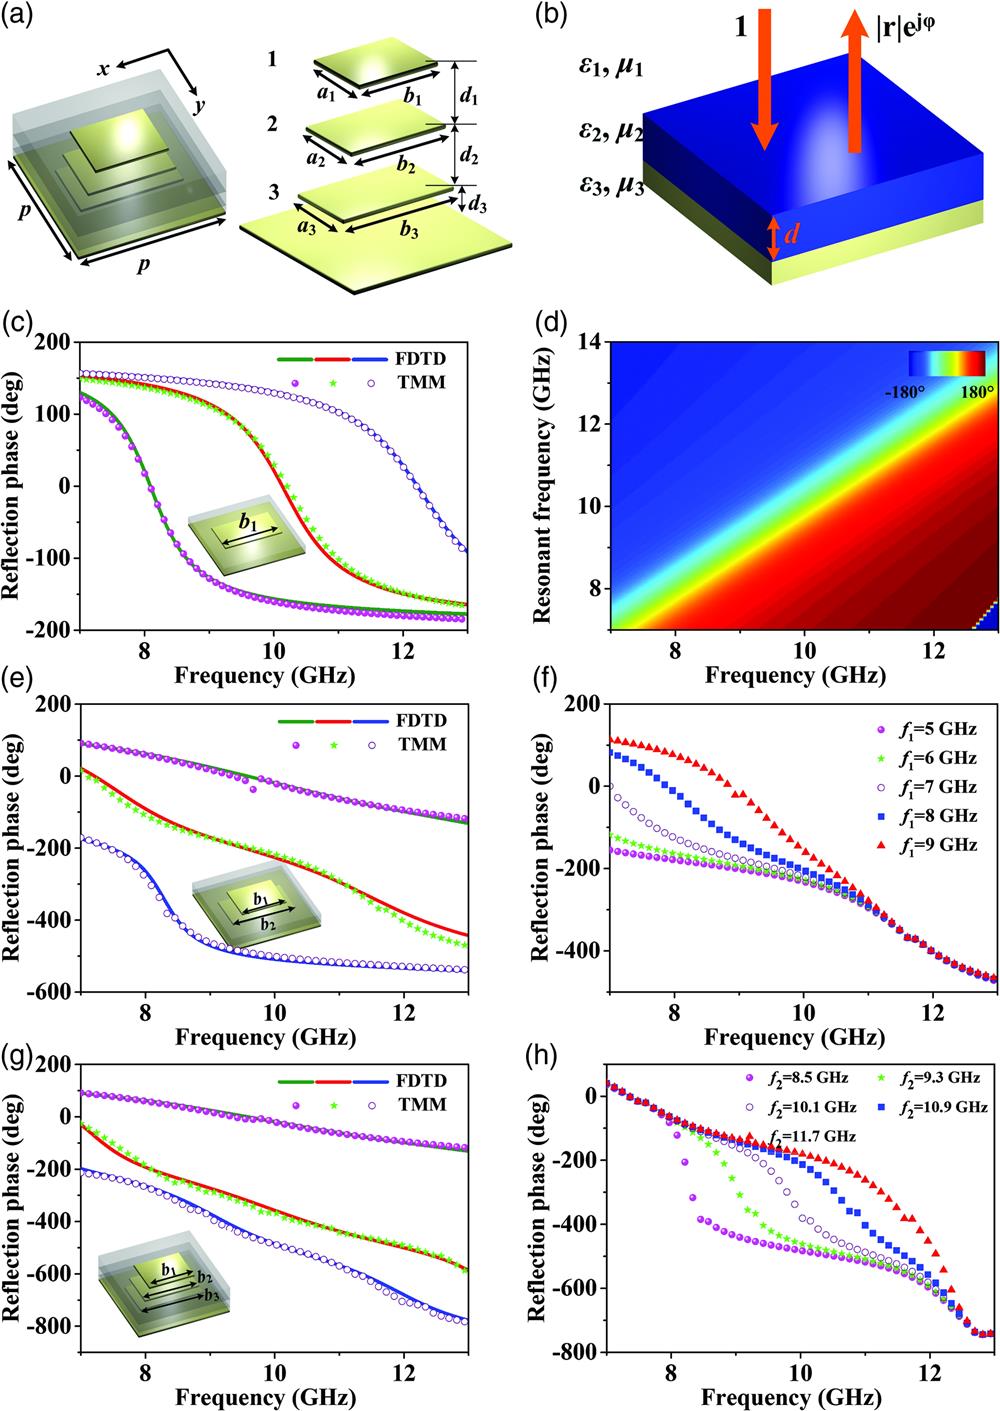
Fig. 2. Meta-atom design and EM response calculated by the TMM on the effective model and FDTD simulations on realistic structures. (a) Schematics of the proposed composite meta-atom composed of four metallic layers separated by three F4B spacers (, , , , ). Other parameters , , and , , are tuned for each meta-atom. (b) The geometry of the proposed effective model to equivalently describe the multiresonant meta-atoms. TMM computed reflection phase spectra with different resonant frequencies and FDTD simulated case with different structural parameters for (c) single-resonant, (e) dual-resonant, and (g) three-resonant elements. The inset shows the corresponding schematics. The polarization is along direction in all cases. For the single resonance at (c), , , 8, and 9.4 mm for the blue, red, and green lines of the FDTD simulations, and , 10.2, and 12.2 GHz for the pink, green, and blue symbols of the TMM calculations. For the double resonances at (e), , , 6, and 9 mm, , 8.2, 9.5 mm for the green, red, and blue lines of the FDTD simulations, and , 6, 5 GHz, , 11.0, 8.3 GHz for the pink, green, and blue symbols of the TMM calculations. For the three resonances at (g), , , , , 8.7, 9.5 mm for the green, red, and blue lines of the FDTD simulations, and , 7.5, 5 GHz, , 10.2, 8.2 GHz, , 12.9, 10.1 GHz for the pink, green, and blue symbols of the TMM calculations. (d) Reflection spectra map as a function of operating frequency and resonant frequency with the plasma frequency fixed at . (f) Dependence of reflection phase spectra at for dual-resonant model computed by TMM with , , and . (h) Dependence of reflection phase spectra on for three-resonant model computed by TMM with , , , , and .
Fig. 3. Design and performance of the achromatic meta-mirror. (a) Theoretically calculated phase profiles at the target frequency band. The pictures on the (b) first layer, (c) second layer, and (d) third layer of the fabricated achromatic meta-mirror. (e) FDTD simulated and (f) measured scattered-field intensity (color map) versus frequency and detected angles at the reflection space of the meta-device shined by -polarized microwaves. (g) The measured (symbols) and simulated (solid line) scattering patterns of our metasurface illuminated by an -polarized wave at the frequency . (h) FDTD simulated and measured absolute efficiencies of the meta-device. All of the electric field intensities are normalized against the maximum value in the spectra.
Fig. 4. Electric field distributions of our meta-device under excitation of -polarized waves. (a) Experimental setup of the near-field measurement. Measured distributions on the plane at the reflection side of our metasurface at (b) 8 GHz, (c) 9 GHz, (d) 10 GHz, (e) 11 GHz, and (f) 12 GHz under excitation of normally incident -polarized waves. All of the electric field spectra are normalized against the maximum value at each frequency.
Fig. 5. Design and performance of our abnormal chromatic meta-mirror. (a) Theoretical calculated reflection phase distributions of 16 meta-atoms against frequencies. (b) Pictures of the fabricated sample of meta-mirror. (c) Measured scattered-field intensity (color map) versus frequency and detecting angles at the reflection space of the metasurface shined by -polarized microwaves. Solid pink stars denote the predesigned deflection angles computed by Eq. (5), while the solid white circles denote the deflection angles calculated by generalized Snell’s law. (d) The measured distributions on the plane at frequencies of 8 to 12 GHz in the step of 1 GHz. (e) Simulated and measured absolute efficiencies of the abnormal chromatic meta-mirror. All field values are normalized against the maximum value in the corresponding spectra/patterns.