• Photonics Research
  • Vol. 11, Issue 7, 1303 (2023)
Lijie Wang1、3, Tsz Him Chow2, Malte Oppermann1、4, Jianfang Wang2, and Majed Chergui1、*
Author Affiliations
  • 1Laboratory of Ultrafast Spectroscopy, ISIC and Lausanne Centre for Ultrafast Science (LACUS), École Polytechnique Fédérale de Lausanne (EPFL), CH-1015 Lausanne, Switzerland
  • 2Department of Physics, The Chinese University of Hong Kong, Shatin, Hong Kong SAR, China
  • 3Present address: Division of Physical Science and Engineering, King Abdullah University of Science and Technology (KAUST), Thuwal, Kingdom of Saudi Arabia
  • 4Present address: Chemistry Department, University of Basel, 4001 Basel, Switzerland
  • show less
    DOI: 10.1364/PRJ.487784 Cite this Article Set citation alerts
    Lijie Wang, Tsz Him Chow, Malte Oppermann, Jianfang Wang, Majed Chergui. Giant two-photon absorption of anatase TiO2 in Au/TiO2 core-shell nanoparticles[J]. Photonics Research, 2023, 11(7): 1303 Copy Citation Text show less
    Steady-state absorption spectra of the samples investigated in this work. The two pink arrows show the LSPR peaks of Au/SiO2 and Au/TiO2 NPs, respectively, and the inset zooms into the LSPR part of the Au/SiO2 and Au/TiO2 NPs; all NPs are dispersed in aqueous solution.
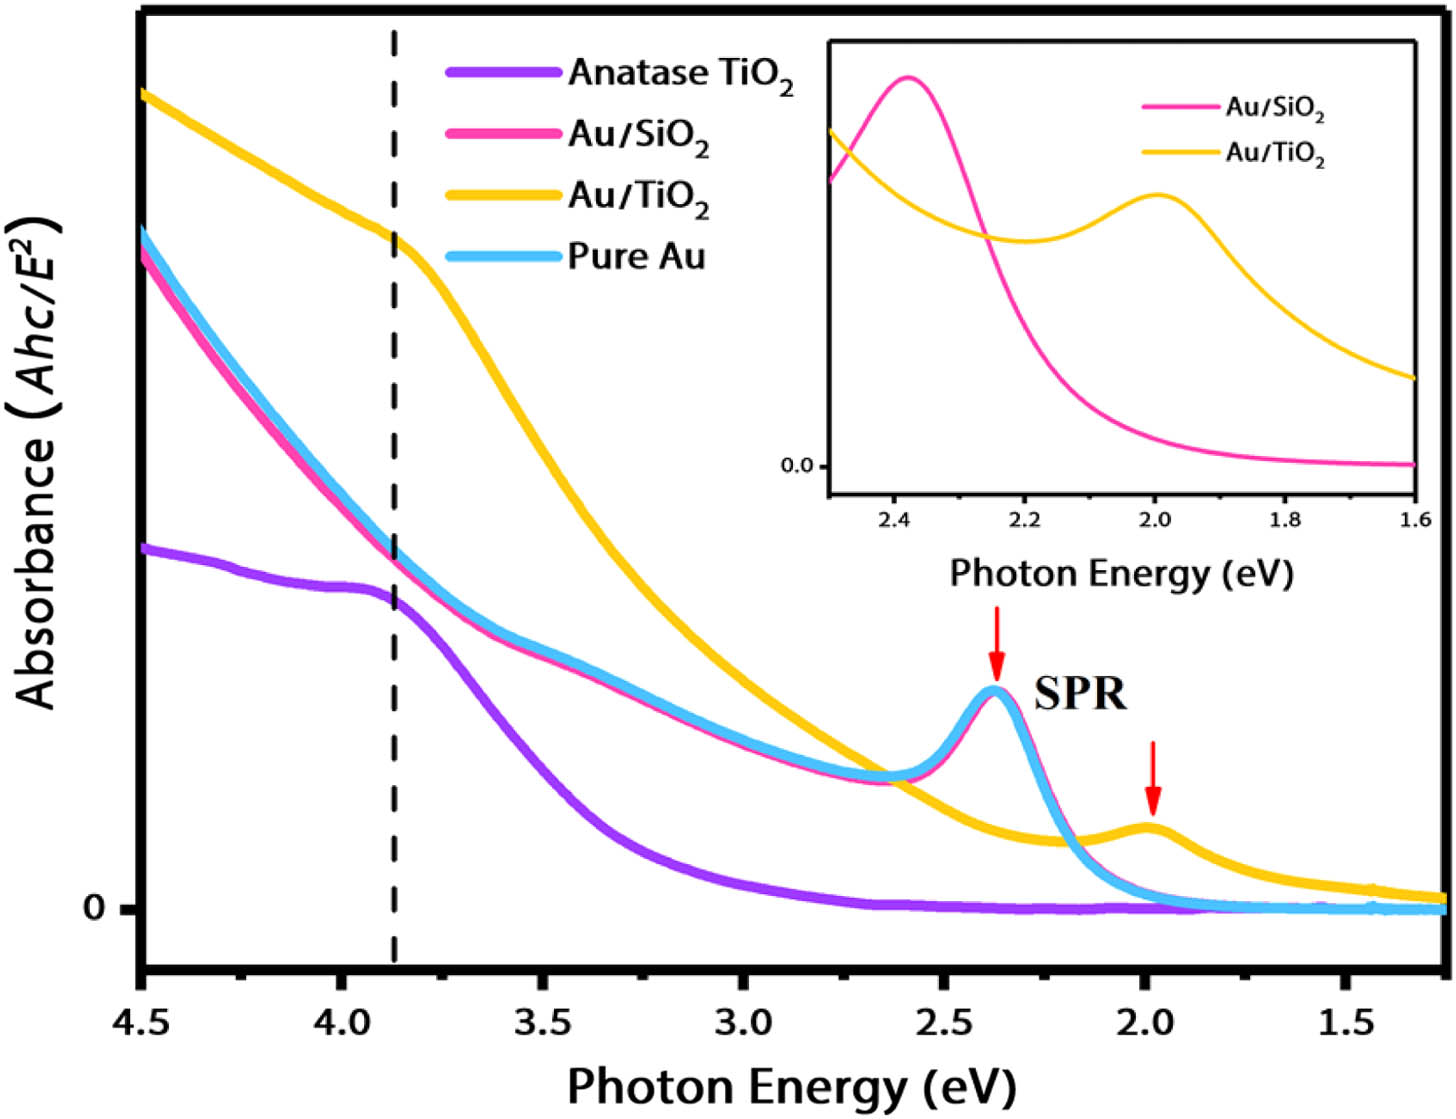
    Fig. 1. Steady-state absorption spectra of the samples investigated in this work. The two pink arrows show the LSPR peaks of Au/SiO2 and Au/TiO2 NPs, respectively, and the inset zooms into the LSPR part of the Au/SiO2 and Au/TiO2 NPs; all NPs are dispersed in aqueous solution.
    Time-energy TA maps and the corresponding spectral traces at 1, 100, and 800 ps. (a), (b) Bare anatase TiO2 NPs upon above-BG excitation (4.0 eV); (c), (d) Au/SiO2 NPs upon plasmon excitation (2.0–2.4 eV); (e), (f) Au/TiO2 NPs upon plasmon excitation (2.0–2.4 eV) with a fluence of ∼330 μJ/cm2; all NPs are dispersed in aqueous solution.
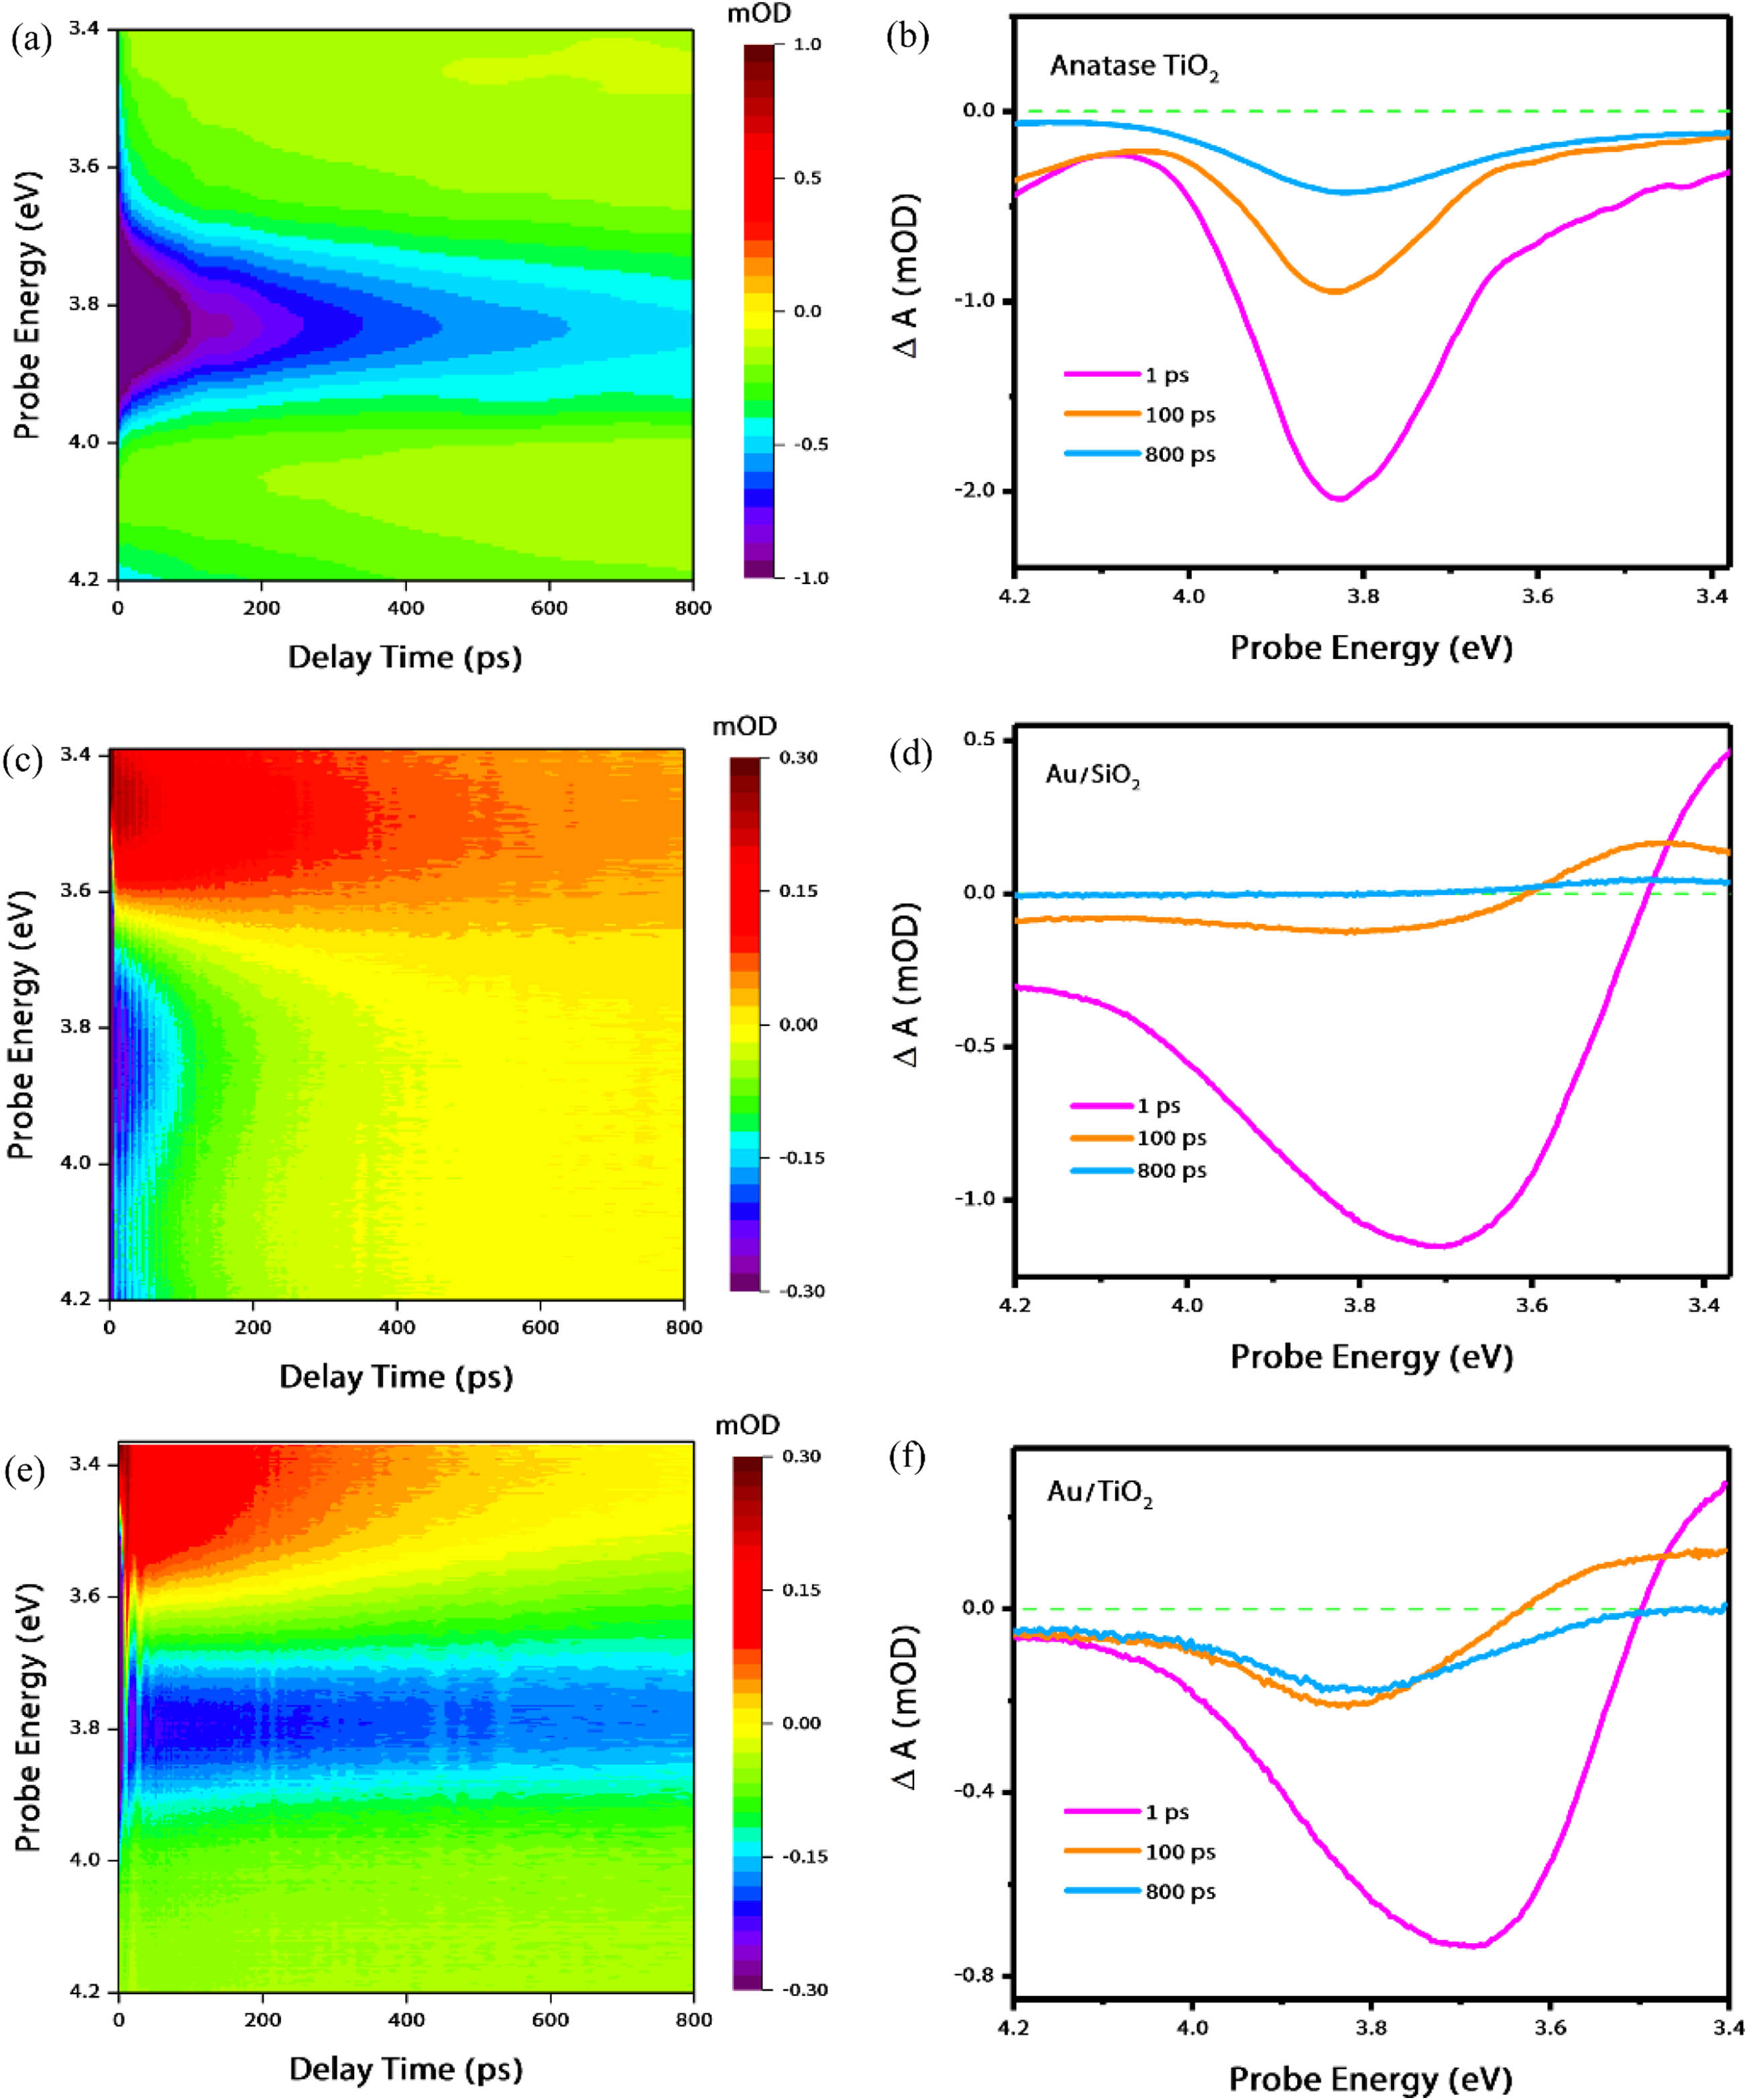
    Fig. 2. Time-energy TA maps and the corresponding spectral traces at 1, 100, and 800 ps. (a), (b) Bare anatase TiO2 NPs upon above-BG excitation (4.0 eV); (c), (d) Au/SiO2 NPs upon plasmon excitation (2.0–2.4 eV); (e), (f) Au/TiO2 NPs upon plasmon excitation (2.0–2.4 eV) with a fluence of 330  μJ/cm2; all NPs are dispersed in aqueous solution.
    Fluence dependence of the bands appearing in the plasmon-excited TA spectra of Au/SiO2 NPs at 50 ps time delay, displayed as a log–log plot of TA intensity versus pump fluence: (a) 3.4 eV and (b) 3.8 eV.
    Fig. 3. Fluence dependence of the bands appearing in the plasmon-excited TA spectra of Au/SiO2 NPs at 50 ps time delay, displayed as a log–log plot of TA intensity versus pump fluence: (a) 3.4 eV and (b) 3.8 eV.
    Comparison of the TA spectra of the three measured samples (rescaled for clarity). The blue solid line is the transient response of bare anatase TiO2 at a delay time of 800 ps upon UV excitation (above-BG excitation, 4.0 eV). The orange and red lines represent the TA spectra of Au/SiO2 and Au/TiO2 at a time delay of 800 ps upon plasmon excitation (below-BG excitation, 2.0–2.4 eV), with a fluence of ∼330 μJ/cm2.
    Fig. 4. Comparison of the TA spectra of the three measured samples (rescaled for clarity). The blue solid line is the transient response of bare anatase TiO2 at a delay time of 800 ps upon UV excitation (above-BG excitation, 4.0 eV). The orange and red lines represent the TA spectra of Au/SiO2 and Au/TiO2 at a time delay of 800 ps upon plasmon excitation (below-BG excitation, 2.0–2.4 eV), with a fluence of 330  μJ/cm2.
    Comparison of the TA time traces between Au/SiO2 and Au/TiO2 NPs at probe energies of (a), (b) 3.8 eV; (c), (d) 3.4 eV within (a), (c) 200 ps; (b), (d) 800 ps. The TiO2 was excited above the BG, while the Au/SiO2 and Au/TiO2 were excited upon plasmon excitation, and all the samples are excited with a fluence of ∼330 μJ/cm2. The blue and orange circles are experimental traces; the red and purple solid lines are the fitted time traces.
    Fig. 5. Comparison of the TA time traces between Au/SiO2 and Au/TiO2 NPs at probe energies of (a), (b) 3.8 eV; (c), (d) 3.4 eV within (a), (c) 200 ps; (b), (d) 800 ps. The TiO2 was excited above the BG, while the Au/SiO2 and Au/TiO2 were excited upon plasmon excitation, and all the samples are excited with a fluence of 330  μJ/cm2. The blue and orange circles are experimental traces; the red and purple solid lines are the fitted time traces.
    Fluence dependence of the 3.8 eV band of TA spectra of Au/TiO2 NPs excited at the LSPR of the Au core, displayed as a log–log plot of TA intensity versus pump fluence, which varies in a range from 0.16 to 0.98 mJ/cm2: (a) 10 ps, (b) 50 ps, and (c) 800 ps. At 800 ps, the positive contribution due to the Au has died away. The magenta dots are the experimental values, and the solid cyan lines represent their fits with a linear function.
    Fig. 6. Fluence dependence of the 3.8 eV band of TA spectra of Au/TiO2 NPs excited at the LSPR of the Au core, displayed as a log–log plot of TA intensity versus pump fluence, which varies in a range from 0.16 to 0.98  mJ/cm2: (a) 10 ps, (b) 50 ps, and (c) 800 ps. At 800 ps, the positive contribution due to the Au has died away. The magenta dots are the experimental values, and the solid cyan lines represent their fits with a linear function.
    Time dependence of the slopes of the fluence dependence of the Au/TiO2 NPs at 3.8 eV. The solid line relates to the fit using the biexponential model with time constants of τ1=49.5 ps and τ2>2000 ps.
    Fig. 7. Time dependence of the slopes of the fluence dependence of the Au/TiO2 NPs at 3.8 eV. The solid line relates to the fit using the biexponential model with time constants of τ1=49.5  ps and τ2>2000  ps.
    TA spectra at 10 ps of (a) bare TiO2 NPs, (b) Au/SiO2, and (c) Au/TiO2. All samples are excited at the plasmon resonance (2.0–2.4 eV) for different values of the fluence.
    Fig. 8. TA spectra at 10 ps of (a) bare TiO2 NPs, (b) Au/SiO2, and (c) Au/TiO2. All samples are excited at the plasmon resonance (2.0–2.4 eV) for different values of the fluence.
    Fluence dependence of the Au/TiO2 NPs at 3.4 eV, displayed as a log–log plot of TA intensity versus pump fluence, which varies in a range from 0.16 to 0.98 mJ/cm2: (a) at 10 ps and (b) at 50 ps.
    Fig. 9. Fluence dependence of the Au/TiO2 NPs at 3.4 eV, displayed as a log–log plot of TA intensity versus pump fluence, which varies in a range from 0.16 to 0.98  mJ/cm2: (a) at 10 ps and (b) at 50 ps.
    Transmission electron microscopy images of (a) pure Au NPs, (b) Au/SiO2 NPs, and (c) Au/TiO2 NPs. Below is a diagram of the ultrafast broadband deep-to-near-UV spectroscopy setup, detailing the broadband pump-probe experiment after the noncollinear optical parametric amplifier. The blue dashed box shows the schematic of the achromatic doubling, adapted from Ref. [43]: BS, beam splitter; M, mirror; MM, multilayer mirror; CM, chirped mirror; SM, spherical mirror; PM, off-axis parabolic mirror; P, prism; L, lens; F, multimode fiber.
    Fig. 10. Transmission electron microscopy images of (a) pure Au NPs, (b) Au/SiO2 NPs, and (c) Au/TiO2 NPs. Below is a diagram of the ultrafast broadband deep-to-near-UV spectroscopy setup, detailing the broadband pump-probe experiment after the noncollinear optical parametric amplifier. The blue dashed box shows the schematic of the achromatic doubling, adapted from Ref. [43]: BS, beam splitter; M, mirror; MM, multilayer mirror; CM, chirped mirror; SM, spherical mirror; PM, off-axis parabolic mirror; P, prism; L, lens; F, multimode fiber.
    Lijie Wang, Tsz Him Chow, Malte Oppermann, Jianfang Wang, Majed Chergui. Giant two-photon absorption of anatase TiO2 in Au/TiO2 core-shell nanoparticles[J]. Photonics Research, 2023, 11(7): 1303
    Download Citation