1Laboratory of Ultrafast Spectroscopy, ISIC and Lausanne Centre for Ultrafast Science (LACUS), École Polytechnique Fédérale de Lausanne (EPFL), CH-1015 Lausanne, Switzerland
2Department of Physics, The Chinese University of Hong Kong, Shatin, Hong Kong SAR, China
3Present address: Division of Physical Science and Engineering, King Abdullah University of Science and Technology (KAUST), Thuwal, Kingdom of Saudi Arabia
4Present address: Chemistry Department, University of Basel, 4001 Basel, Switzerland
We report on deep-to-near-UV transient absorption spectra of core-shell and nanoparticles (NPs) excited at the surface plasmon resonance of the Au core, and of UV-excited bare anatase NPs. The bleaching of the first excitonic transition of anatase at is a signature of the presence of electrons/holes in the conduction band (CB)/valence band (VB) of the material. We find that while in bare anatase NPs, two-photon excitation does not occur up to the highest used fluences (), it takes place in the shell at moderate fluences () in core-shell NPs, as a result of an enhancement due to the plasmon resonance. We estimate the enhancement factor to be of the order of . Remarkably, we observe that the bleach of the 3.8 eV band of lives significantly longer than in bare , suggesting that the excess electrons/holes in the conduction/valence band are stored longer in this material.
1. INTRODUCTION
Transition metal oxides (TMOs) have been attracting growing interest as candidates for nonlinear (NL) optical materials, due to their high optical nonlinearities, ultrafast response times, and low absorption indices [1,2]. TMOs are also the prime candidates for transparent conductive oxides (TCOs), because of their large bandgap and transparent and conducting properties, whose films are utilized in flat panel displays [3], solar cells [4], and electroluminescent devices as transparent electrodes [5].
Being one of the most commonly investigated TMOs, in its various polymorphs (anatase, rutile, and amorphous) also possesses remarkable properties, such as the high stability of its excitonic transitions to perturbations such as defects, temperature [6], and excess charge doping [7]. For all optical switching applications, anatase thin films exhibit an interesting fast and reasonably large NL optical response at 800 nm [1]. It was, however, noted that the physical properties and, thus, the NL optical response of films are strongly dependent on the processing route [8], as well as on the inclusion of metallic nanoparticles (NPs) [9,10].
Measurements of the NL optical properties of polymer nanocomposites demonstrated negligible two-photon absorption (TPA) and a negative value of the NL refractive index [11]. This is in line with reports showing no TPA of anatase NPs in solution even up to fluences of [12,13]. On the other hand, large second- and third-order optical nonlinearities of the composite films were observed and attributed to the high density of Au particles in nonconductive films, and the strong local field enhancement caused by the localized surface plasmon resonance (LSPR) absorption [14]. In particular, it was reported that composites can exhibit a self-defocusing and saturating nonlinearity at optical intensities up to , while measurements on a pure film did not show any nonlinearity [15].
Stable core-shell and NPs were reported to exhibit saturable absorption or optical limiting at 532 nm nanosecond-pulse excitation, depending on the applied laser fluence [16]. This behavior was explained in terms of the electronic Kerr nonlinearities and NL scattering in the NPs. The samples were subject to laser fluences up to and powers up to , and showed no appreciable signs of laser-induced damage, making them promising candidates for high energy optical limiting [16]. It has also been noted that Au NP-doped multilayers such as and films can be used as optical filters, due to their high damage threshold and their larger third-order NL susceptibilities.
It has been established that excitation of the LSPR band of Au NPs deposited on or embedded in films leads to injection of electrons from the Au NP into [17–23]. Just as for dye-sensitized NPs, probing and time-resolving the electron injection from molecular dyes into was performed using visible-to-THz probes [18,21,23,24], X-ray absorption spectroscopy (XAS) at the Ti K-edge [12,25,26], and, more recently, X-ray photoelectron spectroscopy sensitive to the Au - and Ti -orbitals [27]. Overall, the optical-domain pump-probe studies concluded that electron injection is prompt, within the cross correlation of the experiments (typ. ), and takes place with an efficiency reaching 40%–50% [18,23]. It should be stressed that these time-resolved experiments concerned Au NPs deposited on surfaces [18,24,27] or embedded in films [23], and were all carried out in the linear regime of pump-pulse intensity.
Thus, it appears that the Au NPs can influence the optical properties of the system in different ways: electron injection and/or enhanced NL effects (e.g. TPA, saturable absorption) due to the presence of the plasmon field. To weigh these various contributions, it is important to have simultaneously spectroscopic fingerprints of the presence of electrons in the conduction band (CB) of and of the Au NP transitions, as well as their temporal evolutions. This has not been the case in any of the above-mentioned studies reporting TPA in composite materials.
In recent years, Baldini et al. [6,13,28] carried out a thorough investigation of the spectroscopy and charge carrier dynamics of bare anatase NPs using pump-probe spectroscopy in the deep-ultraviolet (3.3–4.6 eV). In particular, they identified the first excitonic transition of the system at and showed that it could be used as a marker of electron injection in dye-sensitized NPs, by detecting its bleaching due to the blocking of the transition that results from the excess of electrons/holes in the CB/valence band (VB). Further to this, Wang et al. [29–31] used the same tools to investigate the spectroscopy and charge carrier cooling in Au NPs. The novelty of the latter work lies in the fact that they probed the region of interband transitions of the Au NPs for the first time. Thus, in the present case, the deep-UV probe offers the advantage that the characteristic transitions of both the Au core and the shell fall in the same spectral region, so that their behavior can be simultaneously monitored.
Here we investigate the response of NPs in aqueous solution using pump-probe TA spectroscopy upon resonant excitation of the LSPR of the Au NP core in the visible, while the probing is done using the deep-UV broadband continuum. By detecting the excitonic transition of anatase when excessive electrons/holes are present in the CB/VB [13], we get insights into the excitation mechanism of the system. We compare these results with LSPR-excited core-shell NPs and above the bandgap (BG) excited bare NPs. The BG of is too large (7.5 to 9.6 eV) for any electron injection from the excited Au core to take place, or it would require absorption by three to four visible photons, which is a very low-probability event. We observe that at pump energies resonant with the LSPR of the Au core, efficient TPA of anatase promotes electrons from the VB directly into the CB by simultaneously absorbing two green photons. Even at higher pump fluences, no TPA is observed in the case of bare . We also find that the excess electrons/holes generated in the CB/VB have a significantly longer lifetime than in bare , offering a strategy to store charges. The experimental setup and procedures are presented in the appendix.
2. RESULTS AND DISCUSSION
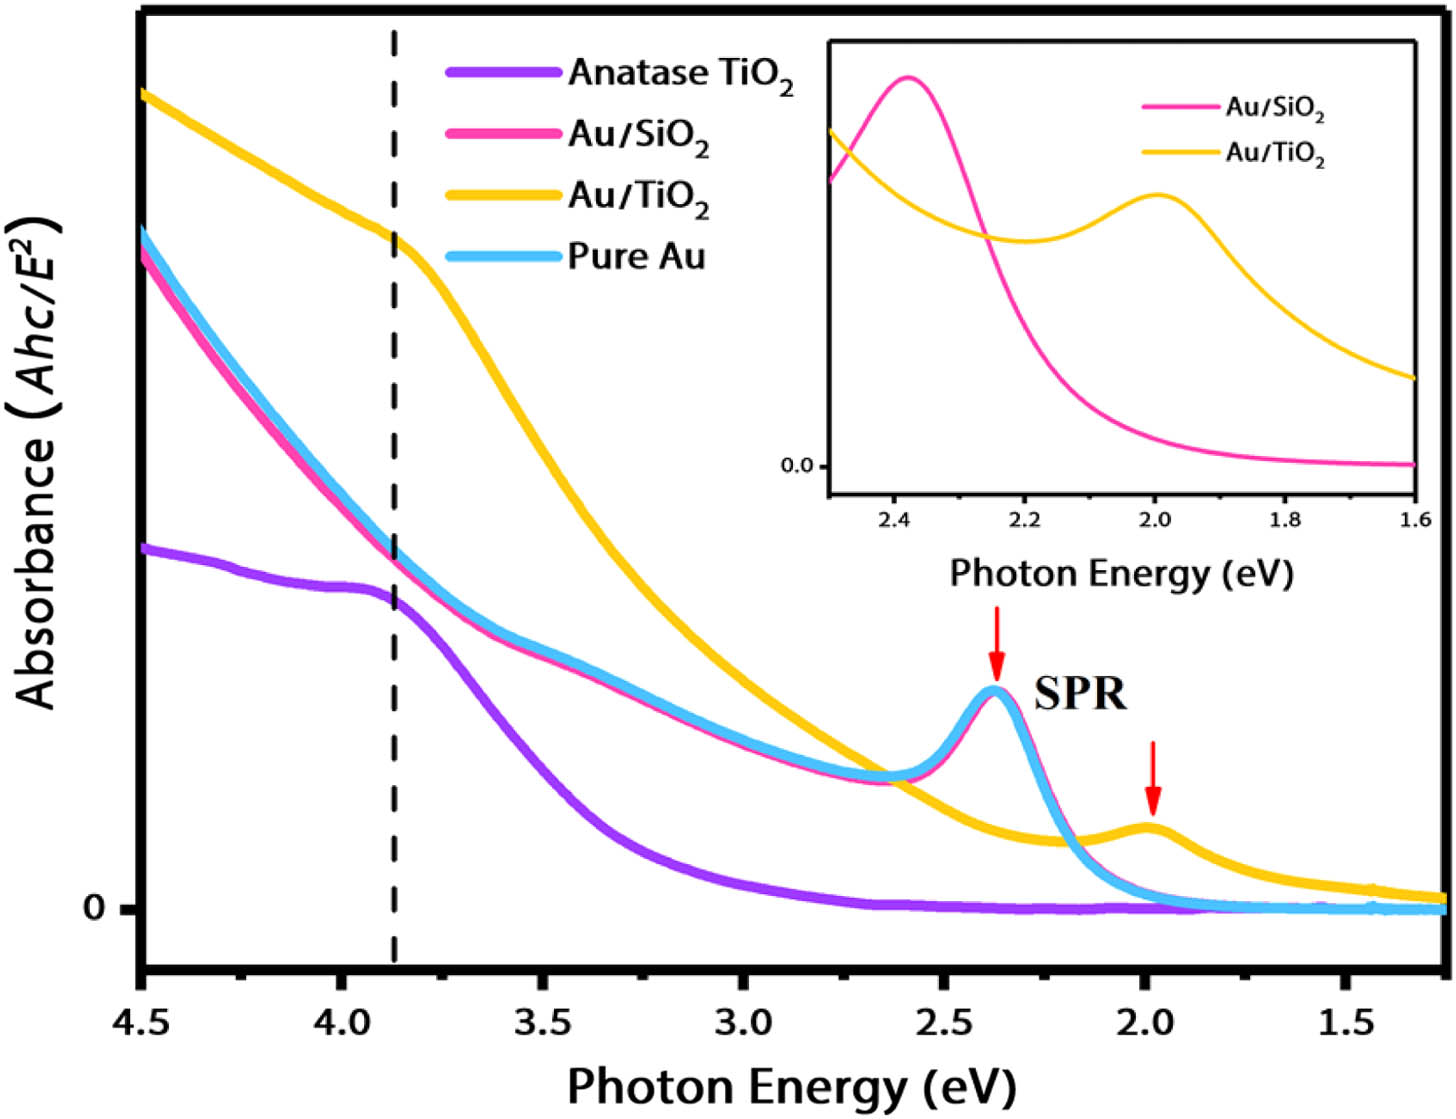
Figure 1 shows the absorption spectra of bare anatase and bare Au NPs, as well as core-shell and NPs; the inset zooms into the region of the LSPR band of and NPs. The bare anatase NP shows the well-known absorption with a wing extending down to , due to scattering. The shoulder at corresponds to the first excitonic transition of anatase , as previously discussed in detail [6]. The spectra of -diameter bare Au and NPs are almost identical with both exhibiting the LSPR band at , and at higher energies, the region of interband transitions, discussed in Refs. [29,30]. In the case of core-shell NPs, the LSPR band shifts to the red by and exhibits a red wing extending down to spectrum. Its spectrum is similar to that of -diameter Au NPs embedded in a film [23]. The red shift of the LSPR in compared to is fully accounted for by the dielectric effects [23,32].
Figure 1.Steady-state absorption spectra of the samples investigated in this work. The two pink arrows show the LSPR peaks of and NPs, respectively, and the inset zooms into the LSPR part of the and NPs; all NPs are dispersed in aqueous solution.
Figure 2 shows the time-energy deep-UV transient absorption (TA) maps and the corresponding TA spectra at different time delays of the three samples: bare anatase NPs excited at 4.0 eV above the BG, and and core-shell NPs excited into the Au LSPR band at 2.0–2.4 eV. The TA of bare anatase NPs [Fig. 2(a)] is identical to what was reported in Refs. [6,28]. The TA spectra of bare anatase at 1, 100, and 800 ps time delay [Fig. 2(b)] clearly exhibit a negative (bleach) signal over the entire probe range with a band centered at , which represents the first excitonic transition of anatase [6]. The bleach signal is due to electrons/holes generated by BG excitation into the CB/VB of . Figure 2(c) shows the TA map for NPs excited with a broadband pulse (2–2.4 eV) at the LSPR, and Fig. 2(d) shows the TA spectra. These results are close to those we recently reported for the case of bare Au NPs of identical size [29,30]. The TA maps and spectra for NPs exhibit three main features: two negative ones at and , and a positive one at . Briefly, they were identified in Refs. [29,30] using the band structure diagram of bulk Au, as interband transitions from the valence band to the band above the Fermi level at the and symmetry points for the two negative ones, monitoring the population of electrons and holes, above and below the Fermi level, respectively. The positive band was identified as a transition between valence sub-bands (i.e. an intraband transition), monitoring the population of holes. The overall conclusion was that charge carrier cooling is slow () and commensurate with the time scale of thermal lattice cooling (). The fluence dependence of the 3.4 and 3.8 eV bands at a time delay of 50 ps is shown in Fig. 3, and it clearly reflects a one-photon excitation process.
Figure 2.Time-energy TA maps and the corresponding spectral traces at 1, 100, and 800 ps. (a), (b) Bare anatase NPs upon above-BG excitation (4.0 eV); (c), (d) NPs upon plasmon excitation (2.0–2.4 eV); (e), (f) NPs upon plasmon excitation (2.0–2.4 eV) with a fluence of μ; all NPs are dispersed in aqueous solution.
Figure 3.Fluence dependence of the bands appearing in the plasmon-excited TA spectra of NPs at 50 ps time delay, displayed as a log–log plot of TA intensity versus pump fluence: (a) 3.4 eV and (b) 3.8 eV.
Figures 2(e) and 2(f) show the TA maps and spectra for the NPs excited by a 2.0–2.4 eV broadband pulse. Compared to Figs. 2(c) and 2(d), some notable differences but also similarities arise. First, the positive signal (due to holes in the Au core) is shorter-lived in . Second, a band shows up centered at (the early time signal at this band is due to the Au NP, but it dramatically decays within , as observed in the case). Thereafter, the bleach signal persists up to the longest time of our temporal window. Figure 4 compares the 800 ps transients for the three samples. For the sample, the signal has all but died away, except for the weak remnant of the positive feature . However, the signal for bare anatase and NPs exhibits the same bleach feature at 3.8–3.83 eV. Given that the equivalent band due to the Au core has fully decayed, we conclude that this is the bleach due to electrons/holes in the CB/VB of the shell in NPs [13,28]. This is further supported by Fig. 5, which shows the time profiles of the 3.8 and 3.4 eV bands for both core-shell NPs. Finally, the features in do not show up in the case of , due to the fact that the Au contribution to the transient is shaded by the strong absorption of in this region.
Figure 4.Comparison of the TA spectra of the three measured samples (rescaled for clarity). The blue solid line is the transient response of bare anatase at a delay time of 800 ps upon UV excitation (above-BG excitation, 4.0 eV). The orange and red lines represent the TA spectra of and at a time delay of 800 ps upon plasmon excitation (below-BG excitation, 2.0–2.4 eV), with a fluence of μ.
Figure 5.Comparison of the TA time traces between and NPs at probe energies of (a), (b) 3.8 eV; (c), (d) 3.4 eV within (a), (c) 200 ps; (b), (d) 800 ps. The was excited above the BG, while the and were excited upon plasmon excitation, and all the samples are excited with a fluence of μ. The blue and orange circles are experimental traces; the red and purple solid lines are the fitted time traces.
The main observation here is the long-lived bleach band in NPs at the position () of the first excitonic transition of anatase . Excess electrons/holes in the CB/VB could either originate from the electrons transferred from the VB of or the injected electrons from Au NPs. The presence of the intraband transition of Au at is indicative of holes in the Au NP core, due to electrons that have been removed from below the Fermi level upon LSPR excitation. They may end up in the CB of as expected in the scenario of plasmon-induced electron injection into the shell, typically within hundreds of femtoseconds [18,23]. However, the time scales of the band around and are not commensurate, implying that hole decay in the Au core is not due to a back-electron transfer from , but rather by the kinetics of charge carrier cooling just as in NPs [29,30]. Of course, the decay time of the 3.4 eV band is shorter here, which may point to an influence of the shell. This is not surprising considering the way the latter affects the spectral features of the Au core (Fig. 1). In summary, it appears that the feature consists of three contributions: one at very early times, due to charge injection from the Au core; the second at early to somewhat later times due to the response of the Au interband transitions (close to that of NPs); and a third one that persists up to the longest time delay, which is due to the bleached excitonic band.
Further insight into the origin of the population mechanisms in the CB of is given by the fluence dependence of the various bands at short (10 ps), intermediate (50 ps), and long (800 ps) time delays (see Appendix C). Figures 6(a)–6(c) show log–log plots of the signals of at at these time delays for pump fluences ranging from 0.16 to . The slopes of the signal are , , and at 10, 50, and 800 ps time delay, respectively. While the latter points to a predominant two-photon process, the former two point to a regime intermediate between one- and two-photon absorption. Further, these slopes reflect an increasing weight of the TPA-induced signal as a function of time. This can be rationalized by noting that the signal contains the contributions of the interband transition of the Au NP, the electron injected via LSPR excitation, and the excitonic transition of anatase . As already mentioned, the first contribution, which dies away in , has a linear dependence on the pump fluence (Fig. 3). The second contribution, also linear with pump fluence, dies away much faster () according to Refs. [23,27]. Therefore, at 10 and 50 ps delays, it is present [as seen in Figs. 2(c) and 2(d)], while at 800 ps it has vanished. In the latter case, we are left with a predominant TPA contribution that involves the shell. This process is of course present from the earliest times onwards but is overlapped by the above one-photon contributions. Figure 7 shows the value of the signal slope as a function of time. We assume a maximum value of 2 at infinite times, considering that all signals due to the Au core have died away. The biexponential fit of the data point yields values of and with uncertainties of a factor of 2. Bearing in mind the latter, it is fair to say that the first component decays on comparable time scales to its counterpart in NPs, as is actually the case with the 3.4 eV band [Figs. 2(c) and 2(d)].
Figure 6.Fluence dependence of the 3.8 eV band of TA spectra of NPs excited at the LSPR of the Au core, displayed as a log–log plot of TA intensity versus pump fluence, which varies in a range from 0.16 to : (a) 10 ps, (b) 50 ps, and (c) 800 ps. At 800 ps, the positive contribution due to the Au has died away. The magenta dots are the experimental values, and the solid cyan lines represent their fits with a linear function.
Figure 7.Time dependence of the slopes of the fluence dependence of the NPs at 3.8 eV. The solid line relates to the fit using the biexponential model with time constants of and .
Finally, the fact that three contributions are at play is visible from Fig. 8, which shows the change of profile of the TA spectra at 10 ps time delay for increasing fluences under visible (2.0–2.4 eV) excitation. Whilst for the TA profile does not change with pump fluence [Fig. 8(b)], for clear changes are observed with the growth of a blue shifted bleach band implying that the TPA-induced excitonic bleach is taking over the overall bleach contribution with increasing pump power [Fig. 8(c)]. Note that for bare , there is no effect on the TA spectra over the same range of fluences, implying no signal indicative of charge carriers in the VB/CB. To further make the point about the two-photon process causing the bleach of the 3.8 eV band, Fig. 9 shows the log–log plots of the signal due to the band of NPs at 10 ps and 50 ps, respectively. Its slope is close to 1 (bearing in mind the large error bars), which is reasonable since this band is due to holes in the Au core caused by the LSPR excitation [29]. Note that the 3.4 eV band is at the limit of our detection, and therefore its signal at 50 ps is weak, which explains the relatively large uncertainty of its slope.
Figure 8.TA spectra at 10 ps of (a) bare NPs, (b) , and (c) . All samples are excited at the plasmon resonance (2.0–2.4 eV) for different values of the fluence.
Figure 9.Fluence dependence of the NPs at 3.4 eV, displayed as a log–log plot of TA intensity versus pump fluence, which varies in a range from 0.16 to : (a) at 10 ps and (b) at 50 ps.
Coming back to the signal, one may ask whether the early time one-photon absorption signal could be due to injection of electrons from the Au core [18,21,33], which then decay on a time scale. This might be excluded because: first, it is not supported by the shape of the transients in Fig. 8(b); second, its decay is comparable to what was reported for the same band in NPs [29,30]; and, third, as was shown by Ratchford et al. [23] in the case of Au NPs embedded in films, the injected electrons have a fast decay () followed by a long-lived (on the window of 20 ps of their time scan) weak component. We can therefore conclude that the early time signal is largely due to the response of the Au core. This does not exclude a response due to injected electrons, but their contribution is short-lived. The bleach signal at 800 ps time delay, when the signal of the Au core has died away, is therefore due to the excitonic bleach only. Its slope of 1 reflects the fact that the electrons/holes in the CB/VB of have been generated via a TPA process. Again, we stress that the same range of fluences does not show any signal in bare NPs, which would be due to electrons/holes in the CB/VB [Fig. 8(a)]. This is in line with previous studies, which used fluences up to of a 10 ps/532 nm laser [12], i.e., two orders of magnitude larger than in the present case, showing no evidence of two-photon excitation. In Ref. [13], femtosecond pulse excitation at either 400 nm or 550 nm with fluences up to also showed no sign of multiphoton excitation. On the other hand, in the case of dye-sensitized NP, the fluence dependence of the band due to injected electrons remained in the linear regime up to μ using 550 nm excitation. These observations lead us to conclude that the occurrence of multiphoton excitation of in core-shell NPs is due to the presence of the Au core and is mediated by the resonance excitation of its LSPR.
We estimated the enhancement factor of the TPA of in NPs, as described in Appendix D. Based on our experimental TA intensity (we took an average value of at 3.8 eV, over the 10–200 ps range), from Fig. 2(e), we calculate that in NPs, the enhancement factor of the third-order NL two-photon process is . This is consistent with the results of surface-enhanced Raman scattering (SERS) [34,35] utilizing LSPR of nanostructured metallic NPs (e.g. Au, Ag, Cu) to amplify Raman signals of molecules at their surface with enhancement factors of . It is also reported that the quantum yield of fluorescence in Au nanorods compared to a bulk metal surface is enhanced by a factor of more than 1 million [36,37]. In addition, simulations show that the enhancement of the molecular TPA cross section by the LSPR may reach many orders of magnitude, depending on the distance of the NPs and the local field [38,39].
This huge enhancement of the TPA cross section in the case of core-shell NPs should be contrasted to the linear dependence reported in the case of Au NP charge injection into anatase [17–23]. This suggests that the architecture of NPs deposited on the surface of does not favor LSPR enhancement of TPA, which is likely caused by the limited contact interface with the NP in this architecture [18,24,27]. The case of Au NP embedded in the film [23] is close to the core-shell architecture (although the Au NPs are densely stacked), but the upper fluence used in their work is close to the lowest in ours. It is also interesting to note that while on the short time scale (), the decay of the signal due to injected electrons is faster in the , but leaves a weak long component, we observe that for the long time case, the excitonic bleach survives for significantly longer time than in bare NPs [Fig. 5(b)]. The short time decay is probably due to injected electrons that go back to the Au NP, as also suggested by Borgwardt et al. [27], while the long-time component in their work may correspond to the one we observe here.
3. CONCLUSION
This paper reports on two remarkable observations: first, TPA in occurs, and is initiated already at mild fluences; and, second, a longer-lived excitonic bleach of compared to the bare NPs, implying that the presence of the Au core “blocks” the electron–hole recombination in the shell. It is not clear what mechanism could be behind this behavior, as the charge carrier dynamics in the Au core is over, while the bleach of the excitonic band goes on up to the time limit of our detection. Nevertheless, that electrons/holes in the CB/VB are present for a long time deserves further investigation as it opens perspectives in terms of charge storage in a TMO, with possible applications in the field of TCO and photocatalysis.
Acknowledgment
Acknowledgment. The authors thank Dr. L. Mewes, Dr. M. Puppin, and B. Bauer for helpful discussions. L.W. acknowledges support from the China Scholarship Council (CSC).
APPENDIX A: SAMPLE PREPARATION
Growth of the Au NPs: The Au NPs samples were synthesized through a seed-mediated growth method by a previously reported procedure [40]. Specifically, a cetyltrimethylammonium bromide (CTAB solution) (0.1 M, 9.75 mL; ) was first mixed with a solution (0.01 M, 0.25 mL), followed by the rapid injection of a freshly prepared, ice-cold solution (0.01 M, 0.60 mL) under vigorous stirring. The resultant solution was kept under gentle stirring for 3 h at room temperature. 0.24 mL of the as-prepared seed solution was injected into a growth solution made of CTAB (0.1 M, 19.5 mL), water (380 mL), (0.01 M, 8 mL), and ascorbic acid (0.1 M, 30 mL) afterwards. The reaction mixture was gently mixed well and left undisturbed overnight at room temperature. The resultant Au NPs sample were washed and concentrated three times into water by centrifugation and redispersion for further use.
Preparation of the silica coated Au NPs: CTAB molecules adsorbed on Au NPs were first replaced by thiol-terminated methoxy poly(ethylene glycol) (mPEG−SH). Au NP solution (100 mL) was centrifuged and redispersed in water (20 mL). Then, mPEG−SH (polymer chain concentration 1 mM) solution (2 mL) was subsequently added. The resultant solution was kept undisturbed at 25°C for 12 h and then centrifuged twice to remove the excess mPEG−SH polymers. The obtained mPEG-coated Au NPs were redispersed in a solution mixture containing 4.5 mL of water, 15 mL of absolute ethanol, and 0.3 mL of (30% in mass fraction). After that, 0.08 mL of the silica precursor solution [5% (volume fraction) tetraethylorthosilicate (TEOS) in absolute ethanol] was injected into the Au NP solution under ice-cold and ultrasonication conditions for 1.5 h.
Preparation of the titania-coated Au NPs: The preparation of titania-coated Au NPs ( NPs) was a modified synthetic procedure [41]. was used as the precursor. The CTAB-capped Au NPs were first wrapped with poly-(sodium 4-styrenesulfonate) (PSS). Typically, the solution (20 mL) of an as-grown CTAB-capped Au NP sample was first centrifuged to remove the excess surfactant and then redispersed into water (10 mL). The resultant Au NP solution was then added dropwise under vigorous stirring to an aqueous PSS solution (10 mL, , containing 6 mM NaCl). PSS adsorption was allowed for at least 6 h at room temperature. After the excess PSS was removed by centrifugation, the PSS-encapsulated Au NPs were redispersed into water (0.2 mL). solution [0.2 mL, 17.1% (mass fraction), containing 25% (mass fraction) HCl] and water (6 mL) were first added into a glass bottle. solution (0.93 M, 1.1 mL) was then dropped, followed by the immediate addition of the PSS-encapsulated Au NP solution under stirring. After the mixture solution was stirred for 30 min at room temperature, the product was washed by centrifugation twice and redispersed in water (10 mL) before further use. To prepare anatase-phase titania-coated Au NPs, the thermal treatment of the washed and completely dried nanostructures was carried out in a box furnace in air at 450°C for 2 h with a ramp rate of .
Figures 10(a)–10(c) show representative transmission electron microscopy (TEM) images of the pure Au, , and NPs, which were synthesized by growing or shell on pregrown Au NPs mentioned above. They show well-defined core-shell nanostructures with a clear boundary between the Au core and the shells. This also reflects the excellent quality of the contact interface. The total size of the is in diameter with a -diameter Au core and shell, and all NPs are dispersed in aqueous solution.
Figure 10.Transmission electron microscopy images of (a) pure Au NPs, (b) NPs, and (c) NPs. Below is a diagram of the ultrafast broadband deep-to-near-UV spectroscopy setup, detailing the broadband pump-probe experiment after the noncollinear optical parametric amplifier. The blue dashed box shows the schematic of the achromatic doubling, adapted from Ref. [43]: BS, beam splitter; M, mirror; MM, multilayer mirror; CM, chirped mirror; SM, spherical mirror; PM, off-axis parabolic mirror; P, prism; L, lens; F, multimode fiber.
The experiments were performed using a pump-probe setup allowing for broadband deep-to-near-UV TA upon visible excitation of the samples [42,43]. A 20 kHz Ti:sapphire regenerative amplifier (KMLabs, Wyvern500) providing 50 fs/0.6 mJ pulses at 800 nm, pumps a non-colinear optical parametric amplifier (NOPA) to generate sub-90-fs visible pulses of 13 μJ/pulse in the 510–740 nm (1.68–2.43 eV) range. About 60% of the output is used as the pump pulses, which are spectrally filtered via several reflections of multilayer mirrors to give a green pump beam (2.0–2.4 eV). The pump pulses are further compressed by chirp mirrors to deliver duration. The remaining 40% NOPA output is used to generate broadband UV probe pulses with bandwidth through an achromatic doubling scheme [44]. The schematic representation of the probe configuration is shown in Fig. 10. A half-wave plate is used to set the relative polarization between the pump and probe at the magic angle (54.74°) to avoid photo-selection effects. The laser beam spot sizes of the pump and probe are μ and μ full widths at half maximum (FWHMs), respectively. In all measurements, the pump fluence has uncertainty due to the laser power measurement and beam spot size. The sample is in a 0.2-mm-thick quartz drilled-flow cell and rotated by an electric motor to prevent photo-damage.
The morphology of the samples was observed by TEM (FEI Tecnai Spirit microscope operating at 120 kV). The steady-state absorption spectra were recorded at room temperature using a commercial UV-Vis spectrometer (Shimadzu, UV-3600), and a reference spectrum of the pure solvent (water) was recorded for the baseline correction before measuring the absorption spectrum. To convert the nm to eV scale, we followed the Jacobian conversion method [45]. The wavelength is converted to energy using , and the signal values themselves must be scaled by , where represents the photon energy, is the Planck constant, is the light speed, and represents the wavelength.
The instrument response function (IRF) was determined by measuring the FWHM of the cross-phase modulation (CPM) at time zero of the pure water solvent (in a 0.2 mm optical path length drilled-flow cell). We adopted a procedure by fitting the CPM signal with a function composed of a Gaussian and its first and second derivatives as below [46]: of which the , is the time variable, and is the offset of time zero. The IRF was found to be .
APPENDIX C: FLUENCE-DEPENDENCE MEASUREMENT AND CORRECTION OF THE EXCITATION INTENSITY
The fluence-dependence experiments were performed on the same deep-UV TA setup, measuring the TA at specific time delays between pump and probe, in a range of pump fluences.
Prior to the measurement, we first determine the time zero position at the delay stage, by looking at the point where the signal starts to appear while electronically moving the stage. Second, we convert the desired delay time into distance on the stage, and calculate the position of the stage with respect to time zero. Then we set two time points slightly before and after the desired time (e.g., it measures TA response at and if 10 ps is chosen) and take the average TA values at these two time points.
The average incident laser fluence (measured in ) is defined as , where is the average laser power, is the repetition rate of the laser system, and is the laser beam spot size. The measurement of the laser beam spot size is performed using a camera-based beam profiling system consisting of a camera and analysis software, and the spot diameter is determined by the FWHM of the beam profile. We first set a range of the pump power (the upper power limit is determined by the laser system, and the lower limit is selected based on the smallest signal amplitude) and use a round continuously neutral density filter to control the power. The impinging laser power is measured by using an ultraviolet-extended ultra-sensitive photodiode, where we record the power before and after one single TA measurement and take the average value of these two. It has to be noted that since the signal is at the red-edge limit of our detection, we did not get as many data points as those of the signal because of a poor signal-to-noise ratio; nevertheless, it clearly shows a linear relationship between the signal amplitude and pump fluences at this band.
Because the LSPR band shifts between and in the steady-state absorption spectra (Fig. 1), when comparing the TA response of these two, a calibration of the actual excitation intensity needs to be performed. The broadband pump pulse covers the 2.0–2.4 eV region; thus we calculate the area below the absorption curve with respect to the background in this region, and obtain a ratio of of the absorption. Therefore, when plotting the TA results of the and , a factor of 1.3 was multiplied in the case of .
APPENDIX D: ESTIMATION OF THE TPA ENHANCEMENT FACTOR
The rate of TPA is defined as [47] where is the laser beam intensity, is the direction of light propagation, and is the TPA coefficient in cm/W. In the regime of TPA, a quadratic dependence on the laser intensity appears. The light intensity versus propagation distance becomes
is the intensity of light transmitted through a path length at a particular wavelength , and is the incident light intensity. Thus, the decrease in transmissivity along a path length in the direction is given by
Therefore, the induced TA signal can be written as
According to the experimental and theoretical TPA coefficient of titanium dioxide single crystal (rutile), is at 532 nm for configuration; is at 532 nm for configuration [48]. Even if Yuichi et al. obtained the of titanium dioxide with rutile structure, there would not be orders of magnitude difference between anatase and rutile in the visible spectral region. Here, we take 15 cm/GW to simplify the calculation. The optical path length equals the thickness of the flow cell: 0.2 mm. The incident light intensity , where we take a power of 5 mW and a Gaussian laser beam radius of μ. After adding an enhancement factor , we obtain
[15] M. Kyoung, M. Lee. Z-scan studies on the third-order optical nonlinearity of Au nanoparticles embedded in TiO2. Bull. Korean Chem. Soc., 21, 26-28(2000).
[47] K. Matyjaszewski, P. Prabhakaran, T. D. Kim, M. Möller, K. S. Lee. 8.09-polymer photonics. Polymer Science: A Comprehensive Reference, 211-260(2012).