• Photonics Research
  • Vol. 10, Issue 3, 731 (2022)
Guoping Lin1、2、* and Tang Sun1
Author Affiliations
  • 1Ministry of Industry and Information Technology Key Laboratory of Micro-Nano Optoelectronic Information System, School of Science, Harbin Institute of Technology, Shenzhen 518055, China
  • 2Innovation Center of Extreme Optics, Shanxi University, Taiyuan 030006, China
  • show less
    DOI: 10.1364/PRJ.441328 Cite this Article Set citation alerts
    Guoping Lin, Tang Sun. Mode crossing induced soliton frequency comb generation in high-Q yttria-stabilized zirconia crystalline optical microresonators[J]. Photonics Research, 2022, 10(3): 731 Copy Citation Text show less
    (a) Illustrated fabrication method of YSZ microdisk resonator. (b) Left to right: side view photo of a YSZ microresonator mounted on an aluminum post; zoomed-in photo and top view of the microdisk showing a measured major radius R of about 300 μm. (c) Left: side view photo of the rim of the disk showing a minor radius r of about 118 μm. Right: field distributions of different transverse modes with radial and polar mode orders q and p of 1, 2 and 0, 1, 2, respectively.
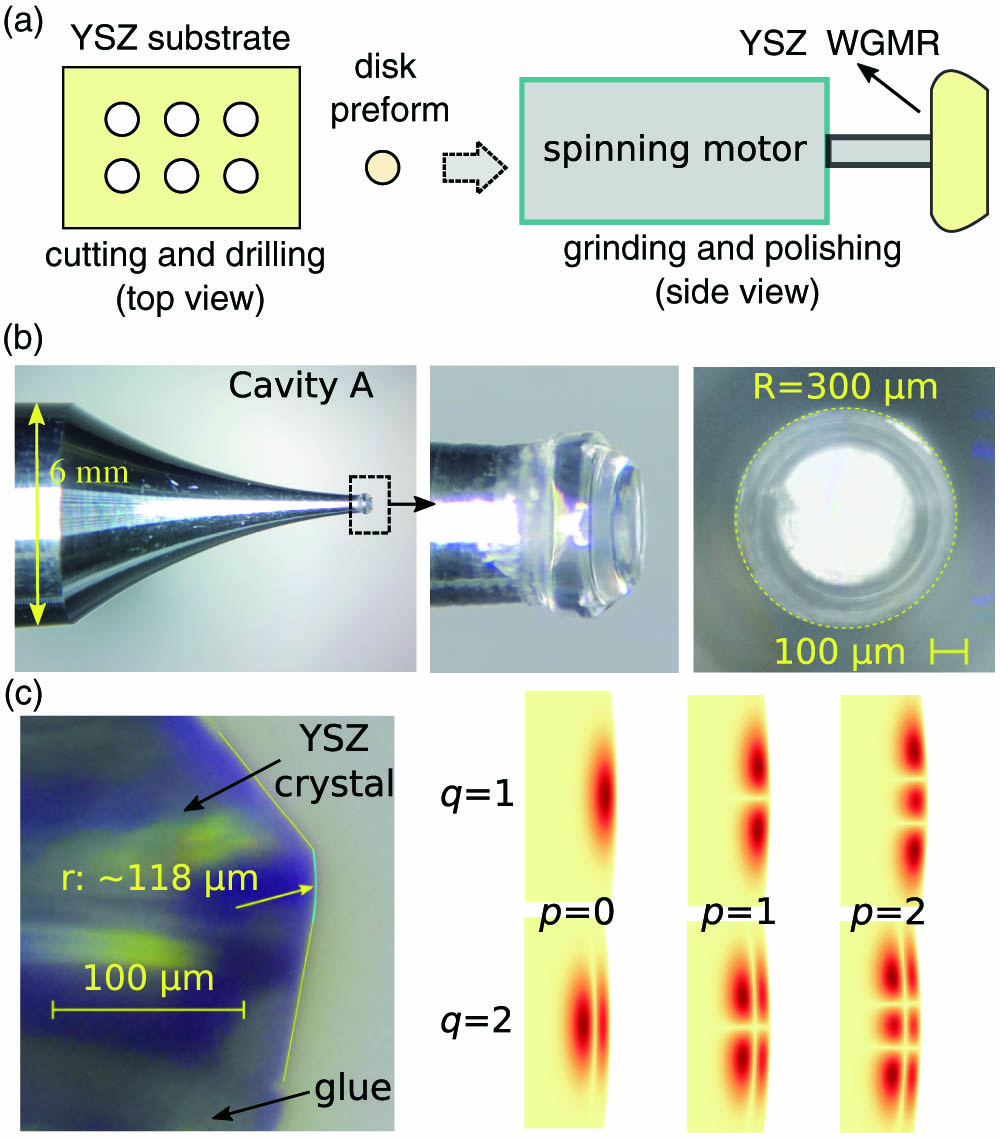
    Fig. 1. (a) Illustrated fabrication method of YSZ microdisk resonator. (b) Left to right: side view photo of a YSZ microresonator mounted on an aluminum post; zoomed-in photo and top view of the microdisk showing a measured major radius R of about 300 μm. (c) Left: side view photo of the rim of the disk showing a minor radius r of about 118 μm. Right: field distributions of different transverse modes with radial and polar mode orders q and p of 1, 2 and 0, 1, 2, respectively.
    (a) Schematic of the experimental setup. FC, fiber coupler; SF, single mode fiber; EDFA, erbium doped fiber amplifier; VOA, variable optical attenuator; FPC, fiber polarization controller; FR: fiber ring etalon; FOC, fiber optical circulator; L, optical lens; PD, photodetector; MF, multimode fiber; FG, function generator; OSC, digital oscilloscope; OSA, optical spectrum analyzer. (b) Top: photo of the YSZ microresonator and TiO2 prism coupler. Bottom: laser-scanned transmission spectrum of a WGM in the YSZ microresonator showing a linewidth of 2.4 MHz indicating a Q factor of 8×10⁷. FSRe: FSR value of the fiber ring etalon.
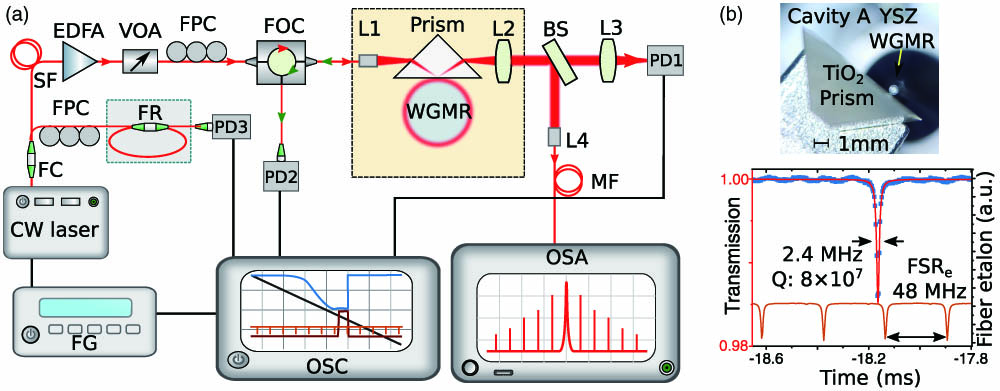
    Fig. 2. (a) Schematic of the experimental setup. FC, fiber coupler; SF, single mode fiber; EDFA, erbium doped fiber amplifier; VOA, variable optical attenuator; FPC, fiber polarization controller; FR: fiber ring etalon; FOC, fiber optical circulator; L, optical lens; PD, photodetector; MF, multimode fiber; FG, function generator; OSC, digital oscilloscope; OSA, optical spectrum analyzer. (b) Top: photo of the YSZ microresonator and TiO2 prism coupler. Bottom: laser-scanned transmission spectrum of a WGM in the YSZ microresonator showing a linewidth of 2.4 MHz indicating a Q factor of 8×10⁷. FSRe: FSR value of the fiber ring etalon.
    Mode crossing in the YSZ microresonator. (a) Laser-scanned transmission spectrum covering a 30-FSR spectral range of the YSZ microresonator (cavity A) with fiber etalon signals simultaneously captured for wavelength or frequency range calibration. Red crosses: mode A family. Blue circles: mode B family. FSR, FSR of WGMs; FSRe: FSR of the fiber ring etalon. (b) Absolute mode spacing between modes A and B as a function of the centered wavelength between them. Examples of Kerr frequency comb spectra pumped at mode A are shown in the insets.
    Fig. 3. Mode crossing in the YSZ microresonator. (a) Laser-scanned transmission spectrum covering a 30-FSR spectral range of the YSZ microresonator (cavity A) with fiber etalon signals simultaneously captured for wavelength or frequency range calibration. Red crosses: mode A family. Blue circles: mode B family. FSR, FSR of WGMs; FSRe: FSR of the fiber ring etalon. (b) Absolute mode spacing between modes A and B as a function of the centered wavelength between them. Examples of Kerr frequency comb spectra pumped at mode A are shown in the insets.
    Mode coupling in the YSZ microcavity. (a) Relative frequency position of modes A and B families showing a crossing position near 1554 nm. (b) FSR values of modes A and B families with the observed weak mode coupling induced disturbance. Solid lines: calculated analytical estimated data.
    Fig. 4. Mode coupling in the YSZ microcavity. (a) Relative frequency position of modes A and B families showing a crossing position near 1554 nm. (b) FSR values of modes A and B families with the observed weak mode coupling induced disturbance. Solid lines: calculated analytical estimated data.
    Soliton and soliton crystal frequency comb generation pumped at mode A family. (a) Pump scanned transmission spectrum around 1554.7 nm over about 6 GHz spectral range showing a soliton step coincident with the increased feedback power regime. (b) Comb spectra obtained with the pump thermally locked to mode A. Dashed line: sech2 envelope fit. (c) Optical spectra of soliton crystal with four different soliton numbers, where pump modes belong to mode A family. Pump wavelengths are 1555.3 nm, 1555.9 nm, 1559.5 nm, and 1560.1 nm from left to right and top to bottom. (d) Comb spectra showing a dispersive-wave-like tail around 1580 nm. Pump wavelengths are 1555.9 nm, 1556.5 nm, 1557.1 nm, and 1557.7 nm from top to bottom. Note that the brown arrow marks the pinned peak at 1554.1 nm.
    Fig. 5. Soliton and soliton crystal frequency comb generation pumped at mode A family. (a) Pump scanned transmission spectrum around 1554.7 nm over about 6 GHz spectral range showing a soliton step coincident with the increased feedback power regime. (b) Comb spectra obtained with the pump thermally locked to mode A. Dashed line: sech2 envelope fit. (c) Optical spectra of soliton crystal with four different soliton numbers, where pump modes belong to mode A family. Pump wavelengths are 1555.3 nm, 1555.9 nm, 1559.5 nm, and 1560.1 nm from left to right and top to bottom. (d) Comb spectra showing a dispersive-wave-like tail around 1580 nm. Pump wavelengths are 1555.9 nm, 1556.5 nm, 1557.1 nm, and 1557.7 nm from top to bottom. Note that the brown arrow marks the pinned peak at 1554.1 nm.
    Evolution of soliton crystal comb generation during pump laser scanning. (a)–(c) Typical optical comb spectra. (d)–(f) Corresponding RF spectra obtained by FFT in the oscilloscope. Inset in (d): transmission spectrum in cavity A when the laser wavelength is scanned across mode A around 1555.8 nm. Inset in (e): corresponding temporal trace in the oscilloscope.
    Fig. 6. Evolution of soliton crystal comb generation during pump laser scanning. (a)–(c) Typical optical comb spectra. (d)–(f) Corresponding RF spectra obtained by FFT in the oscilloscope. Inset in (d): transmission spectrum in cavity A when the laser wavelength is scanned across mode A around 1555.8 nm. Inset in (e): corresponding temporal trace in the oscilloscope.
    Kerr optical frequency comb generation in a YSZ microresonator with a radius of about 456 μm (cavity B). (a) Transmission spectrum spanning a spectral window of 11.9 GHz showing two adjacent WGMs with soliton crystal steps. Inset: photo of the microcavity coupled with the rutile prism. The appearance of the transmission step of mode A is recorded (see Visualization 2). (b) Different optical comb spectra obtained when the pump laser is thermally locked to the soliton crystal step in mode A. (c) Soliton crystal comb obtained when the pump laser is thermally locked to the step of mode B.
    Fig. 7. Kerr optical frequency comb generation in a YSZ microresonator with a radius of about 456 μm (cavity B). (a) Transmission spectrum spanning a spectral window of 11.9 GHz showing two adjacent WGMs with soliton crystal steps. Inset: photo of the microcavity coupled with the rutile prism. The appearance of the transmission step of mode A is recorded (see Visualization 2). (b) Different optical comb spectra obtained when the pump laser is thermally locked to the soliton crystal step in mode A. (c) Soliton crystal comb obtained when the pump laser is thermally locked to the step of mode B.
    MaterialRefractive Indexn2 (m2·W1)FSR (GHz)Mode Area (μm2)Loaded QLowest Threshold (mW)
    Si3N42.02.5×10192001.54×1060.33 [51]
    AlN2.13.5×10193640.8×10655 [52]
    LiNbO32.211.8×101920012×1064.2 [27]
    Diamond2.40.8×10199250.81×10620 [53]
    4H silicon carbide2.68×10192602.54×10610 [54]
    Gallium phosphide3.11×10172500.150.2×1063 [55]
    AlGaAs3.32.6×101710000.281×1060.036 [56]
    Si (pumped at 2.6 μm)3.51×101812722.2×1053 [57]
    YSZ (this work)2.14×101974.5182×1071.9
    Table 1. Performances of Various Kerr Microcombs on High Refractive Index (n>2) Platforms
    Guoping Lin, Tang Sun. Mode crossing induced soliton frequency comb generation in high-Q yttria-stabilized zirconia crystalline optical microresonators[J]. Photonics Research, 2022, 10(3): 731
    Download Citation