 AI Video Guide
  AI Picture Guide
 AI One Sentence

J.-R. Marquès, L. Lancia, P. Loiseau, P. Forestier-Colleoni, M. Tarisien, E. Atukpor, V. Bagnoud, C. Brabetz, F. Consoli, J. Domange, F. Hannachi, P. Nicolaï, M. Salvadori, B. Zielbauer. Collisionless shock acceleration of protons in a plasma slab produced in a gas jet by the collision of two laser-driven hydrodynamic shockwaves[J]. Matter and Radiation at Extremes, 2024, 9(2): 024001
- Matter and Radiation at Extremes
- Vol. 9, Issue 2, 024001 (2024)
Note: This section is automatically generated by AI . The website and platform operators shall not be liable for any commercial or legal consequences arising from your use of AI generated content on this website. Please be aware of this.
Abstract
I. INTRODUCTION
Collisionless shocks are ubiquitous in astrophysical environments1,2 such as the Earth’s bow shock, solar flares, interplanetary traveling shocks, and supernova remnants (SNRs).3,4 They are believed to be responsible for nonthermal particles5,6 and gamma ray bursts.7 Using scaling laws,8 the physics of collisionless magnetized shocks in SNRs has been investigated experimentally using laser-produced plasmas.9,10 Their capability to accelerate particles has been demonstrated.11
The formation of a collisionless electrostatic shock requires the creation of a localized region of higher pressure within a plasma with electron temperature Te much larger than the ion temperature Ti. As this region of high pressure (defined as the downstream region) expands, it can drive a shockwave into the surrounding lower-pressure plasma (defined as the upstream region). The shockwave front can accelerate upstream ions by reflecting them to twice the shock velocity if the shock potential is larger than the kinetic energy of the incoming ions in the shock-rest frame.
Being efficient accelerators of particles, laser-driven shocks have attracted growing interest as possible compact particle accelerators.12–15 Energetic ion beams from compact laser-produced plasmas have potential applications in many fields of science and medicine, such as particle physics,16 fast ignition of fusion targets,17–19 materials science,20 proton radiography,21–23 radiotherapy,24–27 and isotope generation for medical applications.28,29
Several schemes for laser-driven ion acceleration have been proposed: target normal sheath acceleration (TNSA),30,31 radiation pressure acceleration (RPA),32–35 and breakout afterburner acceleration,36,37 all of which use over-dense targets (solid-density foils or liquid jets), and magnetic vortex acceleration (MVA)16,38,39 and collisionless shock acceleration (CSA), both of which use near-critical-density (NCD) targets (exploded foils or gas jets). The production, at high repetition rate, of high-energy ion beams with a narrow energy spread and a low divergence still remains a challenge, and CSA could potentially offer these properties. Moreover, NCD plasmas can be generated using gas jets, offering several advantages (compared with other target types) such as the avoidance of target debris that usually spoil the surrounding optics, the avoidance of the target replacement and realignment between consecutive shots, and the ability to produce pure (impurity-free) proton beams by using H2 gas.
Proton acceleration by CSA in a hydrogen gas jet was first demonstrated15,40 using CO2 lasers, the low critical density (nc ≈ 1019 cm−3) associated with their long wavelength (λ0 = 10 μm) allowing the exploitation of regular-pressure, millimeter-scale gas jets. A proton beam of ∼MeV energy was produced with narrow energy spread (σ ∼ 4%) and low normalized emittance (
Experiments with the more widely available solid state ps lasers (λ0 ≈ 1 μm, nc ≈ 1021 cm−3) have been performed using high-pressure narrow gas jets tailored by an HSW44,45 or using exploded micrometer-size solid foils.46,47 Compared with the proof-of-principle experiments with CO2 lasers, the number of accelerated protons was substantially higher
Despite the large differences in terms of laser or target types, this set of experiments showed that the shape and maximum energy of the ion distributions depend strongly on the profile and peak value of the plasma density. Ion beams with peaked energy distribution and similar velocity of ion species with different charge-to-mass ratios, consistent with CSA, were observed only for plasmas with a steep density gradient at the laser entrance side and of NCD. To obtain a narrow energy spread by CSA,12–14 it is crucial to have a uniform shock velocity and ion reflection, which implies a uniform electron temperature profile, only achievable by a rapid recirculation of the heated electrons due to the space-charge fields at the front and at the back of the target. Therefore, the plasma width L should be limited, which for a moderate Mach number shocks (M ≳ 1), means
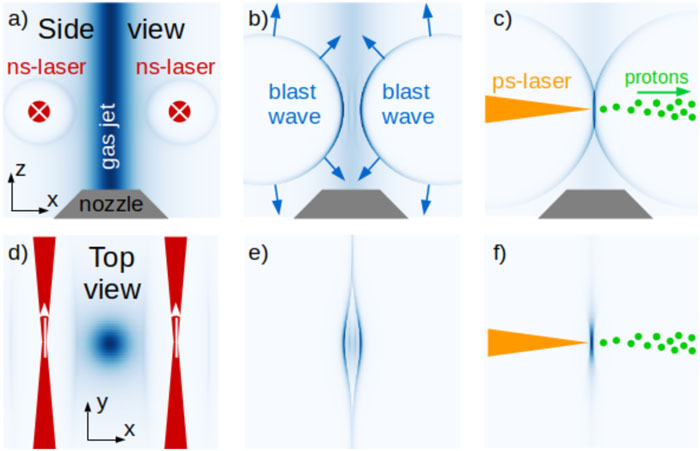
To generate such thin NCD plasmas, we recently proposed a new tailoring method48,49 based on a narrow gas jet coupled with two parallel nanosecond (ns) heating lasers that propagate perpendicular to the main ps laser. These ns beams are focused on both sides of the gas jet. The sudden and localized ionization and heating occurring at their foci generate two cylindrical HSWs. The expansion of each wave has two effects: (i) the part that expands toward vacuum expels the wing of the gas jet, while (ii) the part propagating toward the center of the jet compresses the plasma. The collision at the jet center of the two waves generates a thin plasma slab with steep gradients. Our hydrodynamic and ion Fokker–Planck simulations indicated that with present high-density gas jets,50 this method allows the production of a thin (≳10 μm) plasma slab, with an adjustable density up to 2 × 1022 cm−3 (20nc for a 1 μm laser). This tailoring scheme can be implemented at high repetition rate, in a debris-free environment, and with different types of gas. Such thin NCD targets have attracted attention recently not only for use in CSA or other ion acceleration mechanisms,51 but also for brilliant gamma-ray and electron–positron pair production.52–54
In this paper, we present experimental results on proton acceleration in an H2 gas jet laser-tailored by the technique proposed in our previous numerical work.48,49 We study the influence of plasma tailoring on the energy and angular distributions of the accelerated protons, for three cases: without tailoring, by tailoring only the entrance side of the ps beam, or by tailoring both sides of the gas jet. We observe a transition from a transverse (to the ps beam direction) acceleration with a low-energy broad spectrum produced by Coulomb explosion to a forward acceleration with a higher-energy peaked spectrum, in good agreement with CSA. The spatiotemporal evolution of the plasma profile is characterized by optical shadowgraphy of a probe laser beam. This shadowgraphy is simulated by a post-processing (ray-tracing) of three-dimensional hydrodynamic simulations of the plasma tailoring, and the simulated shadowgraphs are compared with experimental observations to estimate the size and density of the resulting plasma slab.
II. EXPERIMENTAL SETUP
The work was performed on two laser facilities, PHELIX at GSI (Germany) and PICO2000 at LULI (France), both delivering laser pulses at a fundamental wavelength λ0 ∼ 1 μm. The experimental arrangement is sketched in Fig. 1. The plasma was generated from a narrow, high-density, supersonic jet of hydrogen gas expelled from a 250 μm output diameter nozzle. The two parallel ns beams for plasma tailoring were focused 300 μm away from each side of the jet center. The ps laser beam driving the proton acceleration propagated at 90° from the ns beams and focused at the center of gas jet. The output of the gas nozzle was placed 400 μm above the propagation plane of the ps and ns laser beams. In this plane, the gas density profile, measured by interferometry of a probe beam,50 was fitted to natom(r) (cm−3 bar−1) ∼ 6.2 × 10¹⁷{exp[−(r/186)2] + 0.63 exp[−(r/132)]}. The backing pressure was adjustable up to 1000 bars, allowing, without laser tailoring, a density of ne ∼ nc to be reached, where the critical plasma density
![]()
Figure 1.Sketch of the experimental arrangement. (a)–(c) Side view (from the
The ps beam had an energy of ∼25 J at GSI and ∼50 J at LULI. It was focused to a Gaussian-like focal spot of 10 μm FWHM (in intensity). The temporal profile was Gaussian with full widths at half maximum (FWHM) of 0.5 ps at GSI and 1 ps at LULI, and contrasts on the ns scale (amplified stimulated emission, ASE) of 1011 and 107, respectively. The peak intensities were 8 × 10¹⁹ and 2 × 10¹⁹ W cm−2, respectively, corresponding to normalized vector potentials of a0 ∼ 8 and 4. The Rayleigh length of the ps beam was zR ≳ 250 μm, of the order of or greater than the width of the gas jet. The ns beams had square-like temporal profiles of ∼1 ns duration. Each ns beam was focused to a spot of FWHM ∼67 μm (GSI) and 42 μm (LULI), containing up to 15 and 6 J, respectively.
In both experiments, the hydrodynamic evolution of the plasma was controlled by two-dimensional (2D) shadowgraphy and interferometry of a probe laser beam of 0.5 μm wavelength propagating at 90° with respect to the ps beam and parallel to the ns beams. This probe beam was collimated, with a diameter covering the entire interaction region. At GSI, it was generated by the leakage of a dielectric mirror in the ps-beam path, sent to a delay line, and frequency-doubled, leading to a jitter-free probe of 0.5 ps duration. Its transverse intensity (shadowgraphy) and phase (interferometry) profiles at the exit of the plasma were recorded on 16-bit CCD cameras. The probe beam at LULI had a Gaussian temporal profile of FWHM ∼7 ns. The shadowgraphy and interferometry at a given time (snapshot) were recorded on a gated optical intensifier (GOI) coupled to 16-bit CCD cameras, with an integration window of 100 ps. The shadowgraphy profile along the ps-beam axis was imaged on the entrance slit of a streak camera, with a time resolution of 100 ps. The long duration of the probe beam enabled the propagation of the shockwaves to be followed from their creation to their collision, and thus allowed checking and adjustment of the synchronization of the HSW collision with the arrival of the ps beam. The time jitters of the GOI and of the streak camera diagnostics were less than 50 ps. The shadowgraphy and interferometry diagnostics used the same collecting lens, with an angular aperture of ±3.5° at LULI and ±2° at GSI, leading to a spatial resolution better than 10 μm. The focal spots of the ns beams were recorded on a 12-bit CCD, which allowed their adjustment on both sides of the gas jet before shot, as well as control of their positions, shapes, and transmitted energies on shot. The position of the ps beam was controlled before shot on an 8-bit CCD. In addition to these “side-view” diagnostics (shadowgraphy, interferometry, and focal spots), the interaction region was also imaged from the “bottom” on a 12-bit CCD. The second-harmonic light (0.5 μm) emitted by the ps beam along its propagation in the plasma was recorded on the “side-view” and “bottom-view” diagnostics, allowing identification of the regions where the density gradients or the laser intensity were high, or where beam refraction or self-focusing could occur. The energy spectra of the protons accelerated from the H2 plasma were recorded on image plates (Fuji BAS-MS type) coupled to magnetic spectrometers. In the LULI experiment, these were positioned at 0°, 30°, and 70° from the ps-laser axis and at 56, 47, and 30 cm, respectively, from the laser focus. In the GSI experiment, they were at 25°, 37°, and 53° and at 49, 114, and 107 cm, respectively. A pinhole of 500 μm diameter was placed at the entrance of each spectrometer, providing an energy resolution of 0.15 MeV, except for the spectrometer at 70° on the LULI experiment, where it was 0.075 MeV.
III. INTERACTION WITHOUT PLASMA TAILORING
Figure 2 shows 2D space-resolved shadowgraphs (snapshots) of the plasma generated by the interaction of the ps beam with the high-density H2 gas jet, at different backing pressures and times for the LULI and GSI ps beams. At 800 bars [Figs. 2(a) and 2(c)], the expected peak density on the laser axis, assuming full ionization, is ne = 8 × 1020 cm−3 (0.8nc). Figure 2(a) shows that the plasma at t = 0.2 ± 0.1 ns after the ps-pulse arrival is much larger than the laser focal volume and extends over the whole gas jet volume, on a millimeter scale, along the laser axis (x) as well as transversely (z). Shadowgraphs of very similar size and shape are observed at 450 bars [Fig. 2(b)] in the LULI experiment, as well as in the GSI experiment [Fig. 2(d)], for which the probe pulse is shorter (0.5 ps) and the pump pulse has a 104 times better ASE temporal contrast. The millimeter scale of these shadowgraphs is significantly larger than the FWHM of the gas jet, ∼270 μm at z = 0, which will be discussed in Sec. VI. The prompt and localized energy deposition of the ps pulse along its propagation leads to strong ponderomotive and thermal pressures, which transversely expel the plasma from the laser axis, as observed in Fig. 2(c), 1.7 ns after the ps pulse.
![]()
Figure 2.Probe beam shadography from the plasma generated by the interaction of the ps beam with the high-density H2 gas jet, at different backing pressures and different times from the ps-pulse arrival: (a)–(c) LULI experiment; (d) GSI experiment. At the top of each image (
Time-resolved (streak camera) shadowgraphs along one dimension in space [the ps-beam axis (x, for z = 0)], are presented in Fig. 3 for two gas jet pressures. Despite the factor two difference in pressure, these shadowgraphs are very similar. For t < 0, the probe beam is undisturbed, indicating that the ASE contrast is high enough to avoid ionization of the gas before the ps-pulse arrival. For 0 ns < t < 1 ns, the shadowgraph extends symmetrically from the focal position up to x ∼ ±400 μm, as observed on the snapshots in Figs. 2(a) and 2(b). At these edges, on applying the expression for the gas jet density given in Sec. II, the plasma density for the 800 bar case [Fig. 3(a)] is
![]()
Figure 3.Time-resolved (streak camera) shadowgraphs along the ps-beam axis (
Proton spectra from the LULI experiment, measured at 0°, 30°, and 70° from the laser axis, are presented in Fig. 4 for the same laser-plasma parameters as in Figs. 2 and 3. The noise spectra (dashed lines) are obtained from the same analysis as for the proton spectra (solid lines), but applied to a region close to the dispersion zone but unexposed to protons. Even when the signal-to-noise ratio is low, the proton spectrum can be easily distinguished from the noise that exhibits a constant shape. Figure 4 shows that by directly focusing the laser on the gas jet, without plasma tailoring (no ns beams), the acceleration along the laser axis is very weak (if not zero), is larger at 30°, and much more efficient at 70°, almost perpendicularly to the laser axis. The spectrum has two components: an exponential part at low energy, followed by a plateau, extending up to 2 MeV at 70°. Such an energy distribution could be the result of “Coulomb explosion”: ions are accelerated by electrostatic forces caused by charge separation induced by the laser ponderomotive pressure in the underdense part of the plasma.49,55,56 The ponderomotive force is mainly transverse, and so the emission angles of the accelerated protons are centered around 90°. The maximum energy that can be gained is the relativistic ponderomotive energy Up = mec2(γ − 1), where
![]()
Figure 4.Proton spectra from the LULI experiment, without plasma tailoring, measured at 0°, 30°, and 70° from the ps-beam axis, for different gas jet backing pressures. The dashed lines are the noise levels of each spectrum. The laser-plasma parameters are the same as in
The shot-to-shot fluctuations of the proton spectra are attributed to the excitation of the filamentation instability that breaks the laser beam in the low-density part of the plasma profile.49 The laser pulse loses its integrity and splits into filaments with different intensities and propagation angles from shot to shot.
IV. INTERACTION WITH A FRONT-FACE TAILORED PLASMA
1D time-resolved (streak camera) and 2D space-resolved (GOI snapshot) shadowgraphs of the plasma tailored by one ns beam at the entrance side of the ps beam are presented in Figs. 5(a) and 5(b), respectively, for a gas pressure of 200 bars. The ns pulse was sent into the gas jet ∼2.7 ns before the ps pulse. It propagated along the y axis (perpendicular to the image plane) and focused at x = −300 μm, z = 0 [red circle in Fig. 5(b)]. The lower backing pressure used for this tailoring case (200 bars, instead of 800 bars without tailoring) was chosen to avoid the ns-beam refraction at the jet entrance and for better plasma expulsion by the HSW, while preserving the high density at the jet center thanks to the density jump (compression) induced by the HSWs,48 (γ + 1)/(γ − 1), where γ is the heat capacity ratio of the gas. With γ = 1.4 for hydrogen, the density at the shock front could reach six times the background density.
![]()
Figure 5.(a) Time-resolved [along the ps-beam axis (streak camera)] and (b) 2D space-resolved (GOI snapshot) shadowgraphs of the plasma tailored by one ns beam, at the entrance side of the ps beam, for a gas jet backing pressure of 200 bars. The dashed orange line highlights the croissant-like shape produced by the expansion of the HSW [see also
The hydrodynamic evolution (on the ps-beam axis) of the plasma can be followed in Fig. 5(a). For t < −2.5 ns, the probe beam is fully transmitted, indicating no pre-plasma. At t ∼ −2.7 ns, the ns beam promptly ionizes and heats the edge of the gas jet. A hydrodynamic shockwave is generated, which starts to push the plasma out of the ns-beam axis. At −2.7 ns < t < −2.3 ns, one can observe the plasma motion toward vacuum (x < −300 μm) and toward the jet center (x > −300 μm). At later times, the plasma moving toward vacuum becomes too tenuous to produce a shadow, while the HSW propagating toward the jet center stays dense and can easily be followed. In contrast to the ps-pulse interaction, which ionizes the whole gas jet volume very rapidly (Fig. 2), the ionization by the ns beam concerns only its focal region, the rest of the jet staying in the gaseous state until the arrival of the HSW (the right side of the jet stays undisturbed). The shockwave reaches the jet center at t = 0. At that time, the ps pulse arrives, crosses the plasma created by the HSW, and then interacts with the high-density non-ionized part of the gas jet (at x = 0), which induces strong second-harmonic emission that saturates the camera. The 2D plasma extension at that time can be observed in Fig. 5(b). The focal spot position of the ns beam is indicated by the red circle. The time integration window of the GOI was ∼120 ps, centered on the ps-pulse arrival, and so the snapshot shows the plasma created by both the ns and ps beams, as well as the strong second-harmonic emission of the ps pulse. Partly hidden by this flash, a croissant-like shape can be distinguished [highlighted by the orange dashed line, and clearly visible in Figs. 7(b), 8, and 10(a)], which is the plasma generated by the expansion of the HSW. This initially cylindrical wave produces a circular shadowgraph that has evolved into a croissant-like shape because about half of the HSW expelled the plasma toward vacuum (left on the image), while the part propagating toward the center of the jet ionized and compressed this high-density region. The horizontal extension of the croissant is larger on the bottom part of the image (z > 0) because of the conical shape of the gas jet (larger far from the nozzle exit). The blue dashed lines in Fig. 5(b) show the edges of the shadowgraph obtained for the case without tailoring [ps beam only, Figs. 2(a), 2(b), and 2(d)]. On the ns-beam side, the plasma has been pushed toward the jet center.
Proton spectra associated with the shadowgraphs of Fig. 5 are presented in Fig. 6. Tailoring the gas jet on the input side of the ps beam improves the forward acceleration. The maximum proton energies at 0° and 30° both increase, while the transverse (70°) acceleration becomes less efficient. In addition to the thermal exponential, the spectrum at 0° (Fig. 4) has a peaked component centered near 1.35 MeV. This indicates the appearance of another acceleration mechanism. Among the laser-driven ion acceleration schemes listed in Sec. I, CSA is the only one that in underdense or NCD plasmas is expected to produce a peaked energy spectrum, at twice the shock velocity. No acceleration (proton) was measured without the ps beam.
![]()
Figure 6.Proton spectra from the LULI experiment, associated with the shadowgraphs of
V. INTERACTION WITH A FRONT- AND BACK-FACE TAILORED PLASMA
Examples of shadowgraphs of the plasma tailored on the two opposite sides are presented in Fig. 7. The ns beams arrive 2.5 ns before the ps pulse. At this time, we can see in Fig. 7(a) the prompt generation of the plasmas on both sides of the jet center, at the focal positions of the ns beams (x = ±300 μm), followed by the propagation of the HSWs. Only the dense parts converging toward the jet center are visible; the parts expanding toward vacuum are too tenuous to generate a significant shadowgraph. The central part of the jet stays in the gaseous state at least until t ∼ −1.4 ns, when the shadowgraphs of each HSW start to overlap. The waves collide at the jet center at t ∼ −200 ps, leading to a shadowgraphy with a minimum width of ≲300 μm (orange arrows), slightly before the ps-pulse arrival (t = 0), visible by the second-harmonic emission it generates along its propagation (green line along the x axis). This width is much smaller than the one observed in Fig. 3 without plasma tailoring (∼800 μm). As observed in Figs. 3(a) and 6(a), the ps pulse generates second-harmonic light at its arrival in the plasma. After that time, the collision of the HSWs has ended, and the plasma starts to expand. At t ∼ 0.6 ns, the strong ponderomotive and thermal pressures driven by the ps pulse have expelled the plasma from the laser axis, and the probe beam is transmitted again. A 2D space-resolved shadowgraph of the HSWs just before the ps-beam arrival is presented in Fig. 7(b). As already observed in Fig. 5(b), the initially cylindrical expansion of each HSW from the axis of its driving ns beam (red circles) has led to a croissant-like plasma of high density. The blue dashed lines in the figure indicate the edges of the shadowgraph measured without plasma tailoring (Fig. 2). This shows that tailoring the gas jet from the two opposite sides has allowed (i) a significant reduction in the plasma density at the edge of the gas jet and (ii) the generation of a high-density narrow (
![]()
Figure 7.(a) Time-resolved [along the ps-beam axis (streak camera)] and (b) 2D space-resolved (GOI snapshot) shadowgraphs of the plasma tailored on the two opposite sides for a gas jet backing pressure of 200 bars. The energy in each ns beam is 4.5 J. The orange arrows in (a) indicates the minimum width of the shadowgraph (collision of the two HSWs). The horizontal line at
![]()
Figure 8.2D space-resolved (GOI snapshot) shadowgraphs of the plasma tailored on the two opposite sides, for a gas jet backing pressure of 300 bars, at two different times: (a) before the collision of the HSWs; (b) just after their collision and the arrival of the ps pulse. The blue dashed lines indicate the edges of the shadowgraph measured without plasma tailoring (
Examples of proton spectra obtained by tailoring the gas jet from the two opposite sides are presented in Fig. 9. The maximum energy and the shape of the spectra at 70° are similar to those obtained without tailoring (Fig. 4). However, despite the shot-to-shot fluctuations, the tendency observed when tailoring only the entrance side (Fig. 6) is enhanced when both sides are tailored: the acceleration in the forward direction is improved, and the energy distribution becomes more peaked. At 30°, the portion of the spectrum induced by CSA moves toward higher energies and is now clearly separated from the low-energy thermal part. The maximum energy is more than doubled, reaching 3.2 MeV.
![]()
Figure 9.Proton spectra from four laser shots on the LULI experiment, in the case of a plasma tailored on both sides (as in
The number of protons accelerated above 1 MeV is also significantly increased at 0° and 30°. Comparison with the single-HSW case (Fig. 6) demonstrates that the improvement in acceleration is not only the result of a better propagation of the ps pulse at the plasma entrance. Compared with the case without tailoring at 800 bars (Fig. 4), the number of protons accelerated at 70° is similar or larger, despite a lower backing pressure of 200–300 bars. This indicates that the collision of the HSWs has compensated for the initially lower plasma density (the expected total compression factor48 is ≳8) and enabled a value at least equivalent to that at 800 bars to be reached, close to nc. Not only does this increase the number of protons available in the plasma but, by increasing the plasma density, it helps to increase the ps-pulse absorption58,59 and thus the velocity of the collisionless shockwave and the maximum proton energies. Let us note that the lower backing pressure used for the tailoring cases was chosen to avoid refraction of the ns beam at the jet entrance and enable better plasma expulsion by the HSW, while preserving the high density at the jet center thanks to the collision of the HSWs.48
Very similar results were obtained in the GSI experiment. A 2D shadowgraph at the collision of the two HSWs is presented in Fig. 10(a). The croissant-like shape of the HSWs is more square. This is due to the square shape of the wings of the ns-beam focal spots. Despite this difference, the sharpness and the width (∼200 μm) of the plasma slab are very similar to those in the LULI experiment. The proton spectrum measured at 53° and associated with the interaction of the ps pulse with this plasma slab is presented in Fig. 10(b). As in the LULI experiment, the spectrum has a low-energy exponential distribution without tailoring (
![]()
Figure 10.Typical result from the GSI experiment: (a) 2D space-resolved (GOI snapshot) shadowgraph of the plasma tailored on both sides; (b) associated proton spectrum measured at 50°. The gas jet backing pressure was 100 bars. The shadowgraph is 40 ps before the ps-pulse arrival.
Part of the shot-to-shot fluctuations observed on both experiments comes from variations on the plasma profile at the ps-pulse arrival, which can significantly affect the quality (uniformity, angle, and Mach number) of the collisionless shockwave. These variations originate mainly from fluctuations in the dynamics of the HSWs, which are sensitive to (i) the energy in the wing of the ns-beam focal spot (see Sec. VI) and (ii) the exact position of the focal spot on the edge of the gas jet density profile. For example, from the expression for natom(r) given in Sec. II, there is a factor-of-3.6 difference in density between r = 250 μm and r = 350 μm. This induces an order-of-magnitude difference in the inverse bremsstrahlung absorption
Table I summarizes the number of accelerated protons and the energy of the proton beam for the LULI spectra of Figs. 4, 6, and 9 associated with the three tailoring scenarios. Despite the relatively strong shot-to-shot fluctuations, the result in the table demonstrate that tailoring the plasma from the two opposite sides improves the acceleration toward the laser direction, in terms of the number of protons as well as of the energy of the proton beam. The optimal acceleration in the forward direction also corresponds to the minimum transverse acceleration (the last line in Table I). Only one shot is presented for the one-sided case. Nevertheless, several shots with one-sided tailoring were performed in the GSI experiment. They confirm the evolution of the acceleration observed in the LULI experiment between no tailoring, one-sided tailoring, and two-sided tailoring. The energy cutoff Ek > 1 MeV used in Table I artificially sets to zero the signal observed in the forward direction without tailoring. However, the associated spectra [Figs. 4(a) and 4(b)] are broad and at very low energy, below 1 MeV at 0° and 1.1 MeV at 30°. The cutoff at 1 MeV thus appears to be a reasonable value to distinguish forward acceleration by CSA (peaked spectrum) from ponderomotive acceleration.
 |
Table 1. Number of protons and total energy of the spectra for Ek > 1 MeV, measured at angles of 0°, 30°, and 70°, and for the different configurations of plasma tailoring. Obtained by integrating the spectra of
Despite the shot-to-shot fluctuations, all the improvements observed in the proton spectra indicate that the laser-plasma conditions become closer to those required for efficient CSA,13,14 namely, (i) a near-critical plasma density to get efficient laser absorption of the ps pulse and thus strong plasma heating (MeV), (ii) a narrow plasma length to favor uniform heating, leading to a uniform shock velocity and thus the production of monoenergetic protons, and (iii) an exponentially decreasing output density gradient to get a uniform sheath field that preserves the monoenergetic distribution as protons are reflected by the shock.
The proton energy expected from CSA13,14 is of the order of Ek (MeV) ∼ 2M2Te (MeV), where M is the Mach number of the collisionless wave and Te (MeV) ∼ 0.078(η/α)a0τ (ps)/L (mm), with τ the duration of the laser pulse, η its absorption efficiency, α = 3/2 for nonrelativistic plasmas (Te ≪ mec2), and α = 3 in the relativistic case. The absorption efficiency depends on a0 and ne. In our conditions, it is expected14,49,58,59 to be between 0.25 and 0.5. Taking α = 2.2 and assuming 0.05 mm < L < 0.1 mm (smaller than the shadowgraph size; see Sec. VI), Te is expected to be of the order of 0.35–1.4 MeV on both the LULI and the GSI experiments (same a0τ). Taking for M the minimum value required for the shock to reflect protons,14,61M = Mcr ∼ 1.6, leads to expected proton energies of 1.8 MeV < Ek < 7.2 MeV, in good agreement with our measurements.
As discussed in Sec. I, the maximum proton energy from CSA driven by a λ0 = 1 μm laser is expected13,14 to occur for a plasma length close to Lopt ∼ 40 μm. The width of the plasma observed in Figs. 7, 8, and 10(a) appears to be ∼200–300 μm. However, the width of the shadowgraph could significantly overestimate that of the density profile. For example, the gas jet FWHM is ∼270 μm, while on Figs. 2 and 3, the full width of the shadowgraph is ∼600–800 μm, representing the very low wing of the density profile, 0.08–0.025 of the density at the jet center. The plasma slab at the collision of the HSWs can thus be much narrower than its apparent size on the shadowgraph.
VI. PLASMA TAILORING: COMPARISON WITH NUMERICAL SIMULATIONS
The CSA depends strongly on the plasma length L. Our previous numerical study48 indicated that the width of the density profile at the collision of the two HSWs was below or of the order of tens of micrometers, while, as previously mentioned, the dark part of the shadowgraphs in Figs. 7 and 10(a) is 200–300 μm wide. This dark part originates from light rays that are so refracted by the density gradient that they are not collected by the lens of the imaging system. This width thus depends on the aperture of the diagnostic (3.5° on the LULI experiment and 2° on GSI) and can be significantly larger than the FWHM of the density profile. In other words, when strong refraction occurs (our conditions), for a defined density profile, the width of the shadowgraph does not directly reproduce the width of the profile, but results from the amplitude of the density gradient and the diagnostic aperture. The smaller the lens aperture, the larger is the dark part of the shadowgraph. To estimate for our experimental parameters the width ratio between the density profile and the dark part of the shadowgraph, we performed 3D hydrodynamics simulations and post-processed the probe beam propagation (refraction and inverse bremsstrahlung absorption) to simulate the shadowgraphy diagnostic. As in our previous study,48 we used the radiation-hydrodynamics code TROLL,62 but in a 3D geometry, allowing to use as inputs the experimentally measured 3D density profile of the gas jet. We also used the experimental temporal profile of the ns beams. Figure 11(a) shows the temporal evolution of the density profile along the ps-beam axis. As already detailed in Ref. 48, each of the two ns beams, focused 300 μm from both sides of the gas jet center (x = 0) generates a HSW. Only the part of the cylindrical HSW that converges toward the gas jet center leads to a high density jump, while the part traveling toward vacuum is not visible because of its quick spread and decrease in amplitude. The initial maximum plasma density (at x = 0) is
![]()
Figure 11.(a) Temporal evolution of the density profile along the ps-beam axis from 3D TROLL simulations. The two ns beams are focused 300
![]()
Figure 12.Same as
![]()
Figure 13.Spatial profiles of (a) the laser focal spot, (b) the electron temperature, (c) the electron density for the case without the wing in the intensity profile (left,
Let us note that since the hydrogen is very rapidly ionized, full ionization was imposed at the beginning of the simulation and, to avoid an early gas jet expansion, an initial temperature of 300 K was imposed. This has no effect on the plasma evolution induced by the ns beams. However, in the regions not affected by these beams or by the HSWs they produce, where the medium should still be in its gaseous state, its refractive index as well as the inverse bremsstrahlung absorption of the low-intensity probe beam are strongly overestimated. To avoid this artifact, in the post-processing of the shadowgraphy diagnostics, the ionization state was corrected using the Saha ionization equation. The density map presented in Fig. 11(a) includes this correction. Without correction, the shadowgraph at early times is completely dark at the jet center, while the gas is still not ionized and should fully transmit the probe beam (as experimentally observed and mentioned in Secs. IV and V).
The normalized lineouts in Figs. 12(a) and 12(b) show respectively the density and shadowgraph profiles at the collision time (t = 2.3 ns). The width of the shadowgraph is ∼150 μm, which is much larger than the width of the plasma slab, ≲20 μm. Applying this same factor difference to the experimental shadowgraphs would indicate that the plasma slab at the collision time was 30–40 μm thick, similar to the predicted optimal value Lopt for CSA (Sec. I).
From Fig. 12(a), the peak density at the collision time is
VII. DISCUSSION
Even if the thickness of the plasma slab is close to optimal, its density needs also to be adjusted to an optimal value that depends on the laser intensity. To drive a strong collisionless shock and accelerate ions at high energies, high laser absorption is required (see Sec. V), which implies ne ∼ γnc. With a0 ∼ 4 at LULI and 8 at GSI, this leads to ne/nc ∼ 3 and 5.7, respectively. Our previous numerical study49 also showed that the maximum proton energy drops quickly below this optimal value. The density of the plasma slab was thus probably too low for optimal proton acceleration. An easy way to produce plasma slabs of higher density is to increase the backing pressure of the gas jet, as long as the residual density in the wing of the slab does not disturb the propagation of the ps laser beam.
The efficiency of the acceleration depends not only on the intensity of the ps laser, but also on the size of its focal spot.14 The shock width (which is close to the laser spot size W0) has to be large enough that the plasma, expanding transversely at the sound speed, does not leave the shock region before the acceleration occurs. Assuming an isothermal expansion, this condition yields W0 ≳ L/M. Taking for M the minimum value required for the shock to reflect protons, Mcr = 1.6, and L = 40 μm leads to W0 ≳ 25 μm. The focal spot on the LULI and GSI experiments (FWHM
The clearly peaked spectra observed with the two-sided tailoring indicate that even if the plasma slab is relatively narrow, the density gradient at its backside is not very sharp, avoiding TNSA, and presenting a “slowly” decreasing profile with a small and constant sheath electric field, favoring monoenergetic acceleration.13
VIII. CONCLUSIONS
We recently proposed a new technique of plasma tailoring by laser-driven hydrodynamic shockwaves generated on both sides of a gas jet. In a continuation of this numerical work, we have studied experimentally the influence of the tailoring on proton acceleration driven by a high-intensity ps laser in three cases: without tailoring, by tailoring only the entrance side of the ps laser, and by tailoring both sides of the gas jet. Without tailoring, the acceleration is transverse to the laser axis, with a low-energy exponential spectrum, produced by Coulomb explosion. When the front side of the gas jet is tailored, a forward acceleration appears, which is significantly enhanced when both the front and back sides of the plasma are tailored. This forward acceleration produces higher-energy protons (up to 5.5 MeV), with a peaked spectrum, and is in good agreement with the mechanism of CSA. The total number of accelerated protons is also enhanced by this two-sided tailoring. The spatiotemporal evolution of the plasma profile as been characterized by optical shadowgraphy of a probe beam. The refraction and absorption of this beam have been simulated by post-processing 3D hydrodynamic simulations of the plasma tailoring. The dynamics of the hydrodynamic shockwaves are reproduced well only if the low-intensity wing in the focal spot of the tailoring beams is taken into account. Comparison of the simulated shadowgraphs with the experimental ones has allowed estimation of the thickness (∼30–40 μm) and density
ACKNOWLEDGMENTS
Acknowledgment. The authors would like to thank the LULI staff and the GSI-PHELIX staff for their contribution. This work has received funding from the Fédération de Recherche PLAS@PAR. The results presented here are partially based on the experiment P189, which was performed at the PHELIX infrastructure at GSI Helmholtzzentrum fuer Schwerionenforschung, Darmstadt (Germany) in the context of FAIR Phase-0. The research leading to the PHELIX-GSI results has received funding from the European Union’s Horizon 2020 research and innovation program under Grant Agreement No. 871124 Laserlab-Europe, and by Grant No. ANR-17-CE30-0026-Pinnacle from the Agence Nationale de la Recherche.
References
[61] R. Z.Sagdeev. Cooperative phenomena and shock waves in collisionless plasmas. Rev. Plasma Phys., 4, 23(1966).


Set citation alerts for the article
Please enter your email address

© Copyright 2018-2021 | Chinese Laser Press. All Rights Reserved 沪ICP备15018463号-20