• Acta Optica Sinica
  • Vol. 39, Issue 11, 1124001 (2019)
Sa Yang, Renlong Zhou*, Dan Liu, Yongming Zhao, Qiawu Lin, and Shuang Li
Author Affiliations
  • School of Physics and Information Engineering, Guangdong University of Education, Guangzhou, Guangdong 510303, China
  • show less
    DOI: 10.3788/AOS201939.1124001 Cite this Article Set citation alerts
    Sa Yang, Renlong Zhou, Dan Liu, Yongming Zhao, Qiawu Lin, Shuang Li. Modulation and Sensing Properties of Graphene Plasma Based on Surface Electric Current Boundary Condition[J]. Acta Optica Sinica, 2019, 39(11): 1124001 Copy Citation Text show less
    Model structure and FDTD discrete Yee cell. (a) Lattice structure of graphene ribbon; (b) 3D FDTD discrete Yee cell with graphene ribbon at z=k+1/2 where a zero-thickness graphene ribbon is placed
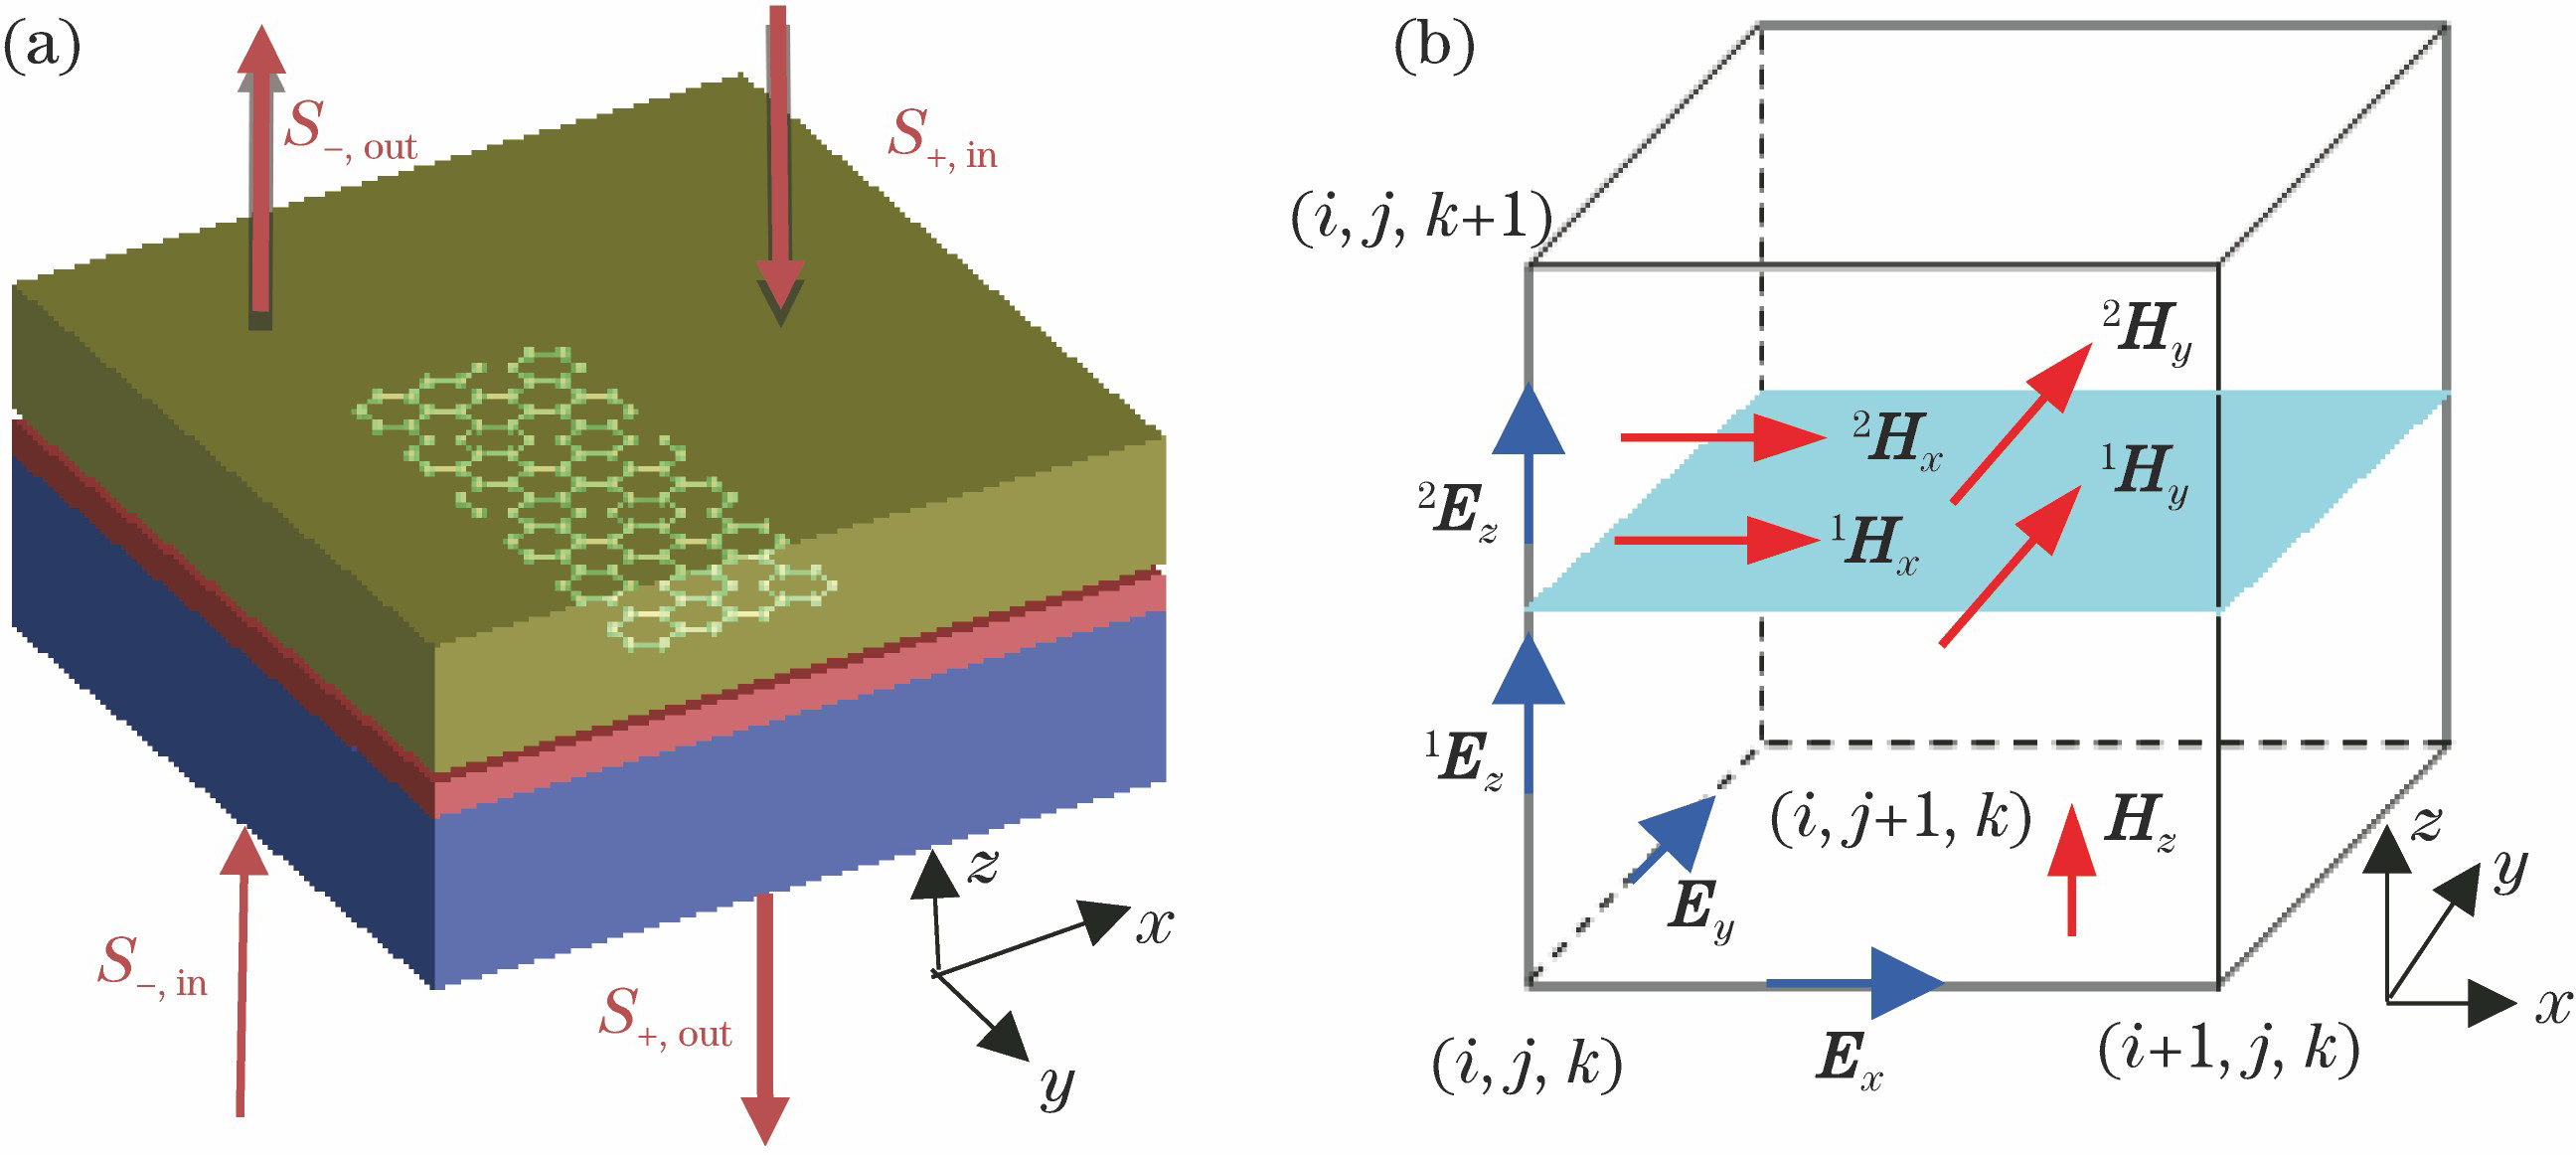
    Fig. 1. Model structure and FDTD discrete Yee cell. (a) Lattice structure of graphene ribbon; (b) 3D FDTD discrete Yee cell with graphene ribbon at z=k+1/2 where a zero-thickness graphene ribbon is placed
    Spectrogram and field patterns of unit cell. (a) Absorption spectrum of graphene ribbon unit cell; (b) distributions of electric field Ez at wavelength of 12.71 μm; (c) distributions of electric field Ez at wavelength of 13.92 μm
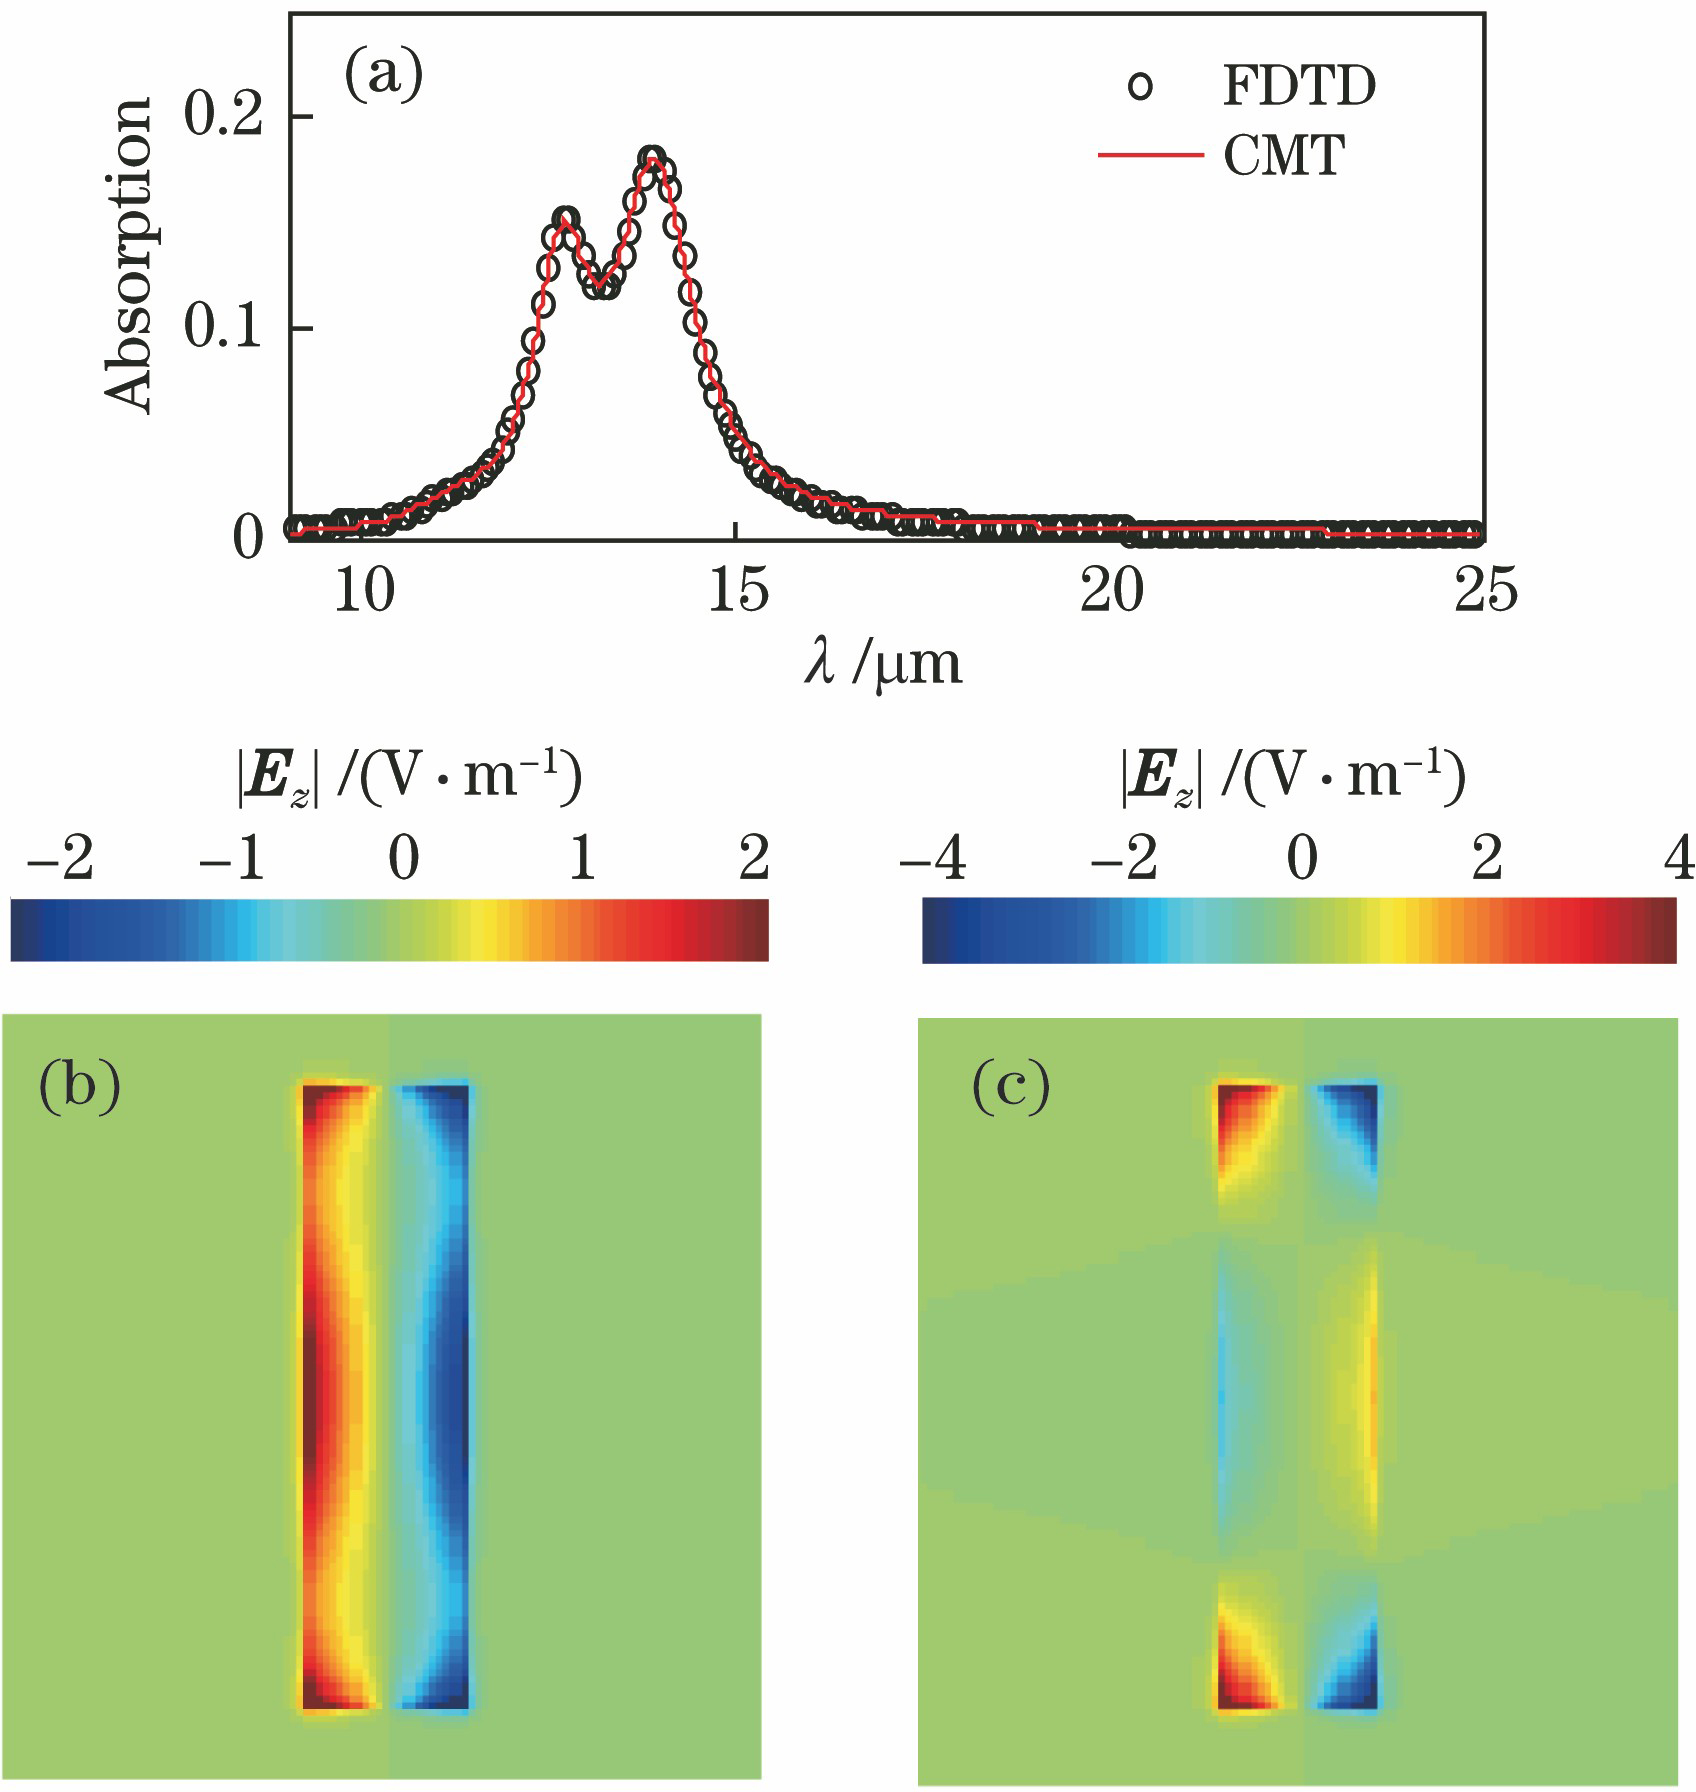
    Fig. 2. Spectrogram and field patterns of unit cell. (a) Absorption spectrum of graphene ribbon unit cell; (b) distributions of electric field Ez at wavelength of 12.71 μm; (c) distributions of electric field Ez at wavelength of 13.92 μm
    Effect of Ef on GSP absorption spectrum.(a)Absorption spectra of graphene ribbon when Ef is 0.4, 0.6, and 0.8 eV; (b) variation of absorption spectrum when Ef varies from 0.4 eV to 0.8 eV, continuously
    Fig. 3. Effect of Ef on GSP absorption spectrum.(a)Absorption spectra of graphene ribbon when Ef is 0.4, 0.6, and 0.8 eV; (b) variation of absorption spectrum when Ef varies from 0.4 eV to 0.8 eV, continuously
    Variations in λm,Eem, γim, and γwm under different Ef. (a) λm; (b) Eem; (c) γim; (d) γwm<
    Fig. 4. Variations in λm,Eem, γim, and γwm under different Ef. (a) λm; (b) Eem; (c) γim; (d) γwm<
    Effect of μ on GSP absorption spectrum. (a) Absorption spectra of graphene ribbon when μ is 0.4, 0.6, and 0.8 m2·(V·s)-1; (b) evolution of optical absorption of graphene ribbon when μ varies from 0.1 m2·(V·s)-1 to 1 m2·(V·s)-1 continuously
    Fig. 5. Effect of μ on GSP absorption spectrum. (a) Absorption spectra of graphene ribbon when μ is 0.4, 0.6, and 0.8 m2·(V·s)-1; (b) evolution of optical absorption of graphene ribbon when μ varies from 0.1 m2·(V·s)-1 to 1 m2·(V·s)-1 continuously
    Variations in λm, Eem, γim, and γwm with μ. (a) λm; (b) Eem; (c) γim; (d) γwm
    Fig. 6. Variations in λm, Eem, γim, and γwm with μ. (a) λm; (b) Eem; (c) γim; (d) γwm
    Effect of n1on GSP absorption spectrum. (a) Absorption spectra of graphene ribbon when n1 is 1.3, 1.6, and 1.9; (b) evolution of optical absorption of graphene ribbon when n1varies from 1 to 2
    Fig. 7. Effect of n1on GSP absorption spectrum. (a) Absorption spectra of graphene ribbon when n1 is 1.3, 1.6, and 1.9; (b) evolution of optical absorption of graphene ribbon when n1varies from 1 to 2
    Variations in λm, Eem, γim, and γwm with n1. (a) λm; (b) Eem; (c) γim; (d) γwm
    Fig. 8. Variations in λm, Eem, γim, and γwm with n1. (a) λm; (b) Eem; (c) γim; (d) γwm
    Modulation characteristics of quality factor and lifetime. (a) Variation in FFOMwith n1; (b) variation in τm with Ef; (c) variation in τm with μ; (d) variation in τm with n1
    Fig. 9. Modulation characteristics of quality factor and lifetime. (a) Variation in FFOMwith n1; (b) variation in τm with Ef; (c) variation in τm with μ; (d) variation in τm with n1
    MethodParameterEf=0.4 eVEf=0.45 eVEf=0.5 eVEf=0.55 eVEf=0.6 eVEf=0.65 eVEf=0.7 eVEf=0.75 eVEf=0.8 eV
    FDTDλ1/μm15.5314.6713.9813.2112.7111.9711.8811.5311.13
    λ2/μm16.8115.8715.2114.4713.9213.4112.9312.5912.23
    Ee1/10215.0116.3418.3321.2923.5726.2028.8131.4033.96
    Ee2/10224.1329.4134.3640.0444.5649.6054.5559.4164.17
    CMTγi1 /(1012 rad·s-1)8.427.286.646.075.695.315.034.714.45
    γi2 /(1012 rad·s-1)7.937.096.455.945.545.214.874.554.30
    γw1 /(1010 rad·s-1)0.881.031.421.822.182.583.013.594.03
    γw2 /(1010 rad·s-1)1.171.722.202.893.434.214.955.626.42
    Table 1. λm, Eem, γim, and γw
    MethodParameterμ=0.1 m2·(V·s)-1μ=0.2 m2·(V·s)-1μ=0.3 m2·(V·s)-1μ=0.4 m2·(V·s)-1μ=0.5 m2·(V·s)-1μ=0.6 m2·(V·s)-1μ=0.7 m2·(V·s)-1μ=0.8 m2·(V·s)-1μ=0.9 m2·(V·s)-1μ=1.0 m2·(V·s)-1
    FDTDλ1 /μm12.3112.3112.3112.3112.3112.3112.3112.3112.3112.31
    λ2 /μm13.4613.4613.4613.4613.4613.4613.4613.4613.4613.46
    Ee1 /1023.455.168.7611.5713.8416.1418.4320.9123.3225.67
    Ee2 /1023.457.6512.4718.3324.1029.4234.4839.3444.0448.59
    CMTγi1 /(1013 rad·s-1)5.473.131.891.291.050.930.810.680.590.57
    γi2 /(1012 rad·s -1)4.172.321.441.060.930.820.720.610.520.46
    γw1 /(1010 rad·s-1)0.330.680.961.231.481.721.952.162.352.52
    γw2 /(1010 rad·s-1)0.751.141.531.892.282.713.153.503.834.12
    Table 2. λm, Eem, γim, and γw
    MethodParametern1=1.0n1=1.1n1=1.2n1=1.3n1=1.4n1=1.5n1=1.6n1=1.7n1=1.8n1=1.9n1=2.0
    FDTDλ1 /μm12.3112.9013.5114.1514.7815.4316.0916.7917.4718.1918.90
    λ2 /μm13.5114.5114.8215.5216.2116.9317.6718.4319.1719.9420.72
    Ee1 /10226.9725.8524.7723.6822.6921.7320.8119.9119.0818.2617.51
    Ee2 /10251.4748.6645.9943.4341.1338.9236.8534.9233.1731.5129.98
    CMTγi1 /(1012 rad·s-1)5.095.105.115.125.135.145.155.165.175.185.19
    γi2 /(1012 rad·s-1)5.295.305.315.325.335.345.355.365.375.385.39
    γw1 /(1010 rad·s-1)2.872.993.103.223.343.463.593.713.833.964.08
    γw1 /(1010 rad·s-1)5.425.315.205.094.984.884.784.684.584.484.38
    Table 3. λm, Eem, γim, and γwm
    Sa Yang, Renlong Zhou, Dan Liu, Yongming Zhao, Qiawu Lin, Shuang Li. Modulation and Sensing Properties of Graphene Plasma Based on Surface Electric Current Boundary Condition[J]. Acta Optica Sinica, 2019, 39(11): 1124001
    Download Citation