
Yu WU, Heng WANG, Qi-Jin HAN, Xiao-Xiang LONG, Yue MA, Qing-Peng LI, Pu-Fan ZHAO, Song LI. A waveform matching-based method of improving laser footprint geolocation for GaoFen-7 spaceborne laser altimeter in mountainous areas[J]. Journal of Infrared and Millimeter Waves, 2022, 41(6): 1051
- Journal of Infrared and Millimeter Waves
- Vol. 41, Issue 6, 1051 (2022)
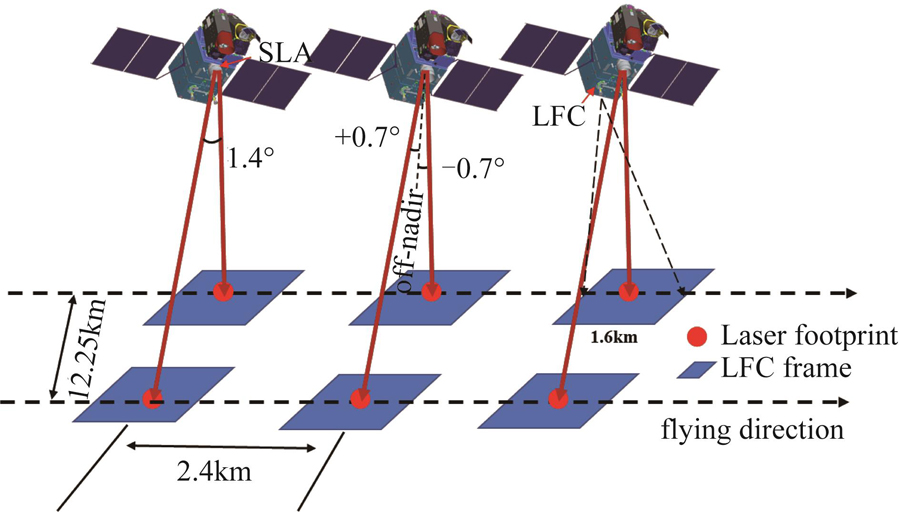
Fig. 1. Schematic diagram of GF-7 satellite laser altimeter for Earth observation
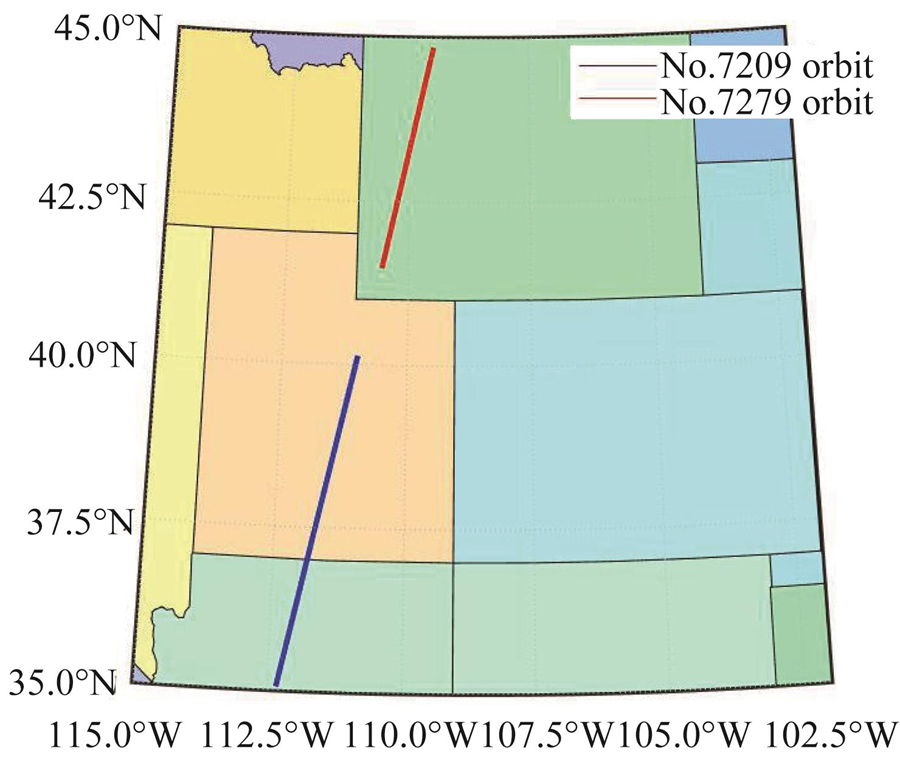
Fig. 2. Study area in USA and the laser track of GF-7 spaceborne laser altimeter
Fig. 3. Flowchart of improving laser footprints elevation accuracy by waveform matching method
Fig. 4. Sample of GF-7 No. 576 laser footprint in the study area (a) Local DEM near No.576 laser footprint, (b) normalized simulated waveforms and observed waveform of No.576 laser footprint at different positions, (c) correlation coefficient contour of No.576 laser footprint after the simulated and observed waveform matching.
Fig. 5. Three correlation coefficient contours of single laser footprints after waveform matching and their superimposed result, (a) oblique distribution of correlation coefficient, (b) vertical distribution of correlation coefficient, (c) transverse distribution of correlation coefficient, (d) superimposed result of (a-c) coefficient contours
Fig. 6. Correlation coefficient accumulation contour diagram of 41 laser footprints
Fig. 7. Elevation residual of laser footprints,(a) elevation residual comparison of laser footprints, (b) elevation residual histogram after recalculation
Fig. 8. Information of laser footprints with poor elevation accuracy (a) DEM of No.564 laser footprint, (b) observed and divided waveforms of No.564 laser footprint, (c) DEM of No.567 laser footprint, (d) observed and divided waveforms of No.567 laser footprint
|
Table 1. Statistics of airborne lidar point cloud data in USA and parameters of GF-7 spaceborne laser altimeter
|
Table 2. System parameters of SLA calculated by different methods
|
Table 3. Elevation residual of laser footprints in Wyoming State

Set citation alerts for the article
Please enter your email address
© Copyright 2018-2021 | Chinese Laser Press. All Rights Reserved 沪ICP备15018463号-20