
Guoxuan Liu, Ning Xu, Huaidong Yang, Qiaofeng Tan, Guofan Jin. Miniaturized structured illumination microscopy with diffractive optics[J]. Photonics Research, 2022, 10(5): 1317
- Photonics Research
- Vol. 10, Issue 5, 1317 (2022)
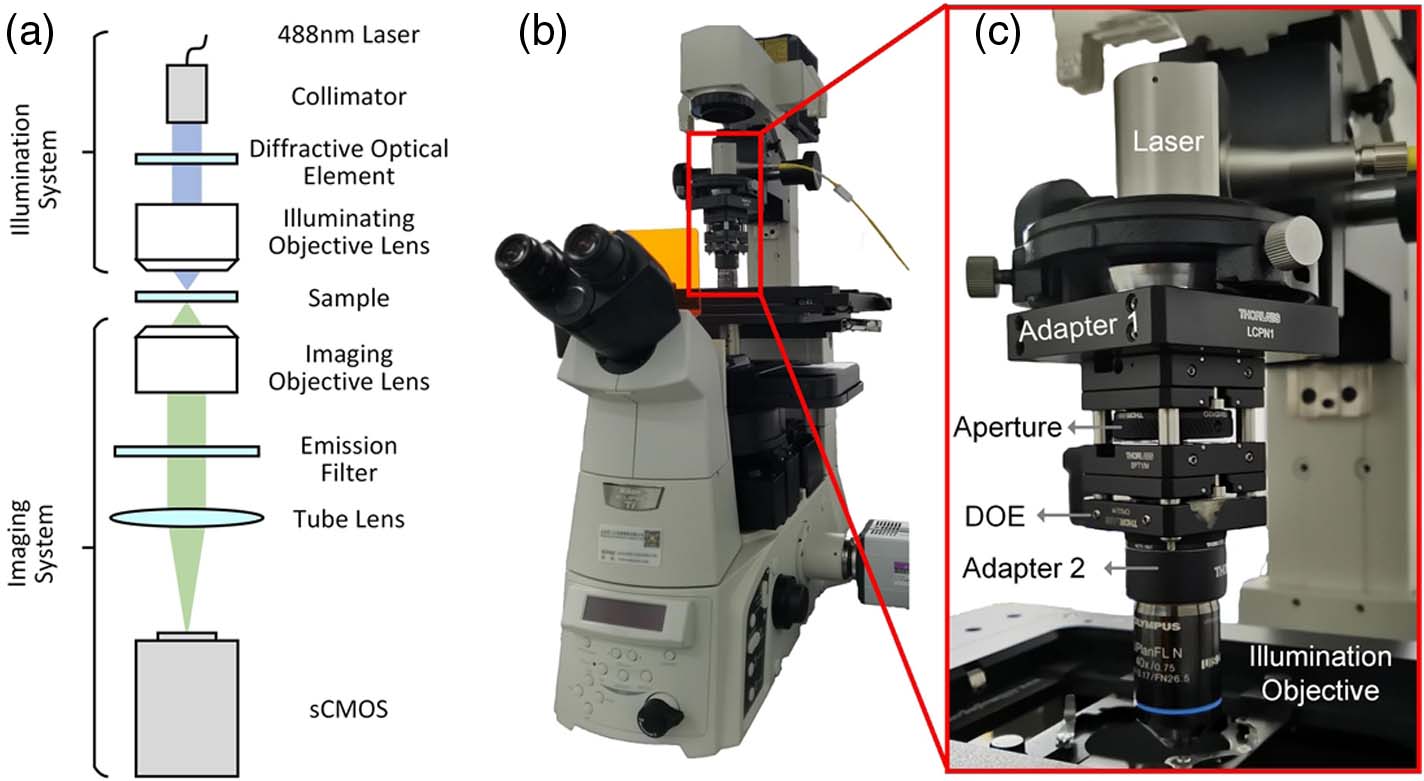
Fig. 1. Mini SIM prototype. (a) Optical diagram of Mini SIM. (b) The whole Mini SIM system consists of an illumination system and an imaging system. (c) The miniaturized illumination system of the Mini SIM system, which is installed on the pillar of the microscope.
![Process flow to produce a DOE illumination. (a) Flowchart of the modified G-S algorithm for calculating phase distribution of DOEs to realize two-dimensional sinusoidal illumination. The black arrows and the red dotted arrows indicate the iteration and the initial phase calculation, respectively. Uin(x)=Ain(x)exp[iφ(x)] and Uout(u)=T(u)exp[iψ(u)] are respectively the complex field distributions in the DOE plane and the focal plane of the illuminating objective lens, where Ain(x) and T(u) are respectively the amplitude in the DOE plane and the focal plane, and φ(x) and ψ(u) are respectively the phases in the DOE plane and the focal plane. (b) Processes for realizing DOE and illumination: (b1) target intensity distribution generated by Eq. (1); (b2) generating discretized phase distribution by modified G-S algorithm; (b3) converting phase distribution into the DOE on a substrate with masks and chemical corrosion process, and the optical micrograph of the fabricated DOE can be obtained; (b4) two-dimensional sinusoidal structure is illuminated on the sample with a laser (see Visualization 1).](/richHtml/prj/2022/10/5/05001317/img_002.jpg)
Fig. 2. Process flow to produce a DOE illumination. (a) Flowchart of the modified G-S algorithm for calculating phase distribution of DOEs to realize two-dimensional sinusoidal illumination. The black arrows and the red dotted arrows indicate the iteration and the initial phase calculation, respectively. U in ( x ) = A in ( x ) exp [ i φ ( x ) ] U out ( u ) = T ( u ) exp [ i ψ ( u ) ] A in ( x ) T ( u ) φ ( x ) ψ ( u ) 1 ); (b2) generating discretized phase distribution by modified G-S algorithm; (b3) converting phase distribution into the DOE on a substrate with masks and chemical corrosion process, and the optical micrograph of the fabricated DOE can be obtained; (b4) two-dimensional sinusoidal structure is illuminated on the sample with a laser (see Visualization 1 ).
Fig. 3. Verification for DOE design. (a) and (b) are the numerical simulation and experimental result of the 40 × 40 NA = 0.75 5 μm
Fig. 4. Influence of intensity distribution in the focal plane with different distances between the DOE and entrance pupil of the illuminating objective.
Fig. 5. Imaging results of fluorescence beads. (a) Widefield image of fluorescence beads and enlarged ROI (lower right) in the boxed region. (b) Mini SIM image of fluorescence beads and enlarged ROI (lower right) in the boxed region. (c) Intensity profiles of fluorescence beads on the selected line in (a) and (b). Scale bar, 5 μm
Fig. 6. Imaging results of tubulins of A549 cells. (a) Widefield image of tubulins, enlarged ROI (lower right) in the boxed region, and Fourier spectrum (upper right) of the widefield image. (b) Mini SIM image of tubulins, enlarged ROI (lower right) in the boxed region, and Fourier spectrum (upper right) of the Mini SIM image. (c) Intensity profiles of tubulins on the selected line in (a) and (b). Scale bar, 5 μm
Fig. 7. Flow chart of Mini SIM reconstruction procedure.
Fig. 8. 0 - π

Set citation alerts for the article
Please enter your email address
© Copyright 2018-2021 | Chinese Laser Press. All Rights Reserved 沪ICP备15018463号-20