• Photonics Research
  • Vol. 10, Issue 2, 557 (2022)
Hong Jiang1, Weidong Zhang1, Guowei Lu1、2、3、6、*, Lulu Ye1, Hai Lin1, Jinglin Tang1, Zhaohang Xue1, Zheng Li1、2、3、7、*, Haitan Xu4、5、8、*, and Qihuang Gong1、2、3
Author Affiliations
  • 1State Key Laboratory for Mesoscopic Physics, Collaborative Innovation Center of Quantum Matter, Nano-optoelectronics Frontier Center of the Ministry of Education, School of Physics, Peking University, Beijing 100871, China
  • 2Collaborative Innovation Center of Extreme Optics, Shanxi University, Taiyuan 030006, China
  • 3Peking University Yangtze Delta Institute of Optoelectronics, Nantong 226010, China
  • 4Shenzhen Institute for Quantum Science and Engineering, Southern University of Science and Technology, Shenzhen 518055, China
  • 5School of Physical Sciences, University of Science and Technology of China, Hefei 230026, China
  • 6e-mail: guowei.lu@pku.edu.cn
  • 7e-mail: zheng.li@pku.edu.cn
  • 8e-mail: xuht@sustech.edu.cn
  • show less
    DOI: 10.1364/PRJ.445855 Cite this Article Set citation alerts
    Hong Jiang, Weidong Zhang, Guowei Lu, Lulu Ye, Hai Lin, Jinglin Tang, Zhaohang Xue, Zheng Li, Haitan Xu, Qihuang Gong. Exceptional points and enhanced nanoscale sensing with a plasmon-exciton hybrid system[J]. Photonics Research, 2022, 10(2): 557 Copy Citation Text show less
    Plasmon-exciton system with adjustable scattering spectrum. (a) Schematic of the plasmon-exciton system composed of a GNR and a monolayer WSe2 separated by an auxiliary layer of HfO2. (b) Scattering spectrum of the plasmon-exciton system. The purple points correspond to the scattering spectrum from numerical simulation, with a HfO2 thickness of 10 nm and a GNR length of 94 nm. The red curve is the double-Lorentzian fitting result of the scattering spectrum. Blue and green curves are the individual hybrid modes extracted from the fitting result. (c) Scattering spectra for various thicknesses (10 nm, 20 nm, and 30 nm) of HfO2 with GNR length of 94 nm. (d) Scattering spectra for various lengths (93 nm, 95 nm, and 97 nm) of GNR with HfO2 thickness of 20 nm.
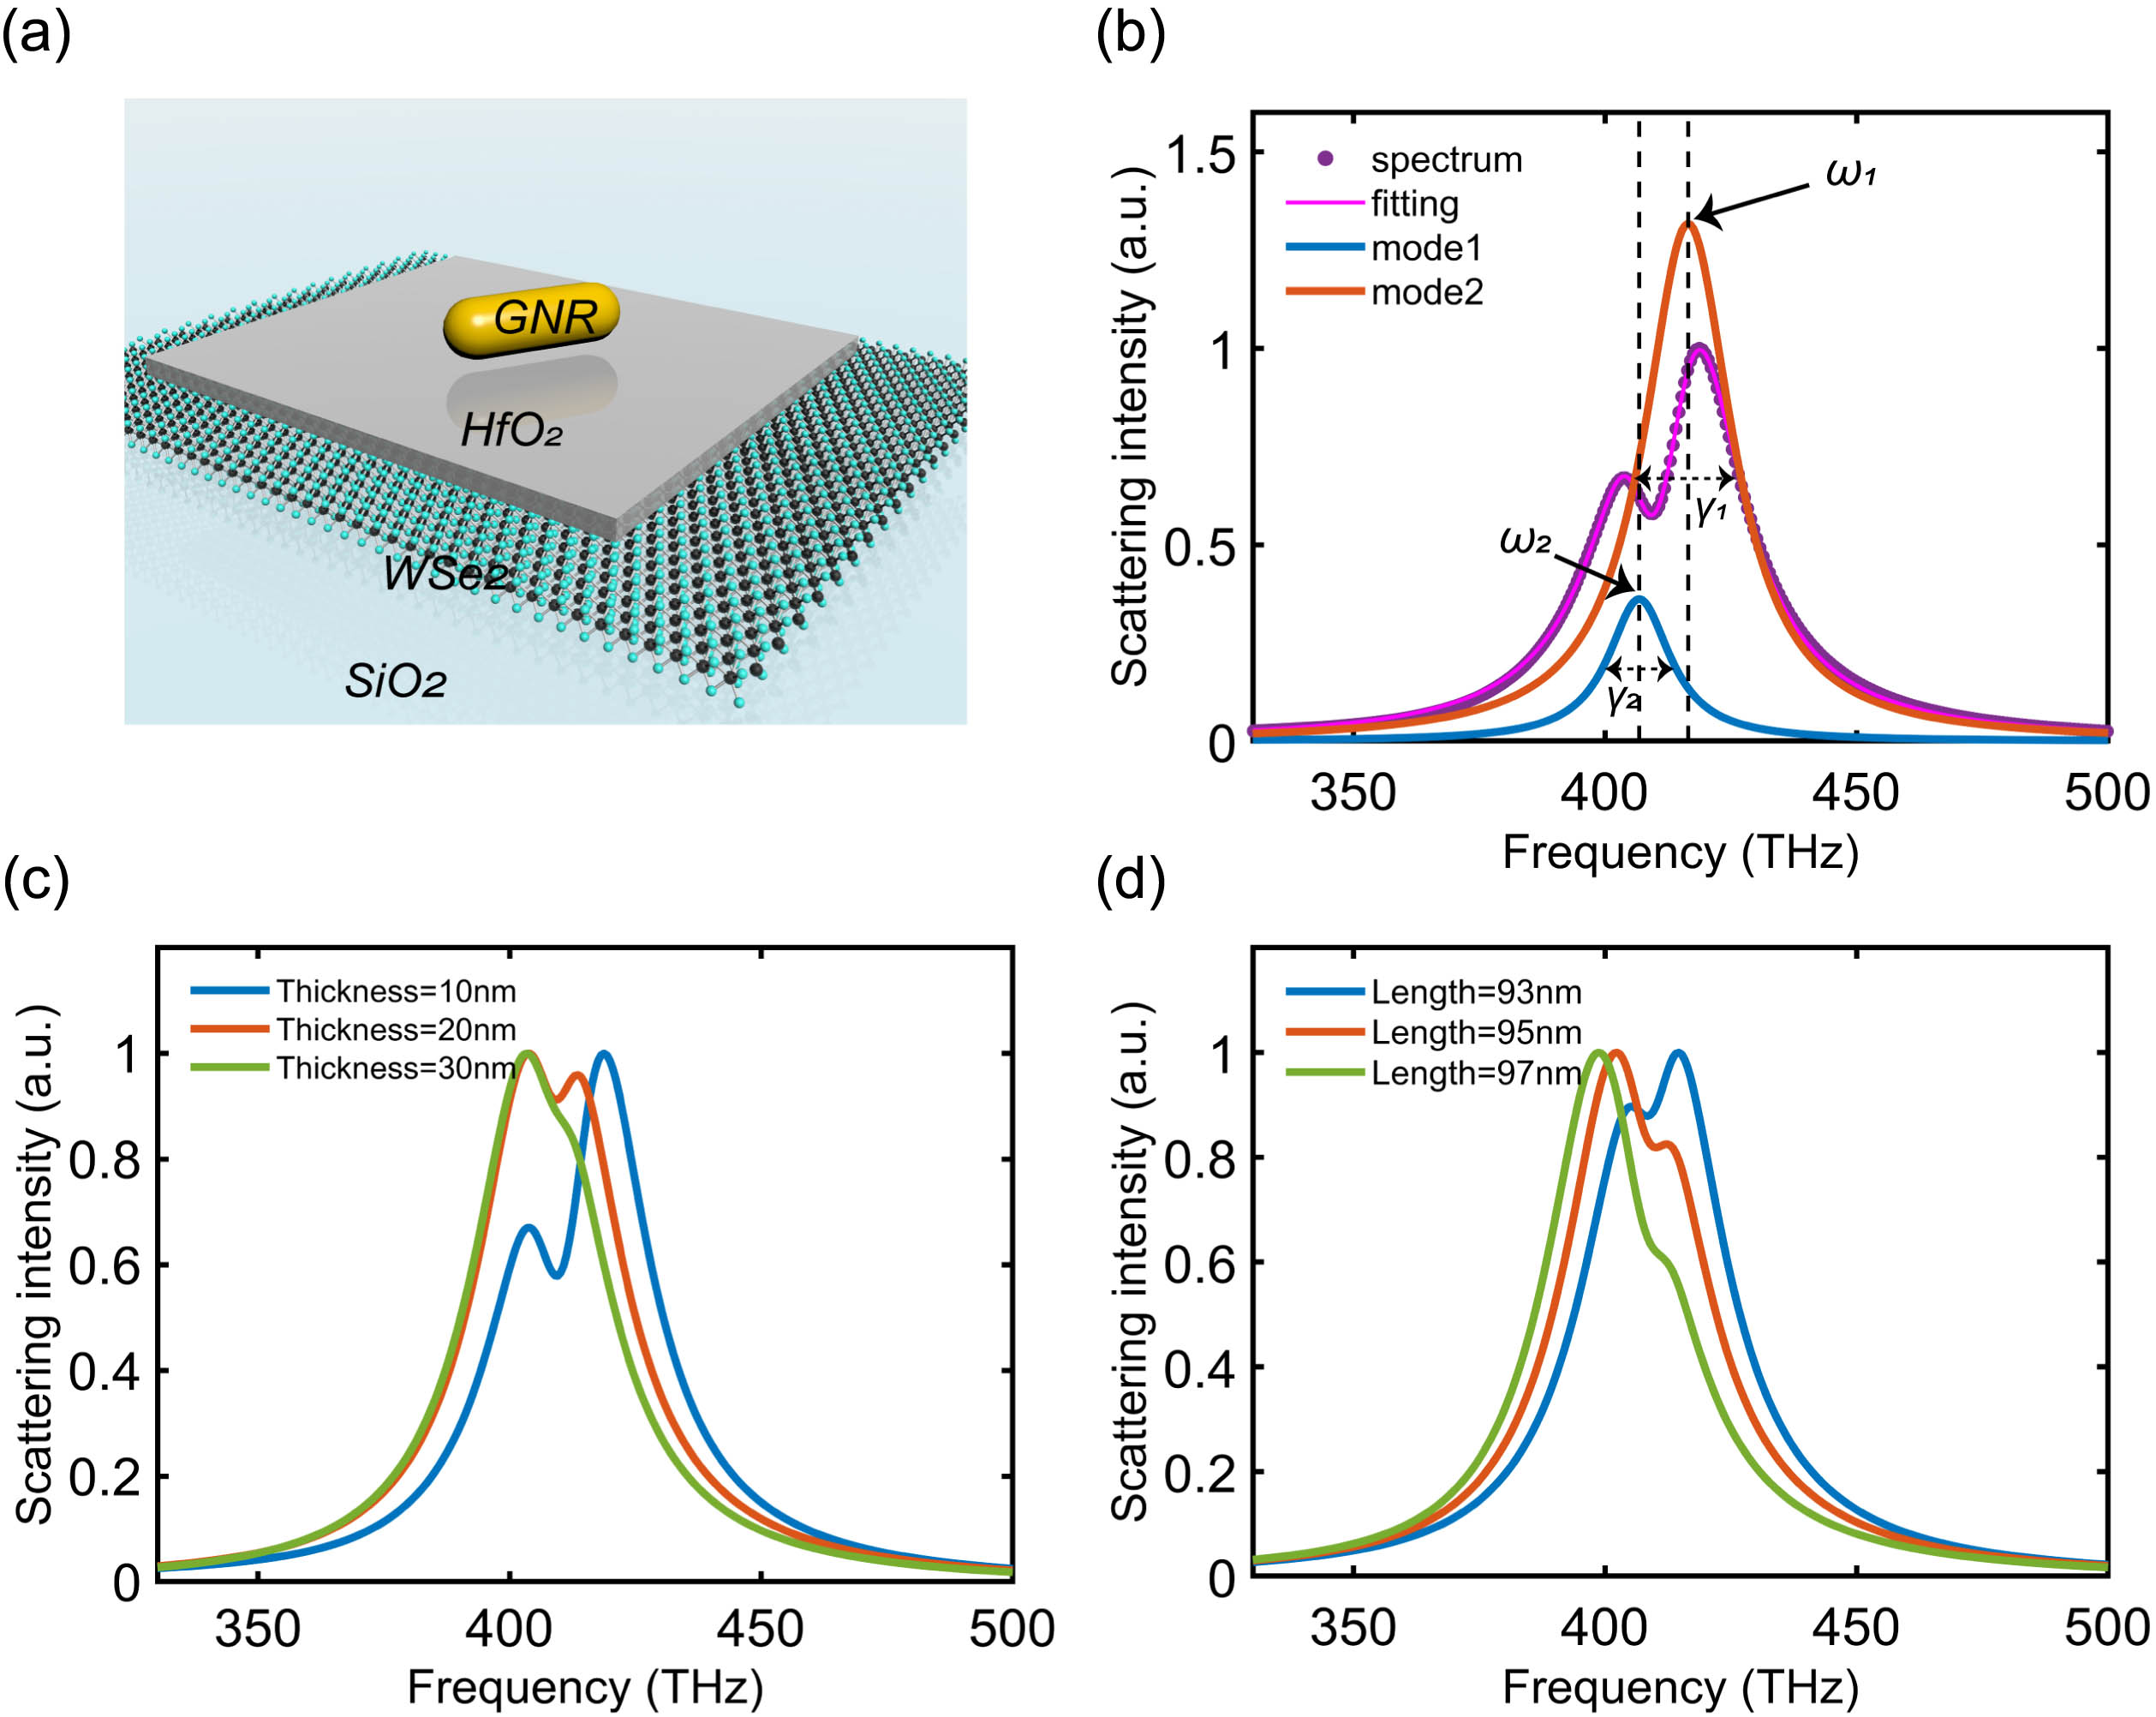
    Fig. 1. Plasmon-exciton system with adjustable scattering spectrum. (a) Schematic of the plasmon-exciton system composed of a GNR and a monolayer WSe2 separated by an auxiliary layer of HfO2. (b) Scattering spectrum of the plasmon-exciton system. The purple points correspond to the scattering spectrum from numerical simulation, with a HfO2 thickness of 10 nm and a GNR length of 94 nm. The red curve is the double-Lorentzian fitting result of the scattering spectrum. Blue and green curves are the individual hybrid modes extracted from the fitting result. (c) Scattering spectra for various thicknesses (10 nm, 20 nm, and 30 nm) of HfO2 with GNR length of 94 nm. (d) Scattering spectra for various lengths (93 nm, 95 nm, and 97 nm) of GNR with HfO2 thickness of 20 nm.
    Spectra and EPs of plasmon-exciton systems. (a) Plasmon-exciton system of configuration I, where GNR and WSe2 are separated by an auxiliary layer of HfO2. (b), (c) Resonance frequencies and loss rates of the plasmon-exciton system of configuration I, which correspond to the real and imaginary parts of the eigenspectrum of the hybrid system. The length of GNR and the thickness of HfO2 are the control parameters. An EP (green dot) is observed when WSe2 thickness ≈20 nm and GNR length ≈93.6 nm. The black and white lines correspond to a strong coupling regime (with avoided frequency crossing) and a weak coupling regime (with frequency crossing). (d) Plasmon-exciton system of configuration II, where GNR and WSe2 are placed directly on top of the SiO2 substrate. (e), (f) Resonance frequencies and loss rates of the plasmon-exciton system of configuration II, which correspond to the real and imaginary parts of the eigenspectrum of the hybrid system. The length of GNR and the distance between GNR and WSe2 are the control parameters. An EP (green dot) is observed when the distance ≈14 nm and GNR length ≈107.6 nm. The white and black lines correspond to a strong coupling regime (with avoided frequency crossing) and a weak coupling regime (with frequency crossing). Each grid point corresponds to a data point from numerical simulation. The grid lines and surface coloring are guides to the eye.
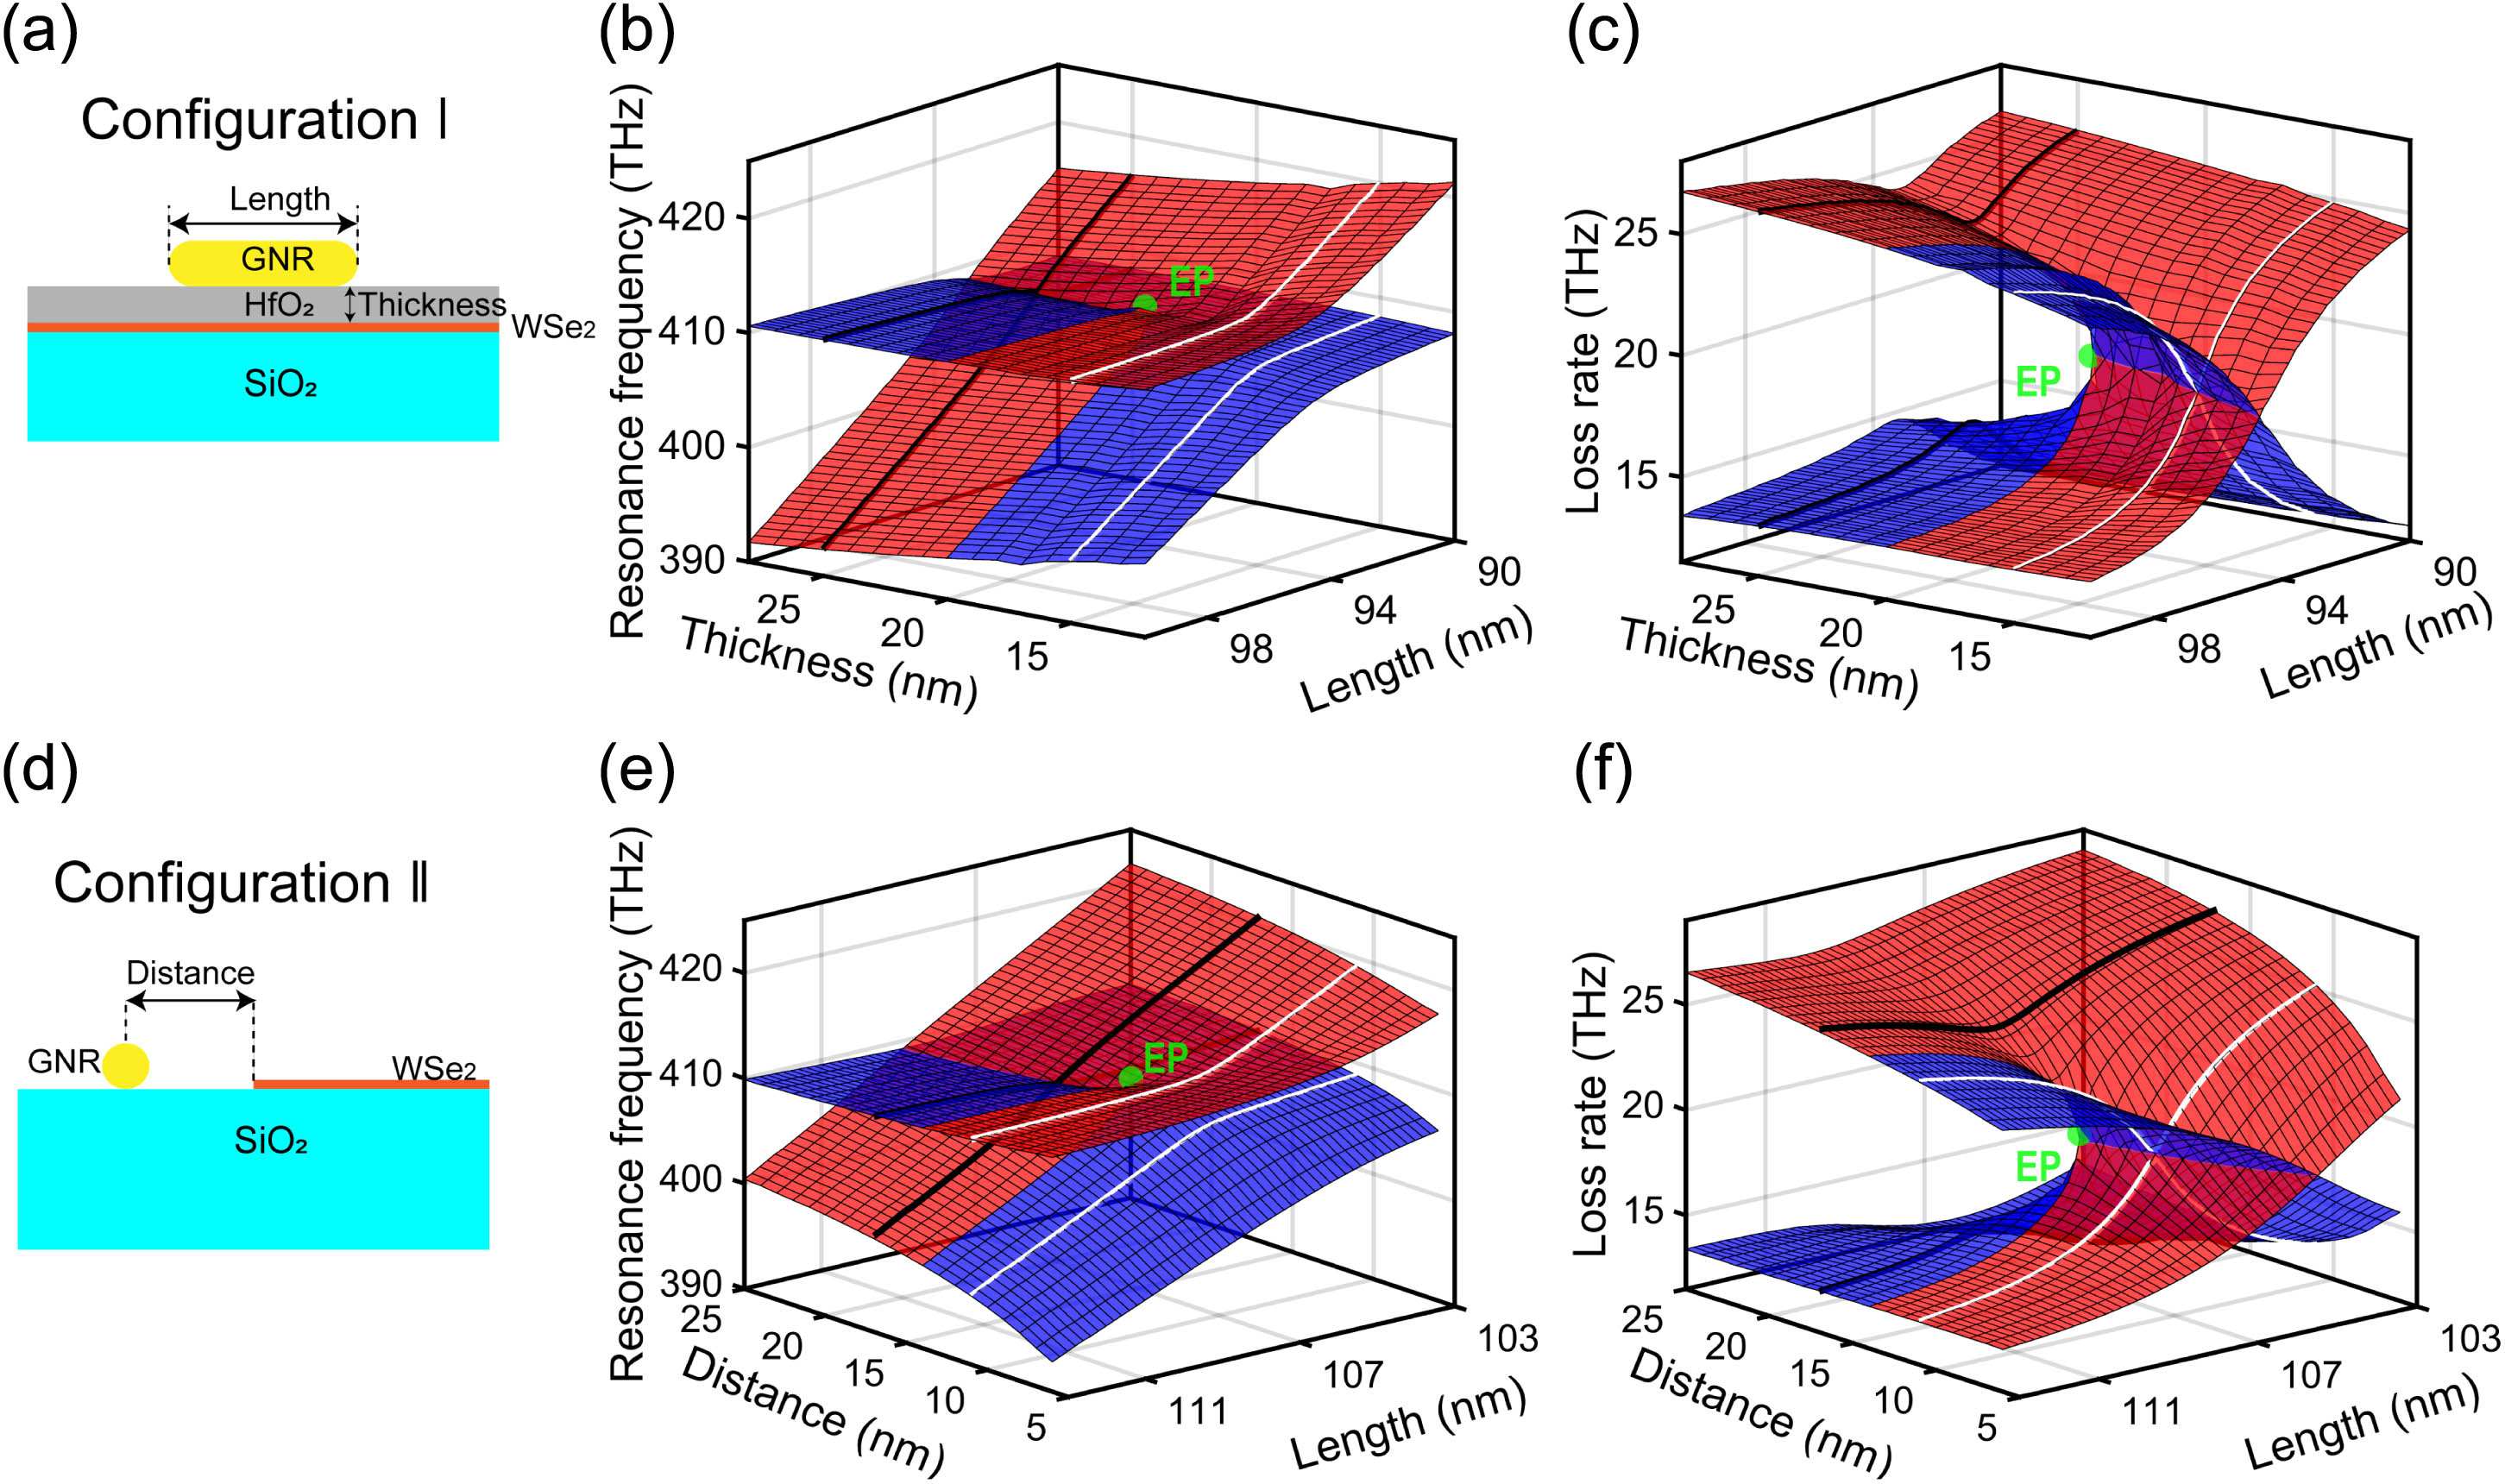
    Fig. 2. Spectra and EPs of plasmon-exciton systems. (a) Plasmon-exciton system of configuration I, where GNR and WSe2 are separated by an auxiliary layer of HfO2. (b), (c) Resonance frequencies and loss rates of the plasmon-exciton system of configuration I, which correspond to the real and imaginary parts of the eigenspectrum of the hybrid system. The length of GNR and the thickness of HfO2 are the control parameters. An EP (green dot) is observed when WSe2 thickness 20  nm and GNR length 93.6  nm. The black and white lines correspond to a strong coupling regime (with avoided frequency crossing) and a weak coupling regime (with frequency crossing). (d) Plasmon-exciton system of configuration II, where GNR and WSe2 are placed directly on top of the SiO2 substrate. (e), (f) Resonance frequencies and loss rates of the plasmon-exciton system of configuration II, which correspond to the real and imaginary parts of the eigenspectrum of the hybrid system. The length of GNR and the distance between GNR and WSe2 are the control parameters. An EP (green dot) is observed when the distance 14  nm and GNR length 107.6  nm. The white and black lines correspond to a strong coupling regime (with avoided frequency crossing) and a weak coupling regime (with frequency crossing). Each grid point corresponds to a data point from numerical simulation. The grid lines and surface coloring are guides to the eye.
    Sensing of environmental refractive index with a plasmon-exciton sensor. (a) Scattering spectra of EP-enhanced sensing of environmental refractive index with a plasmon-exciton sensor. The system is covered by a cladding layer with a refractive index of n=1.005, 1.01, or 1.015 to simulate the environmental refractive index change. The sensing is performed near the EP (with HfO2 thickness = 20 nm and GNR length = 93.6 nm). (b) Scattering spectra of regular sensing with a GNR-only sensor (HfO2 thickness = 20 nm and GNR length = 93.6 nm). The configuration is similar to that in (a) for comparison but without the WSe2 monolayer. There is no EP in this system. (c) Variation of resonance frequency difference [Δω=Δ(ω1−ω2)] and loss rate difference [Δγ=Δ(γ1−γ2)] between the hybrid modes of the plasmon-exciton sensor and variation of resonance frequency and loss rate of the GNR-only sensor in response to environmental refractive index change. (d) Absolute value variation of the eigenvalue difference [ΔE=(Δω)2+(Δγ/2)2] between the hybrid modes of the plasmon-exciton sensor near the EP and absolute value variation of the eigenvalue of the GNR-only sensor in response to environmental refractive index change. The EP-enhanced plasmon-exciton sensor is more sensitive to the variation of the refractive index and follows the square root signature near the EP, while the regular GNR-only sensor is less sensitive and follows a linear trend. For comparison, we also plot the absolute value variation of the eigenvalue difference of a plasmon-exciton sensor (with HfO2 thickness = 25 nm and GNR length = 100 nm) as a function of the environmental refractive index change. It shows a linear behavior similar to the regular GNR-only sensor, as the parameters are set far away from the EP.
    Fig. 3. Sensing of environmental refractive index with a plasmon-exciton sensor. (a) Scattering spectra of EP-enhanced sensing of environmental refractive index with a plasmon-exciton sensor. The system is covered by a cladding layer with a refractive index of n=1.005, 1.01, or 1.015 to simulate the environmental refractive index change. The sensing is performed near the EP (with HfO2 thickness = 20 nm and GNR length = 93.6 nm). (b) Scattering spectra of regular sensing with a GNR-only sensor (HfO2 thickness = 20 nm and GNR length = 93.6 nm). The configuration is similar to that in (a) for comparison but without the WSe2 monolayer. There is no EP in this system. (c) Variation of resonance frequency difference [Δω=Δ(ω1ω2)] and loss rate difference [Δγ=Δ(γ1γ2)] between the hybrid modes of the plasmon-exciton sensor and variation of resonance frequency and loss rate of the GNR-only sensor in response to environmental refractive index change. (d) Absolute value variation of the eigenvalue difference [ΔE=(Δω)2+(Δγ/2)2] between the hybrid modes of the plasmon-exciton sensor near the EP and absolute value variation of the eigenvalue of the GNR-only sensor in response to environmental refractive index change. The EP-enhanced plasmon-exciton sensor is more sensitive to the variation of the refractive index and follows the square root signature near the EP, while the regular GNR-only sensor is less sensitive and follows a linear trend. For comparison, we also plot the absolute value variation of the eigenvalue difference of a plasmon-exciton sensor (with HfO2 thickness = 25 nm and GNR length = 100 nm) as a function of the environmental refractive index change. It shows a linear behavior similar to the regular GNR-only sensor, as the parameters are set far away from the EP.
    Nanoscale sensing of environmental refractive index with a plasmon-exciton sensor. (a) Schematic of nanoscale sensing of the environmental refractive index variation within the box region (200 nm×100 nm×100 nm) surrounding the GNR. (b) Absolute value variation of the eigenvalue difference [ΔE=(Δω)2+(Δγ/2)2] between the hybrid modes of the plasmon-exciton sensor in response to environmental refractive index change. The sensitivity of the EP-enhanced plasmon-exciton sensor for nanoscale refractive index variation (green) agrees well with that for homogeneous environmental refractive index variation (red), showing the square root signature near the EP.
    Fig. 4. Nanoscale sensing of environmental refractive index with a plasmon-exciton sensor. (a) Schematic of nanoscale sensing of the environmental refractive index variation within the box region (200  nm×100  nm×100  nm) surrounding the GNR. (b) Absolute value variation of the eigenvalue difference [ΔE=(Δω)2+(Δγ/2)2] between the hybrid modes of the plasmon-exciton sensor in response to environmental refractive index change. The sensitivity of the EP-enhanced plasmon-exciton sensor for nanoscale refractive index variation (green) agrees well with that for homogeneous environmental refractive index variation (red), showing the square root signature near the EP.
    Sensing of nanoparticle length. (a) Scattering spectra of EP-enhanced sensing of GNR length by plasmon-exciton hybridization. The GNR can be randomly placed on top of the sensor within the area of WSe2 to form a hybrid system. (b) Scattering spectra of regular sensing of a GNR. The configuration is similar to that in (a) for comparison, but without the WSe2 monolayer. There is no EP in this case. (c) Variation of resonance frequency difference and loss rate difference between the hybrid modes and variation of resonance frequency and loss rate of the single plasmonic mode in response to GNR length change. (d) Absolute value variation of the eigenvalue difference between the hybrid modes and absolute value variation of the eigenvalue of the single plasmonic mode in response to GNR length change. The EP-enhanced sensing with plasmon-exciton hybridization is more sensitive to nanoscale change in the GNR length and follows the square root signature near the EP, while regular sensing is less sensitive and follows a linear trend.
    Fig. 5. Sensing of nanoparticle length. (a) Scattering spectra of EP-enhanced sensing of GNR length by plasmon-exciton hybridization. The GNR can be randomly placed on top of the sensor within the area of WSe2 to form a hybrid system. (b) Scattering spectra of regular sensing of a GNR. The configuration is similar to that in (a) for comparison, but without the WSe2 monolayer. There is no EP in this case. (c) Variation of resonance frequency difference and loss rate difference between the hybrid modes and variation of resonance frequency and loss rate of the single plasmonic mode in response to GNR length change. (d) Absolute value variation of the eigenvalue difference between the hybrid modes and absolute value variation of the eigenvalue of the single plasmonic mode in response to GNR length change. The EP-enhanced sensing with plasmon-exciton hybridization is more sensitive to nanoscale change in the GNR length and follows the square root signature near the EP, while regular sensing is less sensitive and follows a linear trend.
    Hong Jiang, Weidong Zhang, Guowei Lu, Lulu Ye, Hai Lin, Jinglin Tang, Zhaohang Xue, Zheng Li, Haitan Xu, Qihuang Gong. Exceptional points and enhanced nanoscale sensing with a plasmon-exciton hybrid system[J]. Photonics Research, 2022, 10(2): 557
    Download Citation