
Hongyun XUE, Congyu WANG, Asad MAHMOOD, Jiajun YU, Yan WANG, Xiaofeng XIE, Jing SUN. Two-dimensional g-C3N4 Compositing with Ag-TiO2 as Deactivation Resistant Photocatalyst for Degradation of Gaseous Acetaldehyde [J]. Journal of Inorganic Materials, 2022, 37(8): 865
- Journal of Inorganic Materials
- Vol. 37, Issue 8, 865 (2022)
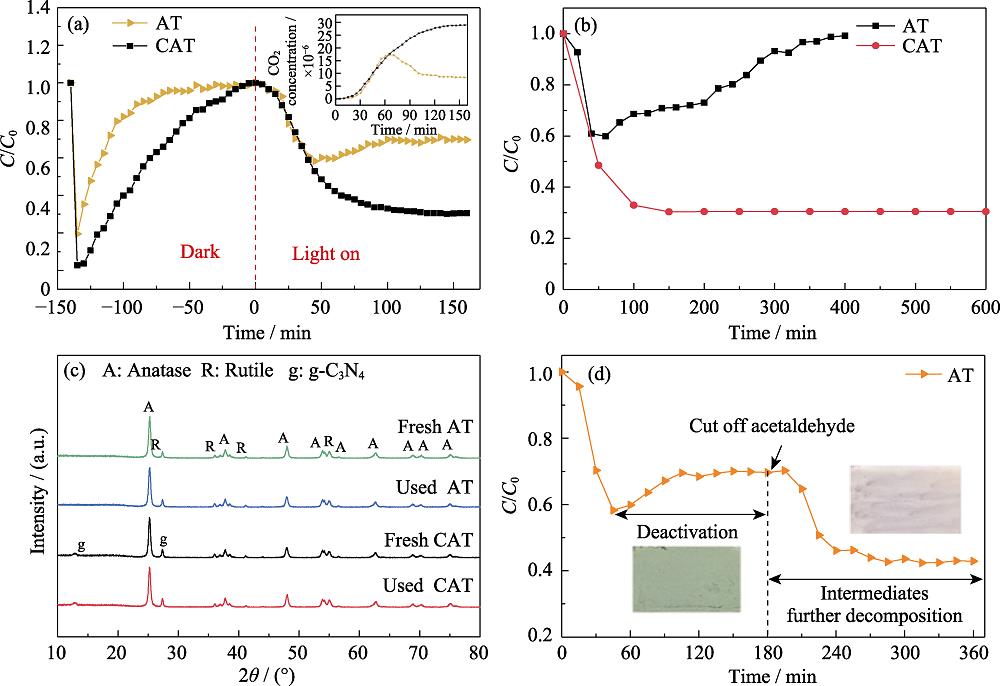
1. Activation maintained by CAT for gaseous acetaldehyde(a) Adsorption, photodegradation and CO2 generation curves of acetaldehyde gas by AT and CAT samples; (b) Photocatalytic degradation of acetaldehyde by AT sample under visible light irradiation for 400 min and CAT sample under visible light irradiation for 600 min; (c) XRD patterns of AT and CAT samples before and after degradation of acetaldehyde gas (160 min) under visible light irradiation; (d) Photocatalytic degradation of acetaldehyde by AT sample under visible light irradiation for 360 min, and cutting off acetaldehyde inlet at 180 min
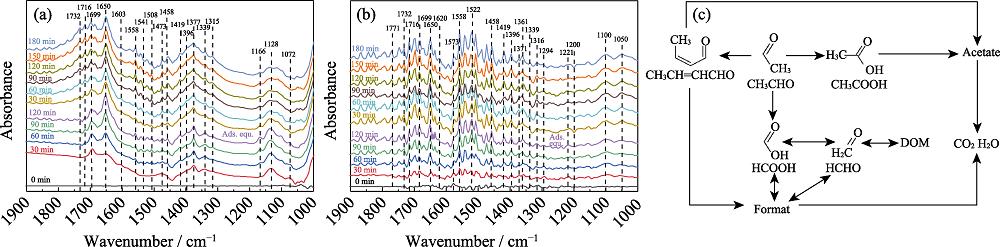
2. In-situ DRIFTS spectra of (a) AT and (b) CAT photocatalysts degrading acetaldehyde gas under visible light irradiation, and (c) photocatalytic reaction routes of acetaldehyde
3. Photocurrent and PL plots of the photocatalytic degradation of acetaldehyde(a) Photocurrent and (c) PL plots of AT sample for the photocatalytic degradation of acetaldehyde under visible light irradiation; (b) Photocurrent and (d) PL plots of the photocatalytic degradation of acetaldehyde by CAT sample under visible light irradiation for 300 min0, 60, 120, 180 min represent the photocatalytic reaction time of which the dotted lines of 240 and 300 min represent 1 and 2 h, respectively, when acetaldehyde was stopped but the light was kept on
4. ESR profiles of (a, c) DMPO-•O2- and (b, d) DMPO-•OH for the photocatalytic degradation of acetaldehyde by AT(a, b) and CAT (c, d) sample
Under visible light irradiation for 300 min0, 60, 120, 180 min represent the photocatalytic reaction time, of which the dotted lines of 240 and 300 min represent 1 and 2 h, respectively, when acetaldehyde was stopped but the light was kept on
5. Schematic of photocatalytic reaction mechanism
|
Table 1.
Assignment of FT-IR bands observed for AT sample in the process of dark adsorption and photocatalytic degradation for acetaldehyde
|
Table 2.
Assignment of FT-IR bands observed for CAT sample in the process of dark adsorption and photocatalytic degradation for acetaldehyde


Set citation alerts for the article
Please enter your email address

© Copyright 2018-2021 | Chinese Laser Press. All Rights Reserved 沪ICP备15018463号-20