• Chinese Optics Letters
  • Vol. 21, Issue 9, 092702 (2023)
Li Li1、2, Yu-Hao Pan1、2, Yi-Jia Liu1、2, Xiao-Long Zhou1、2, Dong-Yu Huang1、2, Ze-Min Shen1、2, Jian Wang1、2、*, Chuan-Feng Li1、2、3, and Guang-Can Guo1、2、3
Author Affiliations
  • 1CAS Key Laboratory of Quantum Information, University of Science and Technology of China, Hefei 230026, China
  • 2CAS Center for Excellence in Quantum Information and Quantum Physics, University of Science and Technology of China, Hefei 230026, China
  • 3Hefei National Laboratory, University of Science and Technology of China, Hefei 230088, China
  • show less
    DOI: 10.3788/COL202321.092702 Cite this Article Set citation alerts
    Li Li, Yu-Hao Pan, Yi-Jia Liu, Xiao-Long Zhou, Dong-Yu Huang, Ze-Min Shen, Jian Wang, Chuan-Feng Li, Guang-Can Guo. Experimental realization of strong coupling between a cold atomic ensemble and an optical fiber microcavity[J]. Chinese Optics Letters, 2023, 21(9): 092702 Copy Citation Text show less
    (a) Schematic diagram of the transport setup from MOT to the optical cavity mode. The 1064 nm ODT and 780 nm repumping laser beams are combined with a dichroic mirror and focused through an achromatic lens. The atoms are trapped in the 850 nm optical lattice, and the 780 nm probe laser is along the optical cavity axis, shown in the upper right. The 850 nm and 780 nm lasers are coupled into the optical cavity mode from the HT cavity mirror. HT, high-transmission cavity mirror; LT, low-transmission cavity mirror; (b) Experimental time sequence; T1, T2, T3, and T4 are different values in followed transport strategies. The ωc is the optical cavity resonant frequency, and the ωscan is the scanning width of the 780 nm probe frequency.
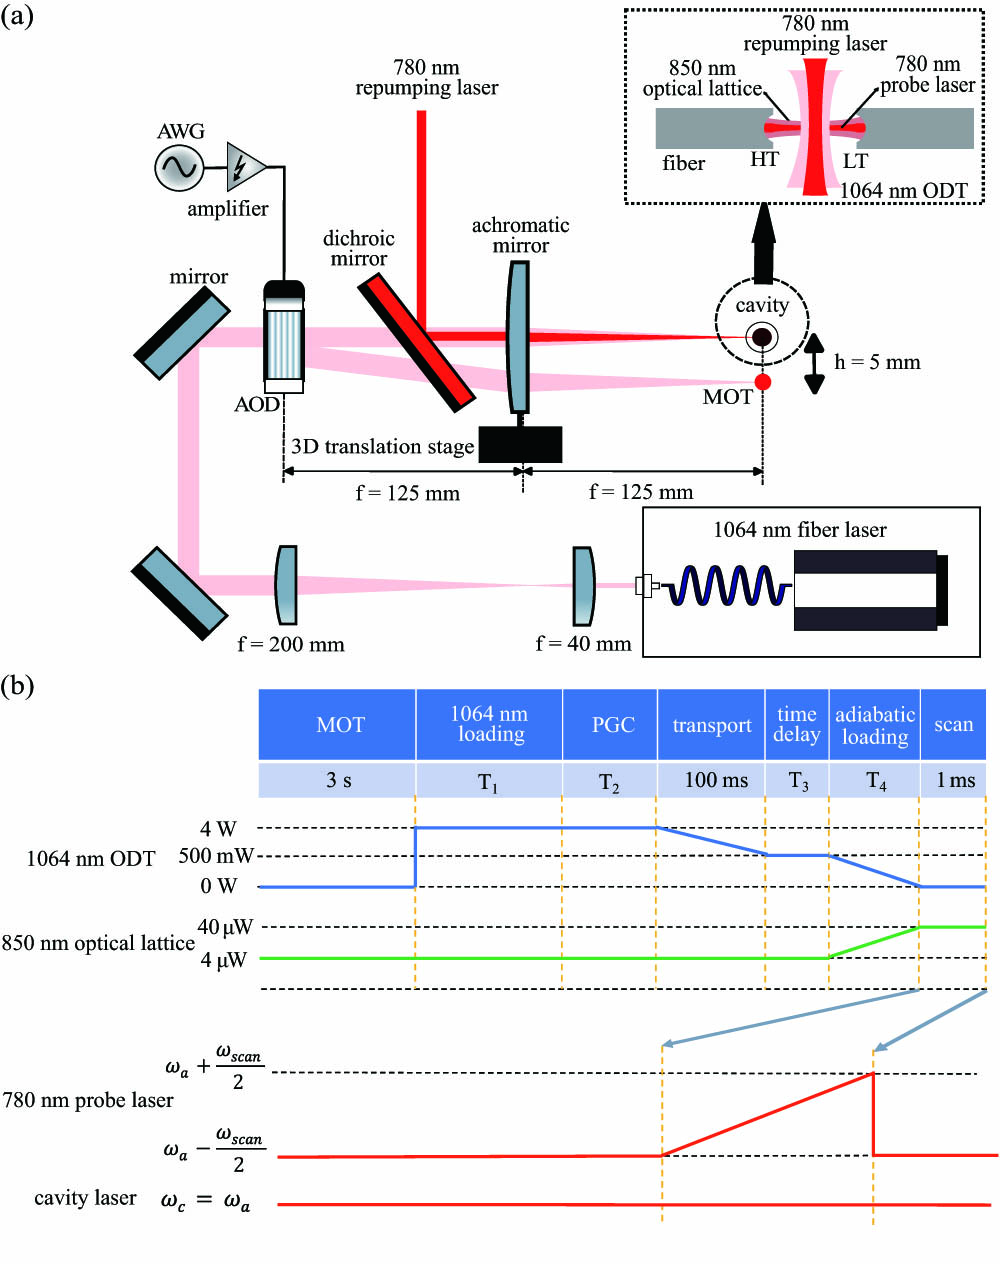
    Fig. 1. (a) Schematic diagram of the transport setup from MOT to the optical cavity mode. The 1064 nm ODT and 780 nm repumping laser beams are combined with a dichroic mirror and focused through an achromatic lens. The atoms are trapped in the 850 nm optical lattice, and the 780 nm probe laser is along the optical cavity axis, shown in the upper right. The 850 nm and 780 nm lasers are coupled into the optical cavity mode from the HT cavity mirror. HT, high-transmission cavity mirror; LT, low-transmission cavity mirror; (b) Experimental time sequence; T1, T2, T3, and T4 are different values in followed transport strategies. The ωc is the optical cavity resonant frequency, and the ωscan is the scanning width of the 780 nm probe frequency.
    (a) Transport process of the atoms from MOT to the optical cavity. (b) The atoms’ velocity profile is the active acceleration-deceleration strategy.
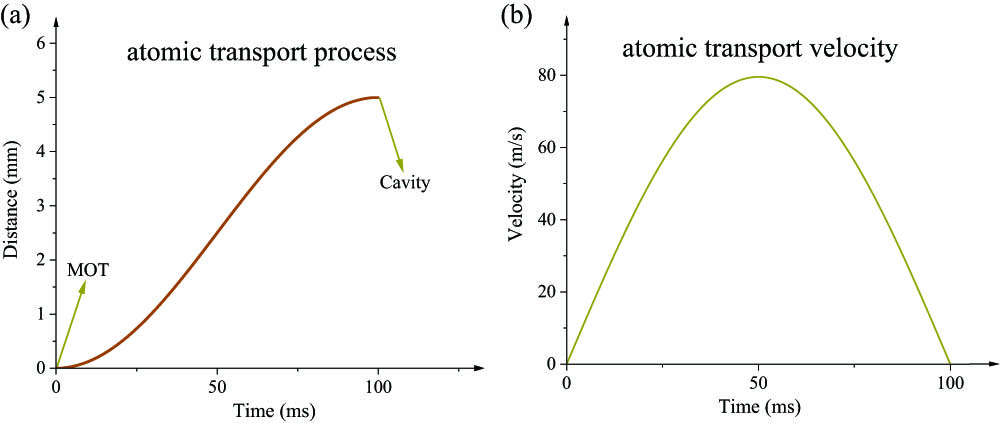
    Fig. 2. (a) Transport process of the atoms from MOT to the optical cavity. (b) The atoms’ velocity profile is the active acceleration-deceleration strategy.
    (a) Image of the 1064 nm ODT at MOT. The yellow ring is the location of the MOT. (b) Image of the 1064 nm ODT at the position of optical cavity; the A rectangular box represents atomic fluorescence in the optical cavity.
    Fig. 3. (a) Image of the 1064 nm ODT at MOT. The yellow ring is the location of the MOT. (b) Image of the 1064 nm ODT at the position of optical cavity; the A rectangular box represents atomic fluorescence in the optical cavity.
    Measurement of vacuum Rabi splitting. (a) Reflection spectrum of the atom–cavity system. Scatter is the experimental data. The black line is the Lorentz fitting of the cavity reflection spectrum and the red line is the vacuum Rabi splitting fitting. (b) Transmission spectrum of the atom–cavity system; the column is the experimental data. (c) The optimized reflection spectrum of the optimization with PGC in different 850 nm laser powers.
    Fig. 4. Measurement of vacuum Rabi splitting. (a) Reflection spectrum of the atom–cavity system. Scatter is the experimental data. The black line is the Lorentz fitting of the cavity reflection spectrum and the red line is the vacuum Rabi splitting fitting. (b) Transmission spectrum of the atom–cavity system; the column is the experimental data. (c) The optimized reflection spectrum of the optimization with PGC in different 850 nm laser powers.
    (a) Optimized reflection spectrum with PGC and adiabatic loading. (b) Optimized transmission spectrum in which the VRS is visible.
    Fig. 5. (a) Optimized reflection spectrum with PGC and adiabatic loading. (b) Optimized transmission spectrum in which the VRS is visible.
    Frequency shift of atoms in the |F = 2〉 level, which is pumped by the 780 nm cooling laser.
    Fig. 6. Frequency shift of atoms in the |F = 2〉 level, which is pumped by the 780 nm cooling laser.
    Transport StrategyCNgN (MHz)Neff
    PGC + no adiabatic loading182π × 450.2
    no PGC + adiabatic loading9382π × 32010
    PGC + adiabatic loading14662π × 40016
    Table 1. Results of the Strong Coupling Correspond to Different Transport Strategies
    Li Li, Yu-Hao Pan, Yi-Jia Liu, Xiao-Long Zhou, Dong-Yu Huang, Ze-Min Shen, Jian Wang, Chuan-Feng Li, Guang-Can Guo. Experimental realization of strong coupling between a cold atomic ensemble and an optical fiber microcavity[J]. Chinese Optics Letters, 2023, 21(9): 092702
    Download Citation