
Ziye Fang, Jingjing Yu. Simulation of Bioluminescence Tomography Based on Improved Half Threshold Algorithm[J]. Acta Optica Sinica, 2019, 39(10): 1017001
- Acta Optica Sinica
- Vol. 39, Issue 10, 1017001 (2019)
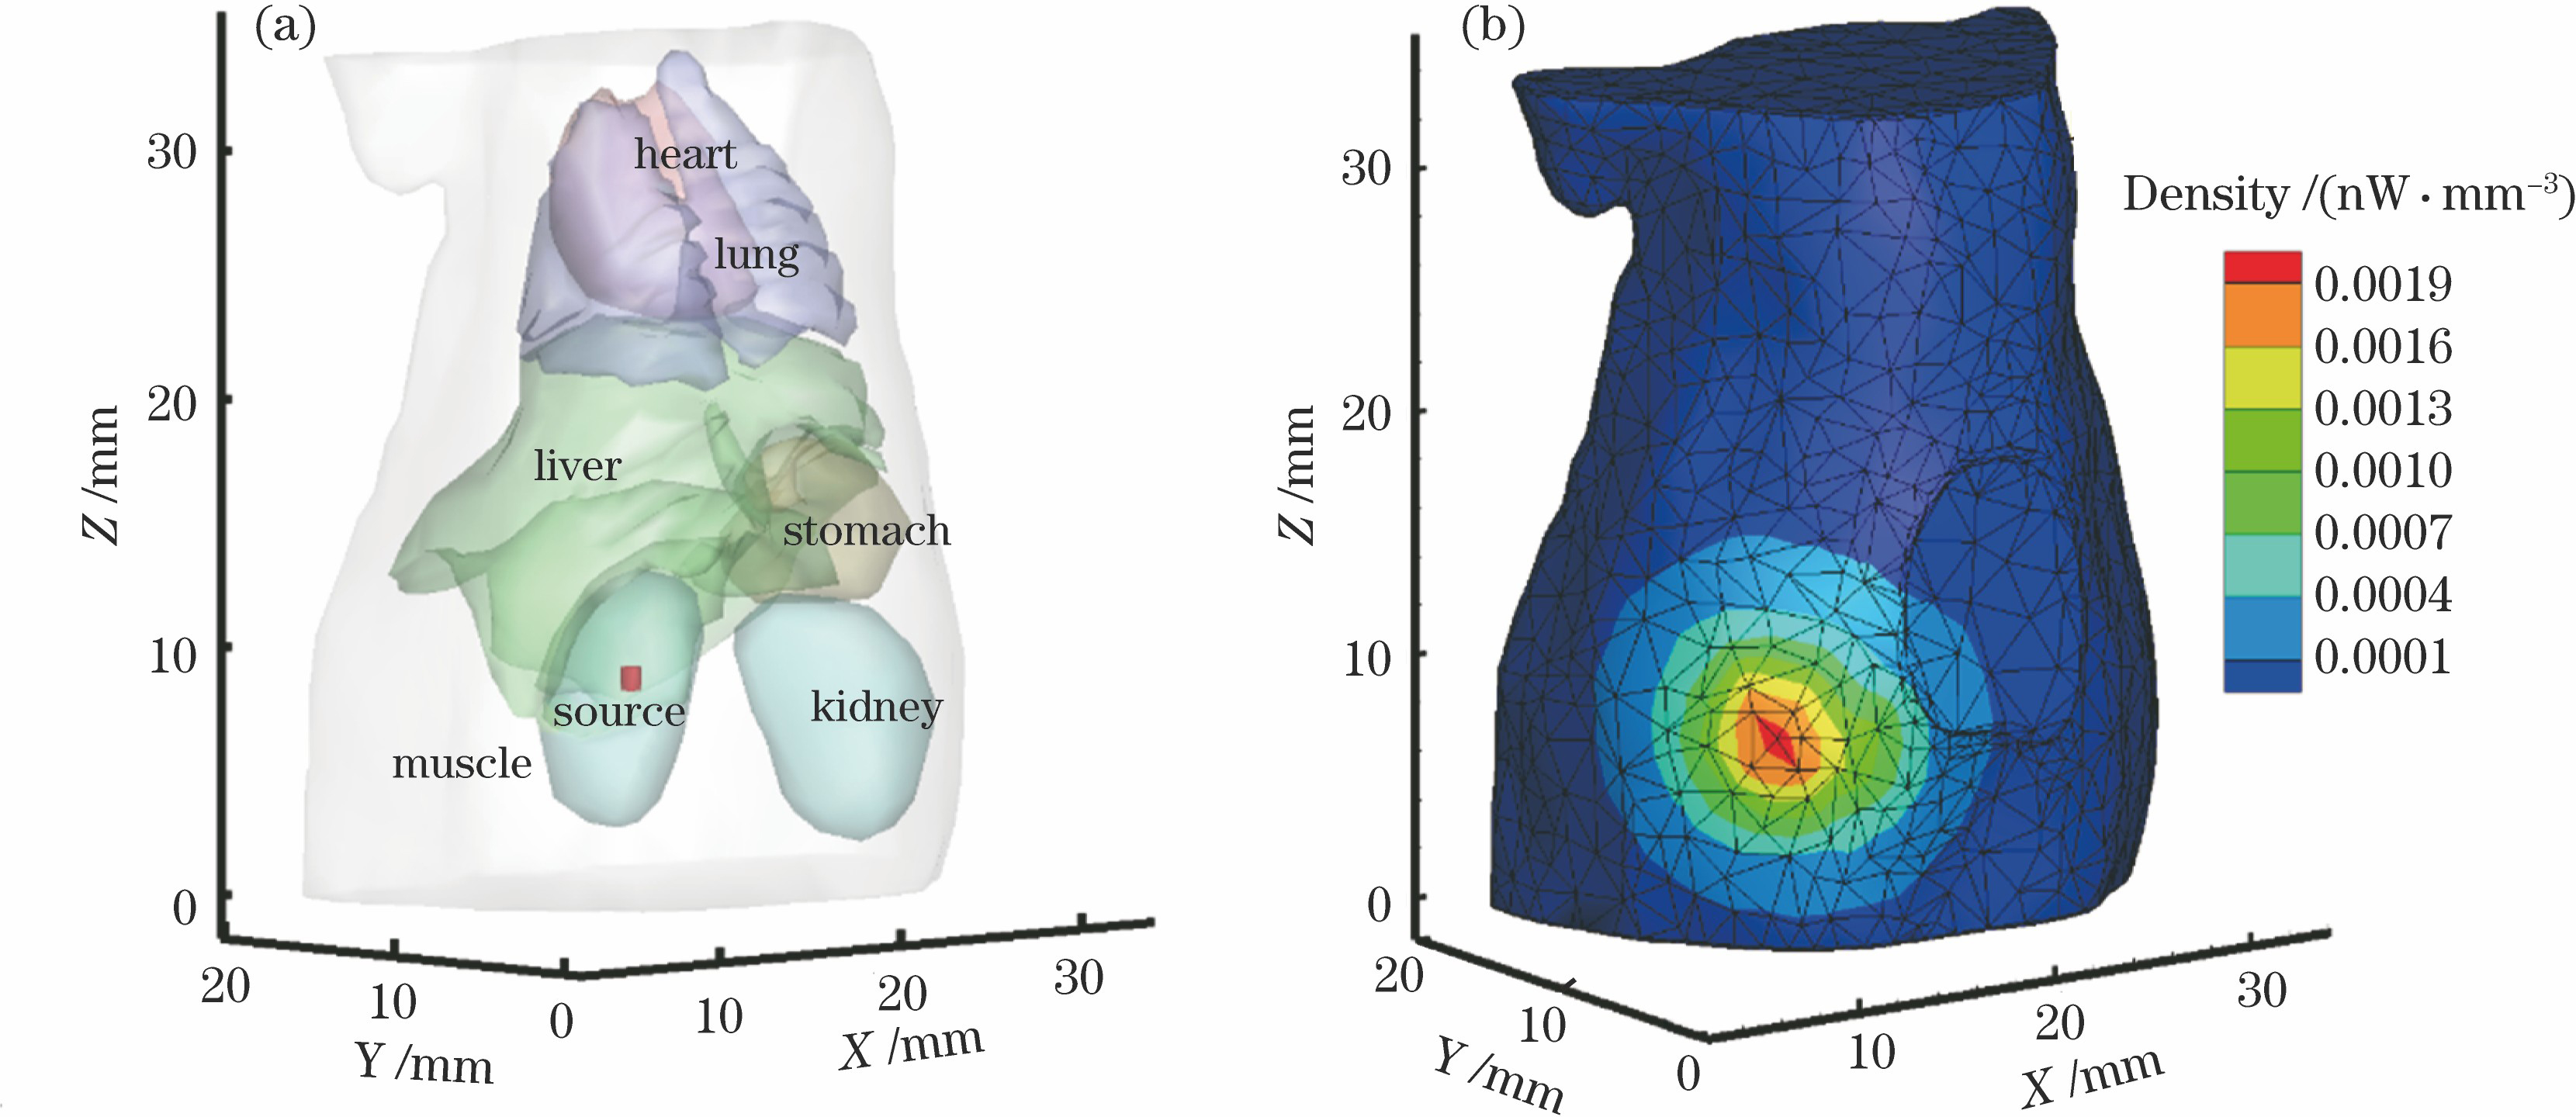
Fig. 1. Simulation experiment with single-source. (a) Digital mouse model containing source; (b) surface intensity distribution obtained by forward simulation
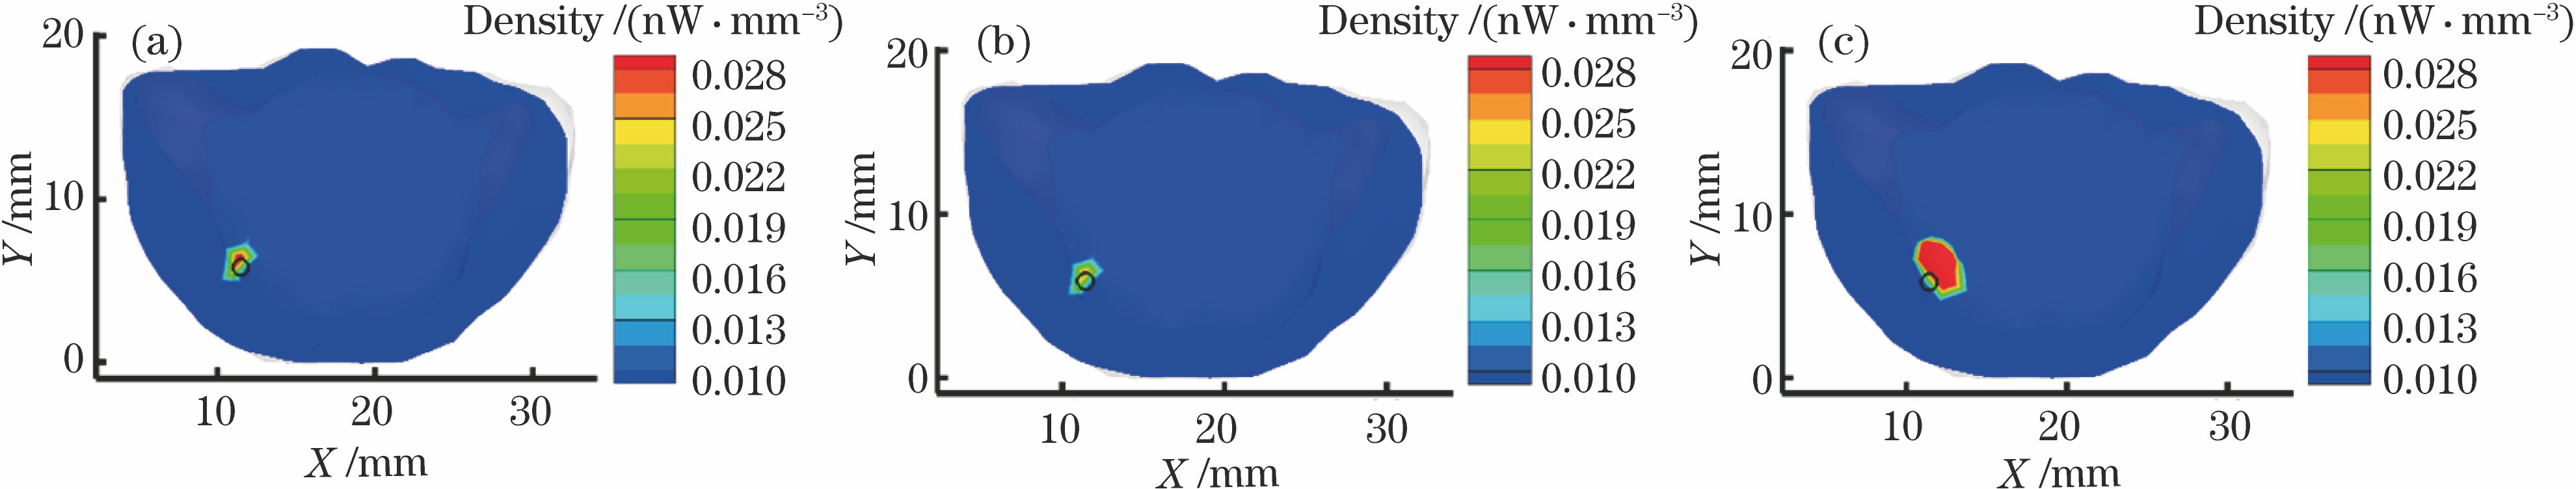
Fig. 2. Cross-sectional views of reconstruction results on the XY plane at Z =9.2 mm center of the real light source obtained by three algorithms in single-source case. (a) PHTPA; (b) HTA ; (c) IRW-L1/2. Black circle represents real light source
Fig. 3. Simulation experiments with double-light source. (a) Digital mouse model containing source; (b) surface intensity distribution when the density ratio is 1∶1; (c) surface intensity distribution when density ratio is 1∶2
Fig. 4. Cross-sectional views of reconstruction results on the XY plane at Z =17.0 mm center of the real light source obtained by three algorithms in double-source case. (a)-(c) Reconstruction results of PHTPA, HTA, and IRW-L1/2 when the density ratio is 1∶1; (d)-(f) reconstruction results of PHTPA, HTA, and IRW-L1/2 when the density ratio is 1∶2. Black circle represents the real light source
Fig. 5. Comparison of convergence rates of PHTPA(k =40) and HTA(k =50)
Fig. 6. E LE of PHTPA and HTA varying with sparse parameter k
|
Table 1. Optical parameters of digital mouse organs at 670 nm wavelength
|
Table 2. Reconstruction results in single-source case
|
Table 3. Reconstruction results in the double-source case when density ratio is 1∶1
|
Table 4. Reconstruction results in the double-source case with density ratio of 1∶2

Set citation alerts for the article
Please enter your email address
© Copyright 2018-2021 | Chinese Laser Press. All Rights Reserved 沪ICP备15018463号-20