
Yuxue Zhang, Bo Qing, Yang Zhao, Tianming Song, Zhiyu Zhang, Gang Xiong, Chengwu Huang, Tuo Zhu, Min Lv, Yan Zhao, Jiyan Zhang, Jiamin Yang. Experimental and simulation studies of thermal transport based on plasma flow motion in laser-ablated dense regions of Au and CH[J]. Matter and Radiation at Extremes, 2022, 7(4): 045902
- Matter and Radiation at Extremes
- Vol. 7, Issue 4, 045902 (2022)
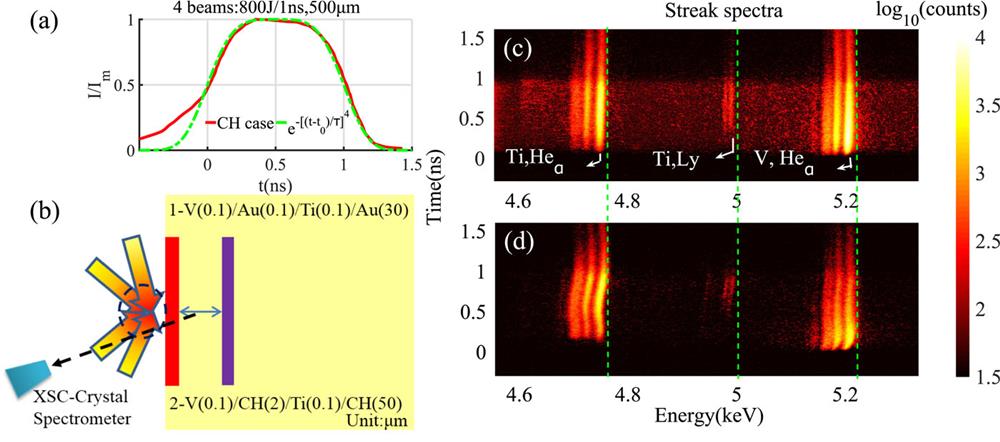
Fig. 1. (a) and (b) Schematic of four flat-top laser beams irradiating a sandwich-like target at angles of ±50° and ±75° to the normal to the target surface. Two targets were used: V(0.1)Au(0.1)Ti(0.1)Au(30) and V(0.1)CH(2)Ti(0.1)CH(50). In (a), the real profile of the CH shot is shown by the full red curve and the designed one by the dashed green curve. As shown in (b), a crystal spectrometer for the region of 4.5–5.4 keV combined with an x-ray streak camera (XSC) was located in the direction of 15° normal to the target surface. (c) and (d) Time-resolved self-emission spectra of the Au and CH targets from the spectrometer. The laser condition was the same for both targets, with each beam having 800 J energy and a 500 µ m focal spot and forming a 1 ns temporal super-Gaussian profile. The dashed green vertical lines are the reference positions of the emission lines from an ion at rest (4750 eV for Ti He-α , 5200 eV for V He-α , and 4977 eV for Ti Ly-α ). There are obvious shifts of the He-like (or Ly) lines of the V and Ti emission spectra in (d) compared with the spectra in (c).
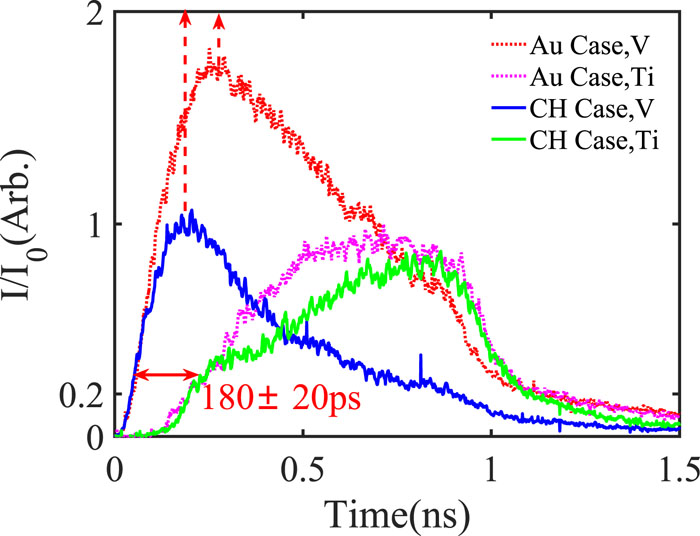
Fig. 2. Distribution of He-like spectral intensities for V and Ti in the case of (a) CH and (b) Au. Materials with similar areal densities (Au with 19.6 g/cm3 × 0.1 µ m and CH with 1 g/cm3 × 2.0 µ m) have similar delay times Δt = 180 ± 20 ps (at the half-width of the maximum intensity), corresponding to a mass-ablation rate of 1–1.25 × 10⁴ kg m−2 ns−1.
Fig. 3. Emission lines of Ti at 0.3, 0.5, and 1 ns in the case of CH. From a comparison of the results at t = 0.5 and 1 ns to that at t = 0.3 ns (almost the reference line without the influence of ion motion), the variations of the He-line centers from a red shift to a blue shift can clearly be seen.
Fig. 4. Motion of the Ti plasma flow determined from (a)–(c) experiment and (d)–(f) hydrodynamic simulations for the case of CH. (a) Doppler shift δ hv = E − E 0 of Ti, where E 0 is the photon energy of the static He-α line. (b) Experimental speed v and (c) trajectory x calculated by considering the image shift due to motion of the light source and the Doppler shift. (d) Electron density n e (x , t ), with the pink dots indicating the critical layer and the black line indicating the center of the Ti layer. (e) and (f) Speed and trajectory of Ti, respectively, from the simulation. The Ti layer is first compressed forward by the shock wave, causing a red shift of He emissions, but slows down and then moves backward owing to the expansion of the hot plasma after the laser has propagated through it. The transition lasts about Δt ≈ 0.25 ns in (c) and 0.22 ns in (f).
Fig. 5. Electron density n e (x , t ) for the case of Au from the simulation with f = 0.08. The black solid line indicates the center of the Ti layer for the case of a 2 µ m CH layer between V and Ti, while the blue dashed and blue dotted lines indicate the center of the Ti layer for the cases of 0.1 and 0.15 µ m Au layers, respectively.
Fig. 6. Evolution of the relative heat flux q /fq f from the simulation, where q is the total heat flux calculated using the SH model and q f is the free heat flux. It can be seen that the regions where q /fq f > 1 are mainly located in the critical density n cr layer (indicated by the green dashed line) and at the front of the heat wave near the Ti trajectory (indicated by the black dashed line).
Fig. 7. Profiles of (a) speed v and (b) trajectory x of the Ti layer from simulations with f = 0.1, 0.08, 0.06, and 0.04 and from experiments. The green dashed line shows a fit to the experimental results (blue dots). Divergences mainly occur from t = 0.5 to 0.8 ns after the shock has passed through the Ti and a heat wave arrives. The speed curves show that the best match with experiments is given by the simulations with f = 0.06 and 0.08, although there are some differences in detail.
Fig. 8. (a) Temperature profiles of the Ti layer in both cases of Au and CH. These were calculated by comparing the ratios of the Ly-α and the He-α lines of Ti in Figs. 1(c) and 1(d) with the theoretical results. It can be seen that the temperature gradient in the case of CH is much greater than that in the case of Au. (b) T e of Ti in the case of CH from simulations with f = 0.1, 0.08, 0.06 and from experiment. It can be seen that the experimental result from t = 0.7 ns onward agrees better with the simulated result for f = 0.1 than with the results for f = 0.08 and 0.06, but there is no agreement at all between experiment and simulations at t < 0.2 ns.
Fig. 9. Time-resolved spectrum for (a) 500 µ m CPP-smoothed focused lasers and (b) with ∼200 µ m tightly focused lasers irradiating sandwich-like targets of Ti(0.1)Au(0.1)Ti(0.1)Au(30). There is an initial red shift followed by a blue one in (b), but negligible shifts in (a).

Set citation alerts for the article
Please enter your email address
© Copyright 2018-2021 | Chinese Laser Press. All Rights Reserved 沪ICP备15018463号-20