
Yuxue Zhang, Bo Qing, Yang Zhao, Tianming Song, Zhiyu Zhang, Gang Xiong, Chengwu Huang, Tuo Zhu, Min Lv, Yan Zhao, Jiyan Zhang, Jiamin Yang. Experimental and simulation studies of thermal transport based on plasma flow motion in laser-ablated dense regions of Au and CH[J]. Matter and Radiation at Extremes, 2022, 7(4): 045902
- Matter and Radiation at Extremes
- Vol. 7, Issue 4, 045902 (2022)
Abstract
I. INTRODUCTION
Detailed understanding of the laser-ablation process in plastic (CH) and gold (Au) is of great importance for laser-driven inertial confinement fusion (ICF)1–8 and high-energy-density (HED) physics.9 In particular, laser absorption and subsequent energy transfer by electron conduction are the first steps in both direct-drive and indirect-drive configurations, and set the initial conditions for implosion and fusion ignition. CH and Au are among the most typical materials encountered in this context, with CH being a candidate material for the ablator of the capsule used to directly transfer laser energy to deuterium–tritium (DT) fuel in direct-drive ICF6 and Au usually being used to convert laser energy to thermal x-ray radiation in indirect-drive ignition.7,8,10 During the laser-ablation process, the motion of the plasma flow is an important feature characterizing the hydrodynamic processes associated with energy deposition and transfer,11–15 such as shock compression and plasma expansion. This process has been widely investigated through examination of the characteristics of the local plasma state using optical Thomson scattering16–19 or the spectral shift of the reflected laser pulse.20 As a probe or reflected laser can only propagate in an under-critical-density region, previous studies have been limited to the coronal region, and the influence of the motion of the plasma flow on energy transport in the dense electron-thermal-conduction region is still unclear.
In fact, the laser-ablation process is enormously complicated in the high-density region owing to the complexity of the material properties encountered there, namely, the equation of state, atomic emissivity, and opacity,21–25 and to the many physical processes involved, such as shock waves,11,26,27 heat waves, rarefaction waves,28 self-generated magnetic fields29,30 and even ion-acoustic turbulence.31,32 As a result, it is very difficult to accurately describe energy transport, especially electron thermal transport, in integrated hydrodynamic simulations.
Generally, the heat flux is expressed by the classical Spitzer–Härm (SH) model qSH = −kSH∇Te, but this fails as soon as , where λei is the electron–ion mean free path, Z is the effective atomic number, and Te/|∇Te| is the scale of the temperature gradient. Therefore, a quantity q = min(qSH, fqfs) is widely used to limit the flux, where f is a flux-limiting multiplier of the maximum free-streaming heat flux qfs.1,33–35f is essentially an empirical parameter and there remains some controversy regarding the choice of its value for ICF projects. It was once chosen as 0.15 to match the shock-timing and capsule bang-time in earlier experiments on the National Ignition Facility (NIF),21,36 but this value led to a series of issues, such as an over-predicted x-ray flux in the case of indirect drive and a neglect of heating asymmetry in the case of direct drive. Since then, a large number of experiments have been carried out to develop nonlocal models.29,37–40 In addition, smaller values of f have been chosen (e.g., in the range 0.03–0.06), and f has even been taken to be a time-dependent function in some studies to take account of nonlocal behavior arising from kinetic effects41 or from self-generated magnetic fields.30,33,42,43 This is still an topic of active debate. In fact, the motion of the plasma flow plays a complementary role to the nonlocality of heat transport26,34,35,44 through its influence on the value of λei. In our work, we pay close attention to the contribution of the heat transport process to the motion of the plasma flow and find that the flow is quite sensitive to this process.
Temperature evolution has provided much of the experimental data, and in some cases the only such data, for previous studies of thermal conductivity in plasmas.17,29,34,35,45–48 This has somewhat limited the accuracy with which numerical models can be checked, and it has also imposed restrictions on the extent to which these models can be applied to other experiments. There is therefore a need for multiparameter measurements under the same experimental condition to investigate the ablation process. In this regard, x-ray spectroscopy of multilayer targets has been demonstrated to provide reliable measurements of temperature, especially in the dense-plasma regime, in both planar-geometry17,29,45,46 and hohlraum experiments.34,35,47,48 Our work here is also based on this technique, but it also illustrates for the first time the great advantages of multiparameter measurements. Not only temperature variations, but also the velocities and trajectories in the plasma flow are revealed through spectral shifts. Thus, another parameter, namely the motion of the plasma flow, is taken into account in the laser-ablation process, facilitating the further development of research into thermal transport in plasmas.
In this paper, we investigate laser-ablation processes in high-Z Au and low-Z CH both experimentally and through radiation hydrodynamics simulations, and we propose a practical method to study thermal transport through characterizing velocities or trajectories in the motion of the plasma flow. Multiparameter measurements are performed by tracer x-ray spectroscopy with a streak camera, giving simultaneous results for the mass-ablation rate, the evolution of velocities and trajectories in the plasma flows within targets, and the temporal profile of temperature. By embedding two tracers in two different regions, respectively on the surface of the target and inside it, the different physical processes in different ablation phases are experimentally distinguished in CH for the first time. These are the initial shock wave compression, followed in turn by electron thermal heating and rapid thermal expansion of the plasma. Compared with the simulation results, we find there are large discrepancies in the experimentally observed motion of the plasma flow in both CH and Au, and we also find that this motion is quite sensitive to the flux-limited thermal transport model. Our approach has a wide scope of application to investigations of the process of thermal conduction and deserves further attention in the context of ICF and HED physics.
II. EXPERIMENTAL DETAILS
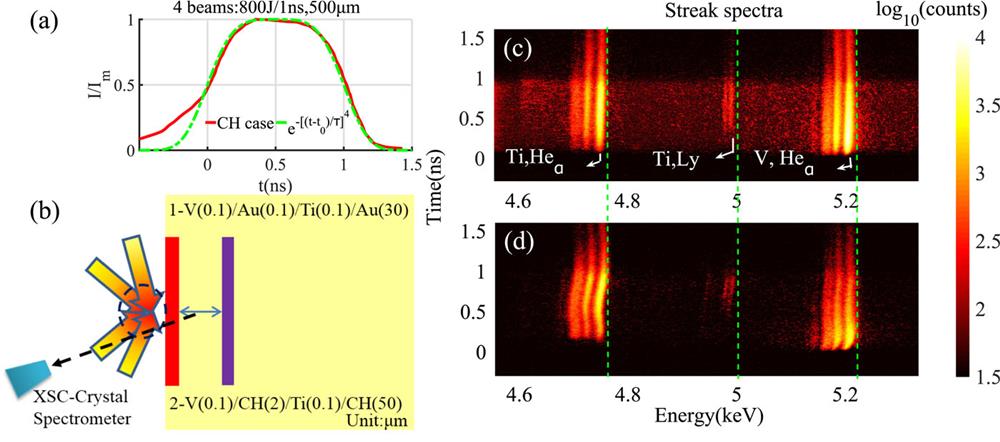
The experiments were performed on the Shen-Guang III prototype high-power laser facility at the Research Center of Laser Fusion of the China Academy of Engineering Physics. Figures 1(a) and 1(b) show the initial experimental setup of lasers, target, and diagnostics. Four frequency-tripled Nd-glass laser beams, each of 800 J energy and 1 ns duration, formed a “super-Gaussian” profile. They were beam-smoothed by continuous-phase plates (CPP) to produce a 500 µm spatially homogeneous focal spot on the target surface. Two of the lasers were incident at angles of ±50° to the normal to the target surface, while the other two were incident at angles of ±75°. Together, they induced a maximum intensity of 7.5 × 10¹⁴ W/cm2. The composite laser profile overlapping with the designed shape is shown in Fig. 1(a). Two types of sandwich target consisting of V(0.1)/Au(0.1)/Ti(0.1)/Au(30) and V(0.1)/CH(2)/Ti(0.1)/CH(50), respectively, were chosen, where the numbers indicate the layer thicknesses in micrometers. The vanadium (V) and titanium (Ti) acted as spectroscopic tracers, with V being placed on the surface and Ti at a certain depth of the ablated sample foils behind 0.1 ± 0.05 µm Au or 2 ± 0.1 µm CH. The substrates behind the Ti were both thick (30 µm Au or 50 µm CH) to keep the rear of the foils stable during the laser ablation [see Fig. 1(b)].
![]()
Figure 1.(a) and (b) Schematic of four flat-top laser beams irradiating a sandwich-like target at angles of ±50° and ±75° to the normal to the target surface. Two targets were used: V(0.1)Au(0.1)Ti(0.1)Au(30) and V(0.1)CH(2)Ti(0.1)CH(50). In (a), the real profile of the CH shot is shown by the full red curve and the designed one by the dashed green curve. As shown in (b), a crystal spectrometer for the region of 4.5–5.4 keV combined with an x-ray streak camera (XSC) was located in the direction of 15° normal to the target surface. (c) and (d) Time-resolved self-emission spectra of the Au and CH targets from the spectrometer. The laser condition was the same for both targets, with each beam having 800 J energy and a 500
A flat crystal with 2d = 0.874 nm coupled with an x-ray streak camera was used to disperse and record the x-ray spectra in a time-resolved manner. The spectrometer covered a spectral range from 4.4 to 5.5 keV and viewed the target at about 15° to the target normal. The spectral and temporal resolution were respectively about E/ΔE > 500 and 2 ps. To ensure comparability of the x-ray spectroscopic emissions from the different tracers, the areal densities of Au and the CH layers between the V and Ti tracers were kept the same, with the Au layer having a thickness of 0.1 µm and a solid density of 19.6 g/cm3 and the CH layer having a thickness of 2 µm and a solid density of 1 g/cm3. An x-ray pinhole camera, with a spatial resolution of about 15 µm, was used to monitor the laser focal spot at about 45° to the target normal.
III. ANALYSIS OF RESULTS
In the following we will discuss the measured ablation velocity and the motion of the plasma flow and its relation to the thermal transport in the ablated materials by comparing the experimental results with those of radiation hydrodynamic simulations.
A. Ablation velocity
Figures 1(c) and 1(d) respectively show the streak spectra from the laser-ablated Au and CH samples. The He-α emission lines of V and the He-α and Ly-α lines of Ti can clearly be seen in the spectra. The temporal intensity profiles of each He-α line from the two cases are separately plotted in Fig. 2. Compared with the V emissions from the target surfaces, the Ti emissions from the dense regions inside the targets show a delay time of Δt = 180 ± 20 ps in both cases. According to the steady-state ablation mechanism expressed as , the mass-ablation rate for planar targets is estimated as (1–1.25) × 104 kg m−2 ns−1, where ρ0, Δd, and Δt are the solid density of the ablator, the burn-through depth, and the burning time, respectively. Since both the Au and CH layers between the two tracer layers are optically thin, their mass-ablation rates are almost the same. Thus, it is appropriate to compare the subsequent thermal conduction process for the two materials in similar mass-ablation regions (similar areal densities). Accordingly, the ablation velocity was about (1–1.25) × 104 µm/ns for CH and (5–6.25) × 102 µm/ns for Au. Such a mass-ablation rate responds to an averaged laser intensity of (3–6) × 1014 W/cm2, which is smaller than the incident value of 7.5 × 10¹⁴ W/cm2. Actually, the lower inferred intensity is much closer to the internal energy of the plasmas absorbed from the laser beams than to the incident one. Therefore, effects such as those of transverse electron thermal conduction, laser scattering, and radiation cooling of materials can influence the deposition of energy from laser to plasma in the ablation region.
![]()
Figure 2.Distribution of He-like spectral intensities for V and Ti in the case of (a) CH and (b) Au. Materials with similar areal densities (Au with 19.6 g/cm3 × 0.1
To further understand the energy loss from laser to plasma, let us focus on the emissions of V in Fig. 2. The gradients of the V and Ti emission intensities are initially almost the same, which is consistent with the similar mass-ablation rates in the two cases, but their temporal profiles become different from time t = 0.2 ns onward. First, the V line drops earlier and more rapidly in the CH case than in the Au case, as can be seen by comparing the blue solid line to the red dashed one in Fig. 2 (the dashed arrows mark the maxima). As we know, the low-Z material CH expands more rapidly than the high-Z Au during laser heating. Thus, the earlier and more rapid decrease of emissions from the surface layer can be explained by the more rapid expansion of the heated CH causing the V material in the coronal region to expand out from the laser channels more rapidly. This phenomenon is also related to two-dimensional transverse effects, which also provide one interpretation of the lower ablation intensity [(3–6) × 1014 W/cm2]. After the coronal plasmas have expanded out from the laser channels, the energy loss by thermal radiation will overwhelm the energy transfer by electrons, and subsequently these plasmas (V) will cool down rapidly. This is why, even though the drive lasers last about 1 ns, the V emissions decrease so early. The ∼×1.8 higher emission intensity of V in the case of Au can be explained by stronger radiation cooling despite a weaker plasma expansion compared with the case of CH. It further indicates that the blue-integrated influence of the laser absorption in regions with the same areal density of Ti is similar in the two cases. Besides, the Ti lines also show a larger gradient in the period of increase for CH from t = 0.4 ns onward. In addition to the difference in temporal emission profiles, obvious spectral shifts of the V and Ti emissions can be observed in the case of CH case on comparing the self-emissions with the green dashed reference lines (4750 eV for Ti He-α) in Figs. 1(c) and 1(d). Here, we attribute the spectral shifts to Doppler effects caused by the motion of the plasma flow, and this will be discussed in detail in Sec. III B.
In short, the similar mass-ablation rates make the heating processes comparable in the optically thin regions of the two materials, but all of the discrepancies described above indicate that different dynamics are involved during the thermal transport process.
B. Motion of plasma flow
We now focus on the difference in Ti plasma emissions. Figure 3 shows the emission lines of Ti at t = 0.3, 0.5, and 1 ns. It can clearly be seen that there is an obvious red shift of the He line at t = 0.5 ns but a blue shift at t = 1 ns when compared with that at t = 0.3 ns. Here, the spectrum at t = 0.3 ns is a reference close to the unshifted state. In principle, there are three reasons for spectral shifts: (1) ionic potential depression (IPD) caused by variations in plasma states, (2) variations in the positions of the spectral images caused by motion of the light source, and (3) the Doppler shift caused by plasma motion. IPD is generally described using the Stewart and Pyatt model49,50 and its main effect is to lower the energy of emission lines when the plasma is very dense. Since the ion density of Ti can only remain dense during a very short period as the shock wave arrives, the IPD effects is too small to be observed in the cases we consider here. Anyway, because the trend of variation of Ti density changes rapidly from an increasing to a decreasing one owing to plasma expansion, even when the IPD effect is present, it is responsible for only a small part of the red shift (and none of the blue shift) here. Thus, the other two causes of spectral shifts, namely those related to plasma motion, are dominant.
![]()
Figure 3.Emission lines of Ti at 0.3, 0.5, and 1 ns in the case of CH. From a comparison of the results at
Figure 4(a) plots the experimental results for the Doppler shift δhv from the Ti He-α line shown in Fig. 1(d). First, taking account of the design of our crystal spectrometry, the shift in the image spectrum induced by the motion of Ti ions can be expressed as
![]()
Figure 4.Motion of the Ti plasma flow determined from (a)–(c) experiment and (d)–(f) hydrodynamic simulations for the case of CH. (a) Doppler shift
To explain the plasma motion, one-dimensional (1D) radiative hydrodynamic simulations have been carried out using the Multi1D code with a flux-limited Spitzer–Härm thermal transport model.51 As discussed in Sec. III A, since 2D effects such as laser scattering, transverse electron thermal conductivity, and plasma expansion in the corona can hardly be considered in our 1D simulations, to allow comparison of the 1D results with the experimental results, a laser intensity of 4 × 10¹⁴ W/cm2 is chosen here based on the ablation intensity. Other parameters are the same as those in the experiments, and the V is initially located at x = 0.
Since the trajectory of Ti tracer from the simulation results matches the experiments best when f is chosen as 0.08 (see Fig. 7), we take f = 0.08 as an example to analyze the ablation process in detail. Figure 4(d) shows the temporal and spatial evolutions of the electron number density for the case f = 0.08. The pink line dots indicate the critical density layer in the ablated sample (ncr = 8.9 × 1021 cm−3 for λ = 351 nm) and the black line indicates the center trajectory of the Ti layer. Three typical physical processes can be distinguished in a step-by-step manner. First, when the laser light begins to heat the V layer, a shock wave is formed and propagates forward. Subsequently, when the shock wave hits the inside layer of Ti, it compresses the Ti tracer forward and accelerates it to a maximum velocity of about 52 µm/ns, which is a little lower than the 68 µm/ns observed in Fig. 4(b). The passage of the shock wave through the Ti layer heats this layer. A rarefaction wave is then induced, causing the flow to slow down, and after which it expands rapidly, together with the CH plasma, into the vacuum. Figures 4(e) and 4(f) respectively present the simulated speed and trajectory of the Ti layer. As can be seen from Fig. 4(e), there is a rapid acceleration at about t = 0.4 ns, caused by the shock wave, and this is followed by a deceleration. From the trajectory in Fig. 4(f), it can be seen there is initially forward motion for about Δt = 0.22 ns, after which there is a backward spread. The acceleration period of 0.22 ns is close to the 0.25 ns seen in Fig. 4(c). Thus, Fig. 4 verifies that there is a rapid motion of the plasma flow in the case of CH, and it can also be seen that the results from the experiments and simulations agree well with regard to the different acceleration and deceleration processes caused by the shock and expansion of the plasmas.
Furthermore, as shown in Fig. 1(c), the Doppler shift of the spectrum is too weak to be observed in the case of Au under the same laser conditions. Meanwhile, owing to limitations imposed by the technique of target fabrication, the uncertainty in the Au thickness (d = 0.1 ± 0.05 µm) between the V and Ti layers is much larger than that in the case of CH (d = 2 ± 0.1 µm). Taking the uncertainty in the Au thickness into account, the evolution of the density in the case of Au with d = 0.1 µm and f = 0.08 is shown in Fig. 5, together with the trajectory of the center of the Ti layer, for three cases, namely, d = 2 µm CH, d = 0.1 µm Au, and d = 0.15 µm Au. Also consistent with the experimental result, the trajectories of Ti (blue dashed and dotted lines) for the Au case show almost no acceleration as the shock wave passes through and there is much weaker expansion compared with the case of CH (black solid line).
![]()
Figure 5.Electron density
Thus, it can be seen that the velocity and trajectory distributions of the Ti plasma have been successfully determined in our experiments, and their evolution matches that predicted by the simulations.
C. Relation between the motion of the plasma flow and thermal transport
Much previous work on heat transport has been based on the flux-limited SH model q = min{qSH, fqf}, where q/(fqf) = min{qSH/(fqf), 1}. This approach is therefore appropriate when q/fqf > 1, but is invalid when q/fqf < 1. Figure 6 shows the q/fqf distribution together with the trajectories of the critical density layer (green dashed line) and the Ti layer (black dashed line) for f = 0.08. Colors from white to red in this figure correspond to regions where the condition q/fqf > 1 holds. It can be clearly seen that these regions are mainly concentrate near the two dashed lines (the ncr and Ti layers), providing further evidence that the trajectory of Ti is sensitive to the heat transport process.
![]()
Figure 6.Evolution of the relative heat flux
Simulations with different flux limiters f = 0.1, 0.08, 0.06, and 0.04 have also been carried out, and the speeds and trajectories of the Ti layer are shown in Fig. 7. It can be seen that discrepancies in the speed in Fig. 7(a) occur mainly in the deceleration phase from t = 0.4 to 0.8 ns. It is understandable that since the flux limiter f acts close to the Ti layer, it will mainly tune the thermal pressure in this region. The thermal pressure will prevent the expansion of Ti layer in the period after the shock has passed through it but before the rarefaction wave has formed. With decreasing f, the heat flux becomes more localized in the Ti layer. Thus, there is a deceleration in the speeds of the Ti plasmas when f is reduced. Consistent with this, the maximum distance of penetration into the target (in the +x direction) is greatest for f = 0.04 in Fig. 7. In addition, the simulated results with f = 0.06 and 0.08 show the best agreement with the experimental data. However, there are still some differences, especially during the deceleration phase. Actually, since no matter whether q/fqf or the motion of the plasma flow vary with time (see Figs. 6 and 7), f will be time-dependent, and it can be seen that it is difficult to choose a value of f that exactly reproduces the whole process of evolution.
![]()
Figure 7.Profiles of (a) speed
In brief, however, despite this difficulty in choose a single value of the factor f to describe the whole evolution of the motion of the plasma flow, our experimental and simulation results confirm that the plasma motion caused by shock compression and heat wave propagation is sensitive to the thermal transport model that is adopted. A characterization of the motion of the plasma flow obtained from measurements of the spectral shifts of tracers can then provide an efficient experimental method for checking thermal transport models.
IV. DISCUSSION
All of the above results confirm that although the mass-ablation rates for Au and CH are similar, the ablation processes are quite different. For the low-Z material CH, the motion of the plasma flow must be taken into account throughout the ablation process because of its effects on the relationship between the laser-induced shock wave and the plasma expansion, which is not the case with the high-Z material Au. The heating process is also heavily influenced by the motion of the plasma flow in the case of CH, leading to a large discrepancy between the results for CH and Au (Fig. 2).
A. Influence on temperature profiles
It is known that the motion of the plasma flow is sensitive to the thermal transport model used, and the results for Au and CH differ, even under the same laser conditions. As the evolution of the in situ plasma temperature is widely used to characterize thermal transport, let us now discuss the influence of plasma motion on temperature variations.
To obtain Te, the collisional–radiative model code Rateq was used to calculate the theoretical spectrum of Ti emissions under different plasma conditions, with the population distribution of the atomic levels being obtained by solving the rate equations for these levels through the FAC code. The ratio of the Ly-α line and He-α line and the ratios of the He-j, k, l lines and the He-α line are all functions of electron temperature and density, and they are particularly sensitive to temperature variations in the region from 500 to 3000 eV but quite insensitive to electron densities lower than 1022 cm−3. Temperature profiles can then be obtained by comparing the theoretical spectrum with the experimental results from Figs. 1(c) and 1(d). This method has been widely used in other ICF research.45 In our analysis, the residual errors in the isoelectronic emission line rates were controlled to ±1%. The distributions of Te(t) obtained in this way are shown in Fig. 8(a), where the error bars represent the combined uncertainties of 15% from the temperature variations due to density variations in both space and time (∼10%) together with the measurement errors (∼10%).
![]()
Figure 8.(a) Temperature profiles of the Ti layer in both cases of Au and CH. These were calculated by comparing the ratios of the Ly-
As shown in Fig. 8(a), the temperature gradients before Te reaches its maximum are quite different in the two cases. The variation of Te in the case of Au can be simply divided into two phases: in the first phase, it increases rapidly, corresponding to heat wave front heating; in the second phase, it continues to increase, but only slowly, reaches a maximum of about 2000 eV (blue line). However, Te in the case of CH exhibits a much larger gradient before reaching its maximum (red line). Actually, as discussed in Sec. III B, the CH plasma moves and expands more quickly, and so its local density gradually becomes subcritical. As a result, the variation of Te in this phase is influenced not only by electron thermal transport, but also by laser heating. Thus, the larger gradient for CH can be attributed to the rapid motion and rarefaction of the Ti plasma.
Since Ly-α emission during t < 0.5 ns is very weak, it is difficult to accurately determine Te in this period. However, if we focus on the He-α lines in Fig. 2, their variation with time also reveals the different dynamic processes of heating, i.e., there is similar preheating as the shock wave passes during the first phase but differences during the thermal-wave heating in the second phase. Besides, the maximum Te characterized by the emission lines is also consistent with the value estimated from the speed of plasma expansion. In principle, the motion of Ti after laser ablation has ended is dominated by adiabatic expansion, and the expansion speed is close to the acoustic speed, since , where Z, Te, Ti, and mi are the charge number, electron and ion temperatures, and ion mass. Therefore, the estimated temperature based on the speed of about 400 µm/ns in Fig. 4(b) is about 2000 eV.
Te profiles from simulations with f = 0.1, 0.08, and 0.06 are compared with the experimental result in Fig. 8(b). In contrast to the law in Fig. 8, the maximum value of Te for f = 0.1 matches the experimental result much better than that for f = 0.08, but it can be seen from the temporal profile that it is difficult to describe the whole evolution with a constant value of f.
B. Plasma flow movements in Au
To further discuss the influence of the motion of the plasma flow in Au, two experiments under different laser conditions were performed, one using a 500 µm continuous-phase plate (CPP)-smoothed focal spot and the other using 200 µm tightly focused laser beams providing a threefold-higher laser intensity. The sandwich targets were both Ti(0.1)/Au(0.1)/Ti(0.1)/Au(30). Figure 9 shows the spectrum of Ti. The spectral shifts corresponding to the motion of the Au flow can clearly be seen in Fig. 9(b). The forward acceleration of the plasma flow caused by the pressure of the shock wave and the subsequent deceleration due to expansion cannot be ignored in laser ablation of Au, but it is also necessary to take account of the laser conditions (especially intensities). In the present study, when the laser intensity reaches ∼1014 W/cm2, the motion of the CH plasma flow becomes significant, but this is not yet the case for the Au plasma. However, at intensities greater than 1015 W/cm2, the influence of the motion of the Au plasma flow can no longer be ignored. Additionally, although the laser intensity is higher in Fig. 9(b), the Ly-α emission is weaker, revealing a lower maximum temperature. This is a further indication that the plasma motion is sensitive to heat transport (Te variation). It is worth noting that some instabilities, such as Rayleigh–Taylor instabilities induced at the interfaces of the sandwich target and laser–plasma instabilities such as stimulated Raman scattering (SRS) in the large coronal region cannot be ignored at laser intensities I > 1015 W/cm2 when we use the plasma motion to study thermal transport. Of course, the dependence on depth within the target may also be a factor, since this affects the ablation rate and temperature gradient.
![]()
Figure 9.Time-resolved spectrum for (a) 500
V. CONCLUSION
We have proposed a practical experimental method to investigate thermal transport by characterizing the motion of the plasma flow. Through the use of tracer spectroscopic diagnostics of x-ray self-emission, the temporal evolution of multiple parameters, including the time-resolved velocity, trajectories of motion of plasma flows, and temperature profiles in Au and CH during the laser-ablation process, have been simultaneously obtained. Using this novel approach, we have observed for the first time the formation and propagation of shock waves, heating by thermal conduction, and the plasma expansion in the dense regions of CH. Our results show that for laser intensities of the order of 1014 W/cm2, the velocities of motion of plasma flows cannot be ignored, owing to their significant effects on temperature profiles. Although, under the same laser conditions, the effects on Au are not obvious, these do become important when the laser intensity exceeds 1015 W/cm2. Although we have found that it is difficult to accurately describe the whole temporal evolution of both the motion of the plasma flow and the temperature using a constant value of f in the flux-limited Spitzer–Härm model, our simulations still reveal that determining the motion of the plasma flow via the spectral shifts of tracers can be an efficient way to check thermal transport models. More attention should be given to this approach in the context of ICF and HED physics.
ACKNOWLEDGMENTS
Acknowledgment. The authors would like to thank the target fabrication and laser operation staff for their cooperation. This work is supported by the National Key R&D Program of China under Grant No. 2017YFA0403200, the National Nature Science Foundation (NSFC) of China under Grant Nos. 12005206, 11734013, 11774321, and 12004351, the Science Challenge Project under Grant Nos. TZ2018001 and TZ2018005, the CAEP foundation under Grant Nos. YZJLX2017010 and 2018011, and the foundation for Development of Science and Technology of the China Academy of Engineering Physics under Grant No. CX2019023.
References
[1] G.Ren, S.Li, W. Y.Huo. Laser ablation under different electron heat conduction models in inertial confinement fusion. High Energy Density Phys., 27, 12-17(2018).
[2] J. A.Tarvin, D. C.Slater, W. B.Fechner, P. D.Rockett, J. T.Larsen. Mass-ablation rates in a spherical laser-produced plasma. Phys. Rev. Lett., 51, 1355-1358(1983).
[3] B. L.Henke, M. C.Richardson, J.Delettrez, P. A.Jaanimagi. Temporal dependence of the mass-ablation rate in uv-laser-irradiated spherical targets. Phys. Rev. A, 34, 1322-1327(1986).
[4] R. E.Olson, R. J.Leeper, O. L.Landen, G. A.Rochau. X-ray ablation rates in inertial confinement fusion capsule materials. Phys. Plasmas, 18, 032706(2011).
[5] X. T.He. The updated advancements of inertial confinement fusion program in China. J. Phys.: Conf. Ser., 688, 012029(2016).
[6] S. F. B.Morse, T. J.Kessler, M.Wittman, J. A.Delettrez, R. S.Craxton, R.Short, M. J.Shoup, W. R.Donaldson, S. D.Jacobs, J. M.Soures, B.Yaakobi, P. A.Jaanimagi, R.Boni, S. J.Loucks, D. L.Brown, R. L.Keck, T. R.Boehly, P. W.McKenty, J. H.Kelly, K.Kearney, C. P.Verdon, S. A.Kumpan, S. A.Letzring, A.Babushkin, R. L.McCrory, W.Seka, D. D.Meyerhofer, R. L.Kremens, A. W.Schmid, S.Papernov, D. J.Smith, R.Epstein, D. K.Bradley, A.Okishev, S.Skupsky, R. E.Bahr, F. J.Marshall, M.Skeldon, G.Pien, J. P.Knauer, S.Swales, L. D.Lund, D. J.Lonobile. Direct-drive laser-fusion experiments with the OMEGA, 60-beam, >40 kJ, ultraviolet laser system. Phys. Plasmas, 3, 2108-2112(1996).
[7] R. L.Berger, S. G.Glendinning, O. L.Landen, R. L.Kauffman, S. H.Glenzer, J. D.Lindl, S. W.Haan, L. J.Suter, P.Amendt. The physics basis for ignition using indirect-drive targets on the National Ignition Facility. Phys. Plasmas, 11, 339-491(2004).
[8] L. B.Hopkins, C. J.Cerjan, C. R.Brune, H. G.Rinderknecht, M.Couder, N.Izumi, J.Frenje, L.Bernstein, C.Hagmann, D. L.Bleuel, W.Stoeffl, B.Spears, F.Merrill, D. H.Kalantar, E. A.Henry, R.Hatarik, R. M.Bionta, A.Hamza, C.Velsko, R.Tommasini, A.Ratkiewicz, H. Y.Khater, J. A.Caggiano, D.Sayre, A.Zylstra, K.Moody, G.Grim, W. S.Cassata, M.Wiescher, C.Yeamans, D.Schneider, A.Kritcher, E. P.Hartouni, P.Neumayer, M.Gatu-Johnson, H.Herrmann, Y.Kim, N.Gharibyan, D.Fittinghoff, D.Shaughnessy, Y. A.Litvinov. Dynamic high energy density plasma environments at the National Ignition Facility for nuclear science research. J. Phys. G: Nucl. Part. Phys., 45, 033003(2018).
[9] D. K.Ilnitsky, S. I.Ashitkov, P. S.Komarov, A. A.Yurkevich, N. A.Inogamov, V. V.Zhakhovsky, M. B.Agranat, Y. V.Petrov, V. A.Khokhlov. Ablation of gold irradiated by femtosecond laser pulse: Experiment and modeling. J. Phys.: Conf. Ser., 774, 012097(2016).
[10] L.Zhang, S.Jiang, J.Zheng, H.Li, F.Wang, L.Kuang. Mitigating wall plasma expansion and enhancing x-ray emission by using multilayer gold films as hohlraum material. Nucl. Fusion, 61, 086004(2021).
[11] O.Larroche, J. P.Matte, M.Casanova, F.Vidal. Modeling and effects of nonlocal electron heat flow in planar shock waves. Phys. Plasmas, 2, 1412-1420(1995).
[12] X.Zeng, S.-B.Wen, X.Mao, R.Greif, R. E.Russo. Energy deposition and shock wave propagation during pulsed laser ablation in fused silica cavities. J. Phys. D: Appl. Phys., 37, 1132-1136(2004).
[13] S. P.Obenschain, J.Weaver, V.Serlin, Y.Aglitskiy, M.Karasik, J. H.Gardner, N.Metzler, A. L.Velikovich, S. T.Zalesak, A. J.Schmitt. Classical and ablative Richtmyer–Meshkov instability and other ICF-relevant plasma flows diagnosed with monochromatic x-ray imaging. Phys. Scr., 2008, 014021.
[14] S. C.Wilks, V. Y.Glebov, H. G.Rinderknecht, M. J.Rosenberg, A. B.Zylstra, F. H.Séguin, D.Svyatsky, M.Gatu Johnson, T. C.Sangster, J. A.Frenje, G.Kagan, C. K.Li, H.Sio, N. M.Hoffman, P. A.Amendt, C.Stoeckl, R. D.Petrasso. Ion kinetic dynamics in strongly-shocked plasmas relevant to ICF. Nucl. Fusion, 57, 066014(2017).
[15] G.Kagan, E.Vold, A. N.Simakov, K.Molvig, L.Yin. Self-similar solutions for multi-species plasma mixing by gradient driven transport. Plasma Phys. Controlled Fusion, 60, 054010(2018).
[16] P. A.Pinto, A.Gouveia, D. M.Chambers, E.Wolfrum, S. H.Glenzer, P.Soundhauss, R. S.Marjoribanks, S.Topping, J. S.Wark, O.Renner, P. E.Young, J.Hawreliak, R. J.Kingham. Thomson scattering measurements of heat flow in a laser-produced plasma. J. Phys. B: At., Mol. Opt. Phys., 37, 1541-1551(2004).
[17] A.Roettgen, I.Shkurenkov, M.Simeni Simeni, W. R.Lempert, V.Petrishchev, I. V.Adamovich. Time-resolved electron density and electron temperature measurements in nanosecond pulse discharges in helium. Plasma Sources Sci. Technol., 25, 055009(2016).
[18] M.?míd, H. M.Johns, C. J.Fontes, C. W.Greeff, K.Falk, C. L.Fryer, M.Holec, D. W.Schmidt, D. S.Montgomery. Measurement of preheat due to nonlocal electron transport in warm dense matter. Phys. Rev. Lett., 120, 025002(2018).
[19] D.Colombant, A.Schmitt, W.Manheimer. Analytic insights into nonlocal energy transport. I. Krook models. Phys. Plasmas, 25, 082711(2018).
[20] J. L.Peacher, K. M.Watson. Doppler shift in frequency in the transport of electromagnetic waves through an underdense plasma. J. Math. Phys., 11, 1496-1504(1970).
[21] D. P.Turnbull, D. A.Liedahl, O. S.Jones, H. A.Scott, M. D.Rosen, C. A.Thomas, W. A.Farmer, S. B.Hansen, J. D.Salmonson, A. S.Moore, L. J.Suter, D. J.Strozzi, C. W.Mauche, M. A.Barrios. Progress towards a more predictive model for hohlraum radiation drive and symmetry. Phys. Plasmas, 24, 056312(2017).
[22] J. L.Kline, J. D.Hager. Aluminum X-ray mass-ablation rate measurements. Matter Radiat. Extremes, 2, 16-21(2017).
[23] C.Mileham, C. R.Stillman, S. T.Ivancic, D. H.Froula, I. A.Begishev, P. M.Nilson, A. B.Sefkow. Energy transfer dynamics in strongly inhomogeneous hot-dense-matter systems. Phys. Rev. E, 97, 063208(2018).
[24] E. G.Hill, S. J.Rose, G.Pérez-Callejo. ALICE: A non-LTE plasma atomic physics, kinetics and lineshape package. High Energy Density Phys., 26, 56-67(2018).
[25] A.Sasaki, K.Shigemori, Y.Izawa, S.Fujioka, H.Nishimura, T.Ando, N.Ueda, Y.Shimada, K.Nagai, K.Nishihara, K.Mima, M.Nakai, K.Hashimoto, A.Sunahara, Y.Tao, N.Miyanaga, T.Okuno, T.Nishikawa, M.Yamaura, T.Norimatsu. Opacity effect on extreme ultraviolet radiation from laser-produced tin plasmas. Phys. Rev. Lett., 95, 235004(2005).
[26] Z.Zhang, G.Gogos. Theory of shock wave propagation during laser ablation. Phys. Rev. B, 69, 235403(2004).
[27] V. N.Goncharov, S. P.Regan, P. B.Radha, D.Shvarts, R. C.Mancini, R.Epstein, H.Sawada, J. P.Knauer, V. A.Smalyuk, W.Seka, D.Li, J. A.Marozas, O. V.Gotchev, B.Yaakobi, I. V.Igumenshchev, R. L.McCrory, P. W.McKenty, D. D.Meyerhofer, T. R.Boehly, J. A.Delettrez, T. C.Sangster, S.Skupsky, F. J.Marshall. Laser absorption, mass ablation rate, and shock heating in direct-drive inertial confinement fusion. Phys. Plasmas, 14, 056305(2007).
[28] J.Meyer-ter-Vehn, R. F.Schmalz, R.Ramis. Radiation heat wave as a basic feature in laser-irradiated foils. Phys. Rev. A, 34, 2177-2184(1986).
[29] S.Hulin, C.Fourment, F.Durut, G.Soullié, J.Breil, B.Villette, P. H.Maire, G.Schurtz, V.Tikhonchuk, S.Gary, F.Thais, J. C.Gauthier, P.Nicola?, C.Chenais-Popovics, J. L.Feugeas, C.Reverdin, O.Peyrusse. Revisiting nonlocal electron-energy transport in inertial-fusion conditions. Phys. Rev. Lett., 98, 095002(2007).
[30] C. P.Ridgers, R. J.Kingham, A. G.Thomas. Magnetic cavitation and the reemergence of nonlocal transport in laser plasmas. Phys. Rev. Lett., 100, 075003(2008).
[31] D. R.Gray, J. D.Kilkenny. The measurement of ion acoustic turbulence and reduced thermal conductivity caused by a large temperature gradient in a laser heated plasma. Phys. Plasmas, 22, 81-111(1980).
[32] T. J. M.Boyd, H. C.Barr. Ion turbulence and thermal transport in laser-produced plasmas. J. Plasma Phys., 27, 525-542(1982).
[33] B.Zhao, J.Li, J.Zheng, H.Li. Study of flux limiter using Fokker–Planck and fluid simulations of planar laser-driven ablation. Plasma Phys. Controlled Fusion, 52, 085008(2010).
[34] D.Bradley, J. D.Moody, D. A.Callahan, O.Jones, A.Nikroo, J.Jaquez, H.Huang, R. L.Kauffman, S. B.Hansen, S. P.Regan, J.Kroll, M. B.Schneider, D. E.Hinkel, O.Landen, M. A.Barrios, J. S.Ross, G. V.Brown, D. A.Liedahl, K. B.Fournier, A. S.Moore. Electron temperature measurements inside the ablating plasma of gas-filled hohlraums at the National Ignition Facility. Phys. Plasmas, 23, 056307(2016).
[35] K.Widmann, A.Nikroo, J.Kroll, R. L.Kauffman, D. A.Liedahl, J.Jaquez, J. D.Kilkenny, G.Pérez-Callejo, W.Farmer, M. A.Barrios, O. L.Landen, H.Chen, J. D.Moody, D. B.Thorn, M.Sherlock, N. B.Meezan, M. B.Schneider, S. A.Maclaren, O.Jones, L. J.Suter. Developing an experimental basis for understanding transport in NIF hohlraum plasmas. Phys. Rev. Lett., 121, 095002(2018).
[36] G. B.Zimmerman, R. P. J.Town, R. A.London, P. A.Michel, W. L.Kruer, M. D.Rosen, L. J.Suter, D. E.Hinkel, H. A.Scott, J. A.Harte, D. A.Callahan, E. A.Williams, L.Divol. The role of a detailed configuration accounting (DCA) atomic physics package in explaining the energy balance in ignition-scale hohlraums. High Energy Density Phys., 7, 180-190(2011).
[37] E. M.Epperlein. Fokker–Planck modeling of electron transport in laser-produced plasmas. Laser Part. Beams, 12, 257-272(1994).
[38] H.Nagatomo, K.Mima, A.Sunahara, T.Johzaki. Non-local electron transport in laser-produced plasmas. J. Phys. IV, 133, 193-195(2006).
[39] Observation of the non-local electron transport effect by using phase zone plate. J. Phys.: Conf. Ser., 112, 022008(2008).
[40] M.Sherlock, A. G. R.Thomas, R. J.Kingham, C. P.Ridgers, A. R.Bell, A. P. L.Robinson, M.Tzoufras. A review of Vlasov–Fokker–Planck numerical modeling of inertial confinement fusion plasma. J. Comput. Phys., 231, 1051-1079(2012).
[41] E. L.Vold, J.Katz, D. P.Higginson, H. G.Rinderknecht, S. C.Wilks, J. S.Ross, H. S.Park, P. A.Amendt, N. M.Hoffman, D.Haberberger, G.Kagan, D. H.Froula, B. D.Keenan. Highly resolved measurements of a developing strong collisional plasma shock. Phys. Rev. Lett., 120, 095001(2018).
[42] D.Ya-Lin, Z.Bin, Z.Jian. Numerical investigation of non-local electron transport in laser-produced plasmas. Chin. Phys., 16, 3742-3746(2007).
[43] M.Bonitz, T.Ott, Z.Donkó. Effect of correlations on heat transport in a magnetized strongly coupled plasma. Phys. Rev. E, 92, 063105(2015).
[44] T.Lippert, A.Wokaun, D. J.Funk, M.Hauer. Time resolved study of the laser ablation induced shockwave. Thin Solid Films, 453-454, 584-588(2004).
[45] W.Pei, J.Yang, Z.Zheng, Y.Ding, B.Zhang, Y.Xu, J.Zhang, X.Hu, J.Yan, Y.Ding, G.Yang. Two-tracer spectroscopy diagnostics of temperature profile in the conduction layer of a laser-ablated plastic foil. Phys. Plasmas, 17, 113302(2010).
[46] J. D.Colvin, H.Nishimura, K.Koga, K. C.Brown, N.Tanaka, A.Yogo, Z.Zhang, J. F.Davis, K. B.Fournier, H.Matsukuma, G. E.Kemp. The effects of microstructure on propagation of laser-driven radiative heat waves in under-dense high-Z plasma. Phys. Plasmas, 25, 032702(2018).
[47] M.Tanabe et al. Characterization of heat-wave propagation through laser-driven Ti-doped underdense plasma. High Energy Density Phys., 6, 89-94(2010).
[48] M. B.Schneider, L. J.Suter, G. D.Kerbel, M. A.Barrios, R. L.Kauffman, O. S.Jones, A. S.Moore, J. D.Moody, W. A.Farmer, D. A.Liedahl, N.Lemos, O. L.Landen, D. J.Strozzi, D. C.Eder, D. E.Hinkel, J. M.Koning. Heat transport modeling of the dot spectroscopy platform on NIF. Plasma Phys. Controlled Fusion, 60, 044009(2018).
[49] J. C.Stewart, K. D. J. Pyatt. Lowering of ionization potentials in plasmas. Astrophys. J., 144, 1203(1966).
[50] M.Chen, R.Lee, Y.Ralchenko, H.Chung. The how to for FLYCHK(2008).
[51] R.Schmalz, R.Ramis, J.Meyer-Ter-Vehn. Multi—A computer code for one-dimensional multigroup radiation hydrodynamics. Comput. Phys. Commun., 49, 475-505(1988).

Set citation alerts for the article
Please enter your email address
© Copyright 2018-2021 | Chinese Laser Press. All Rights Reserved 沪ICP备15018463号-20