• Advanced Photonics Nexus
  • Vol. 1, Issue 1, 016005 (2022)
Dahai Yang1、2, Jie Lin1、3、*, Chen Chen4, Chang Li1、2, Junbo Hao1、2, Baiying Lv4, Keya Zhou3, Yiqun Wang4, and Peng Jin1、2、*
Author Affiliations
  • 1Ministry of Education, Key Laboratory of Micro-systems and Micro-structures Manufacturing (Harbin Institute of Technology), Harbin, China
  • 2Harbin Institute of Technology, School of Instrumentation Science and Engineering, Harbin, China
  • 3Harbin Institute of Technology, School of Physics, Harbin, China
  • 4Chinese Academy of Sciences, Suzhou Institute of Nano-Tech and Nano-Bionics, Suzhou, China
  • show less
    DOI: 10.1117/1.APN.1.1.016005 Cite this Article Set citation alerts
    Dahai Yang, Jie Lin, Chen Chen, Chang Li, Junbo Hao, Baiying Lv, Keya Zhou, Yiqun Wang, Peng Jin. Multiwavelength high-order optical vortex detection and demultiplexing coding using a metasurface[J]. Advanced Photonics Nexus, 2022, 1(1): 016005 Copy Citation Text show less
    Schematic of mode detection HOOV mode LG4,2 is chosen as an example. (a1) Intensity distribution of HOOV beam of LG4,2. (a2) SSP with F=13.4 mm−2 and θ=0 deg. (a3) Intensity distribution of HOHG HG4,6. (b1) HOOV LG4,2. (b2) SSP with F=13.4 mm−2 and θ=45 deg. (b3) Intensity distribution of HOHG HG4,6 after rotating 45 deg. The subscripts (p,l) and (m,n) are the mode numbers of LGp,l and HGm,n. The subscript (F,θ) indicates the modulation parameters of SSP. The SSP range of the x, y coordinate is (−0.3 mm,0.3 mm) and (−0.3 mm,0.3 mm), respectively.
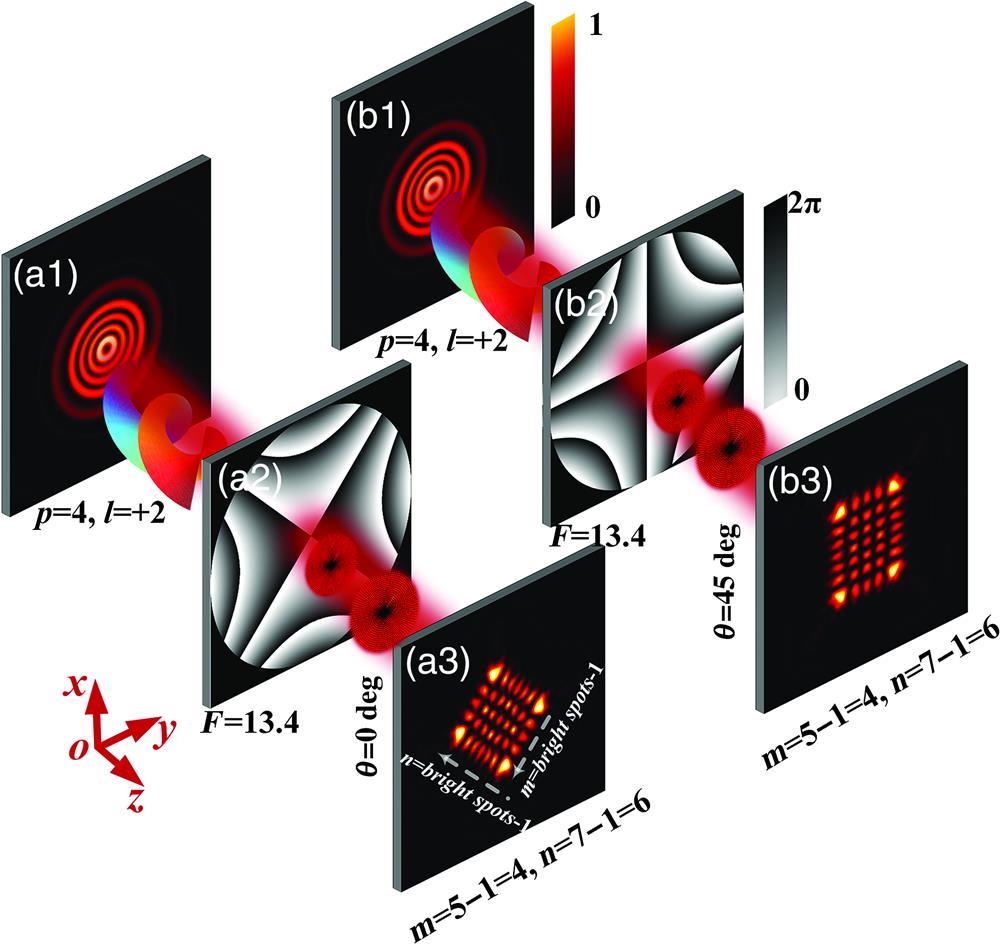
    Fig. 1. Schematic of mode detection HOOV mode LG4,2 is chosen as an example. (a1) Intensity distribution of HOOV beam of LG4,2. (a2) SSP with F=13.4  mm2 and θ=0  deg. (a3) Intensity distribution of HOHG HG4,6. (b1) HOOV LG4,2. (b2) SSP with F=13.4  mm2 and θ=45  deg. (b3) Intensity distribution of HOHG HG4,6 after rotating 45 deg. The subscripts (p,l) and (m,n) are the mode numbers of LGp,l and HGm,n. The subscript (F,θ) indicates the modulation parameters of SSP. The SSP range of the x, y coordinate is (0.3  mm,0.3  mm) and (0.3  mm,0.3  mm), respectively.
    Design and fabrication of geometric metasurface. (a)–(e) Process of the phase superposition. (a) Phase distribution of the incident field LG4,2 corresponds to Fig. 1(a1). Symbol + indicates phase superposition. (b) SSP with F=13.4 mm−2 and θ=0 deg corresponds to Fig. 1(a2). The sign → indicates the result phase superposition. (c) Phase distribution of HG4,6 corresponds to the phase of Fig. 1(a3). (d) Blazed grating phase with the period Λ=0.03 mm. (e) Metasurface phase. (f) Unit cell of TiO2 metasurface and the structural parameters. (f0) 3D view of nanorods. Length L=165 nm, width W=65 nm, height H=500 nm, and period T=200 nm. (f1)−(f4) Top view of the nanorods corresponds to four characteristic phase rotation angles φ=0 (180 deg), 46.8, 83.6, and 105.3 deg. The red plus sign + indicates the center of the structure. (g) Phase value of the four characteristic corners of the nanorods at the corresponding design wavelengths of 405, 532, and 633 nm. Color corresponds to the corresponding wavelength. (h) Metasurface device corresponding to phase diagram (e). Optical microscope image of the metasurface with a radius of 300 μm (Olympus objective, magnification 10×, numerical aperture NA=0.5, scale bar=50 μm). The red dotted frame shows a partially enlarged view of the central phase optical microscope image (Olympus objective, magnification 100×, numerical aperture NA=0.95). Plus sign + indicates the center of the metasurface corresponding to (f) symbol +.
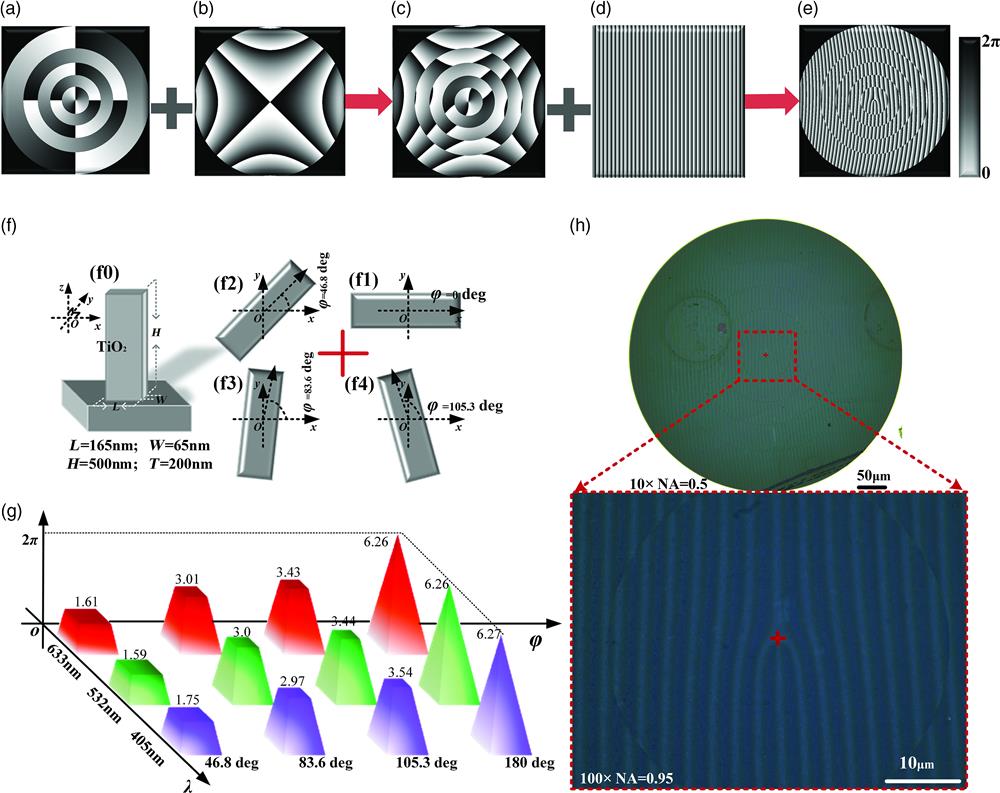
    Fig. 2. Design and fabrication of geometric metasurface. (a)–(e) Process of the phase superposition. (a) Phase distribution of the incident field LG4,2 corresponds to Fig. 1(a1). Symbol + indicates phase superposition. (b) SSP with F=13.4  mm2 and θ=0  deg corresponds to Fig. 1(a2). The sign → indicates the result phase superposition. (c) Phase distribution of HG4,6 corresponds to the phase of Fig. 1(a3). (d) Blazed grating phase with the period Λ=0.03  mm. (e) Metasurface phase. (f) Unit cell of TiO2 metasurface and the structural parameters. (f0) 3D view of nanorods. Length L=165  nm, width W=65  nm, height H=500  nm, and period T=200  nm. (f1)(f4) Top view of the nanorods corresponds to four characteristic phase rotation angles φ=0 (180 deg), 46.8, 83.6, and 105.3 deg. The red plus sign + indicates the center of the structure. (g) Phase value of the four characteristic corners of the nanorods at the corresponding design wavelengths of 405, 532, and 633 nm. Color corresponds to the corresponding wavelength. (h) Metasurface device corresponding to phase diagram (e). Optical microscope image of the metasurface with a radius of 300  μm (Olympus objective, magnification 10×, numerical aperture NA=0.5, scale bar=50  μm). The red dotted frame shows a partially enlarged view of the central phase optical microscope image (Olympus objective, magnification 100×, numerical aperture NA=0.95). Plus sign + indicates the center of the metasurface corresponding to (f) symbol +.
    Experimental results of multiwavelength HOOV detection. (a) Schematic of optical field diffraction of the metasurface. Three wavelengths λ1=405 nm, λ2=532 nm, and λ3=633 nm combined optical incident with left-handed circular polarization. The dotted line corresponds to wavelength color. Three-color sample drawing villains represent the photons of three wavelengths. ϕλi is the diffraction angle at three wavelengths. The target detection field HG4,6 appears at three different diffraction azimuths ϕλ1=19.72 deg, ϕλ2=26.31 deg, and ϕλ3=31.94 deg, which accompany a right-handed circular polarization state. (a1)–(a3) Diffraction field of the target detection field HG4,6 at three wavelengths. (a1) Detection diffraction field at the design wavelength λ1=405 nm. (a2) Diffraction field at λ2=532 nm. (a3) Diffraction field at λ3=633 nm. The Cartesian coordinate system is represented by the black dotted line with a single arrow. The red solid arrow line indicates the z axis direction. The dotted line double arrow indicates the position of the target detection field on the CCD. (b) Simulated polarization transformation efficiency of metasurface in the visible light band (from 400 to 700 nm) and the experimental measured data points at three wavelengths λ1=405 nm, λ2=532 nm, and λ3=633 nm. The black solid line is the calculated data for the entire visible band. The circular data points are the calculated values at three wavelengths. Triangular data points are the experimental data (color corresponds to wavelength). (c) Gray code pattern based on metasurface detection LG4,2 mode with three-wavelength switches. (c1)–(c8) Gray code images 111, 110, 101, 011, 100, 010, 001, and 000 corresponding to binary numbers 5, 4, 6, 2, 7, 3, 1, and 0, respectively. The white number group is the gray code array. Cyan numbers are binary numbers. The colored circular arrow curve indicates the polarization state of the corresponding wavelength.
    Fig. 3. Experimental results of multiwavelength HOOV detection. (a) Schematic of optical field diffraction of the metasurface. Three wavelengths λ1=405  nm, λ2=532  nm, and λ3=633  nm combined optical incident with left-handed circular polarization. The dotted line corresponds to wavelength color. Three-color sample drawing villains represent the photons of three wavelengths. ϕλi is the diffraction angle at three wavelengths. The target detection field HG4,6 appears at three different diffraction azimuths ϕλ1=19.72deg, ϕλ2=26.31deg, and ϕλ3=31.94deg, which accompany a right-handed circular polarization state. (a1)–(a3) Diffraction field of the target detection field HG4,6 at three wavelengths. (a1) Detection diffraction field at the design wavelength λ1=405  nm. (a2) Diffraction field at λ2=532  nm. (a3) Diffraction field at λ3=633  nm. The Cartesian coordinate system is represented by the black dotted line with a single arrow. The red solid arrow line indicates the z axis direction. The dotted line double arrow indicates the position of the target detection field on the CCD. (b) Simulated polarization transformation efficiency of metasurface in the visible light band (from 400 to 700 nm) and the experimental measured data points at three wavelengths λ1=405  nm, λ2=532  nm, and λ3=633  nm. The black solid line is the calculated data for the entire visible band. The circular data points are the calculated values at three wavelengths. Triangular data points are the experimental data (color corresponds to wavelength). (c) Gray code pattern based on metasurface detection LG4,2 mode with three-wavelength switches. (c1)–(c8) Gray code images 111, 110, 101, 011, 100, 010, 001, and 000 corresponding to binary numbers 5, 4, 6, 2, 7, 3, 1, and 0, respectively. The white number group is the gray code array. Cyan numbers are binary numbers. The colored circular arrow curve indicates the polarization state of the corresponding wavelength.
    Schematic diagram of the experimental setup.
    Fig. 4. Schematic diagram of the experimental setup.
    Dahai Yang, Jie Lin, Chen Chen, Chang Li, Junbo Hao, Baiying Lv, Keya Zhou, Yiqun Wang, Peng Jin. Multiwavelength high-order optical vortex detection and demultiplexing coding using a metasurface[J]. Advanced Photonics Nexus, 2022, 1(1): 016005
    Download Citation