Author Affiliations
1Guilin University of Electronic Technology, Photonics Research Center, School of Optoelectronic Engineering, Guilin, China2Guilin University of Electronic Technology, Guangxi Key Laboratory of Optoelectronic Information Processing, Guilin, China3Huazhong University of Science and Technology, Wuhan National Laboratory for Optoelectronics and School of Optical and Electronic Information, Wuhan, China4Optics Valley Laboratory, Wuhan, Chinashow less
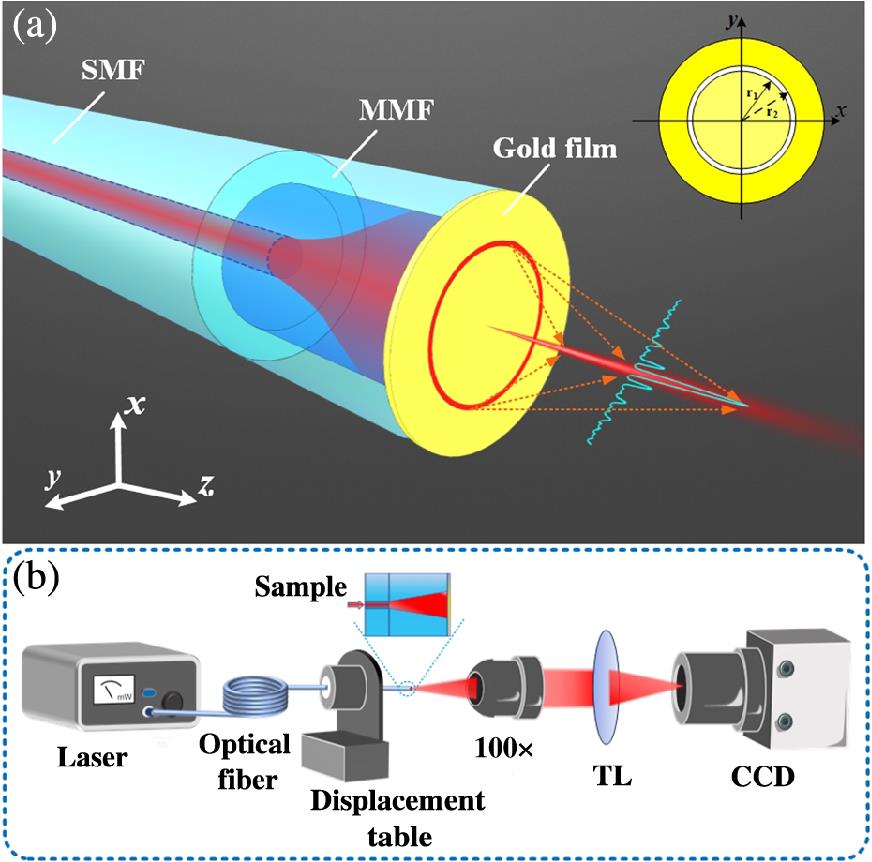
Fig. 1. (a) 3D schematic diagram of the all-fiber far-field IPB generator. SMF is a single-mode fiber and MMF is a graded index multimode fiber. and in the inset are the inner and external radii of the nanoring slot plasma structures, respectively, and the white circular region denotes the area of the gold film that has been etched. (b) Measurement system for observing the far field of the IPB generated by the fiber-integrated plasma structure.
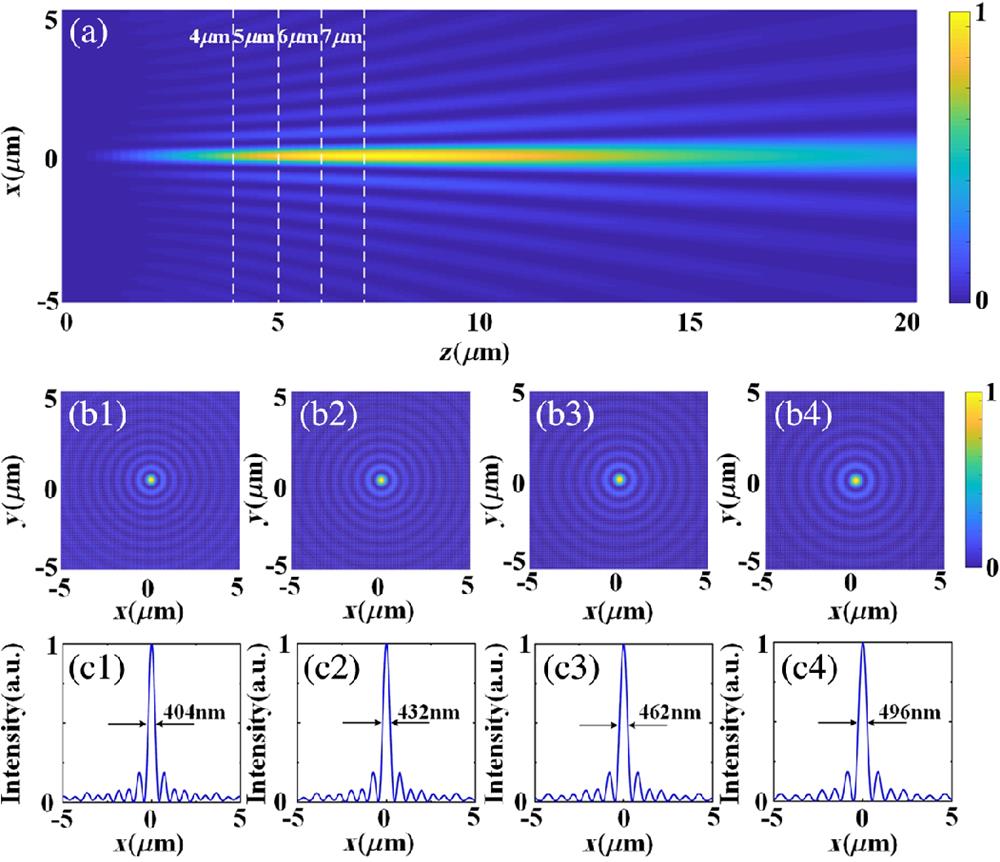
Fig. 2. Normalized intensity distributions of the output optical field simulated via the analytic equation. (a) Normalized intensity distribution in the plane. (b1)–(b4) Normalized intensity distributions on the plane with different transmission distances of 4, 5, 6, and , respectively. (c1)–(c4) Normalized intensity distributions on the axis extracted from the results of (b1)–(b4), respectively.
Fig. 3. Normalized intensity distributions of the optical field of the MMF. (a) Normalized intensity distribution on the plane. (b) Normalized intensity distribution on the plane after being expanded by MMF. (c) Normalized simulation and experimental intensity distributions on the axis after being expanded by MMF.
Fig. 4. Sample characterization. (a) 3D morphology measurement result of the polished fiber end surface. (b) Morphology measurement results along the axis of the polished fiber end surface. (c) SEM images of the fiber end surface and the nanoring slot.
Fig. 5. (a1)–(a4) Observed intensity distributions of the output light on the plane at , 5, 6, and , respectively. (b1)–(b4) Comparison of the simulation and experimental results of the normalized light-intensity distributions along the axis of , 5, 6, and planes. (c) Experimental result of the intensity distribution of the output light on the plane. (d) Variation of the FWHM of the IPB’s main lobe with the propagation distance in different environments. (e) Normalized intensity distributions on the center axis of the IPB in a blood serum environment with different absorption losses.
Fig. 6. (a) Schematic of the nanopetal structure etched on the fiber end surface. (b) SEM image of the nanopetal plasma structure. (c) and (d) Simulation and experimental results of the optical intensity distribution with a propagation distance of , respectively.
Fig. 7. Normalized intensity distributions along the axis of the nanopetal plasma structure with different transmission distances. (a) , (b) , (c) , and (d) , respectively. (e) and (f) Comparison of the sidelobe suppression effect of the nanoring slot and nanopetal plasma structures. The proportional value is defined as the ratio of the maximum light intensity of the first-order sidelobe to that of the main lobe.