Author Affiliations
1Engineering Techniques Training Center, Civil Aviation University of China, Tianjin 300300, China2Sino-European Institute of Aviation Engineering, Civil Aviation University of China, Tianjin 300300, Chinashow less
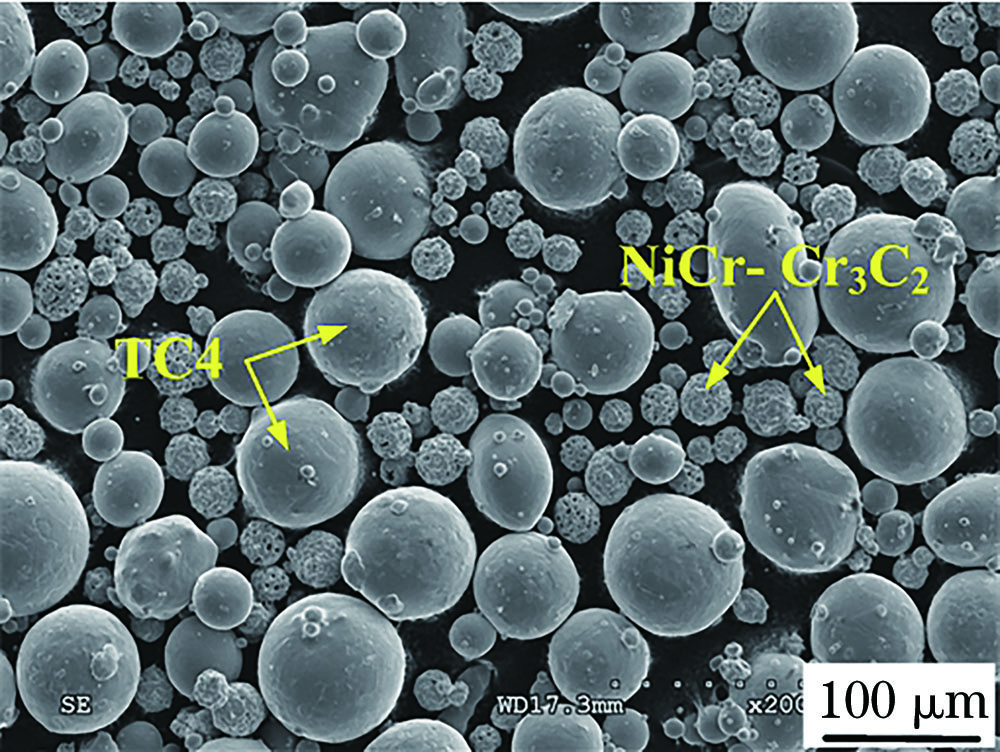
Fig. 1. Micrograph of mixed powders
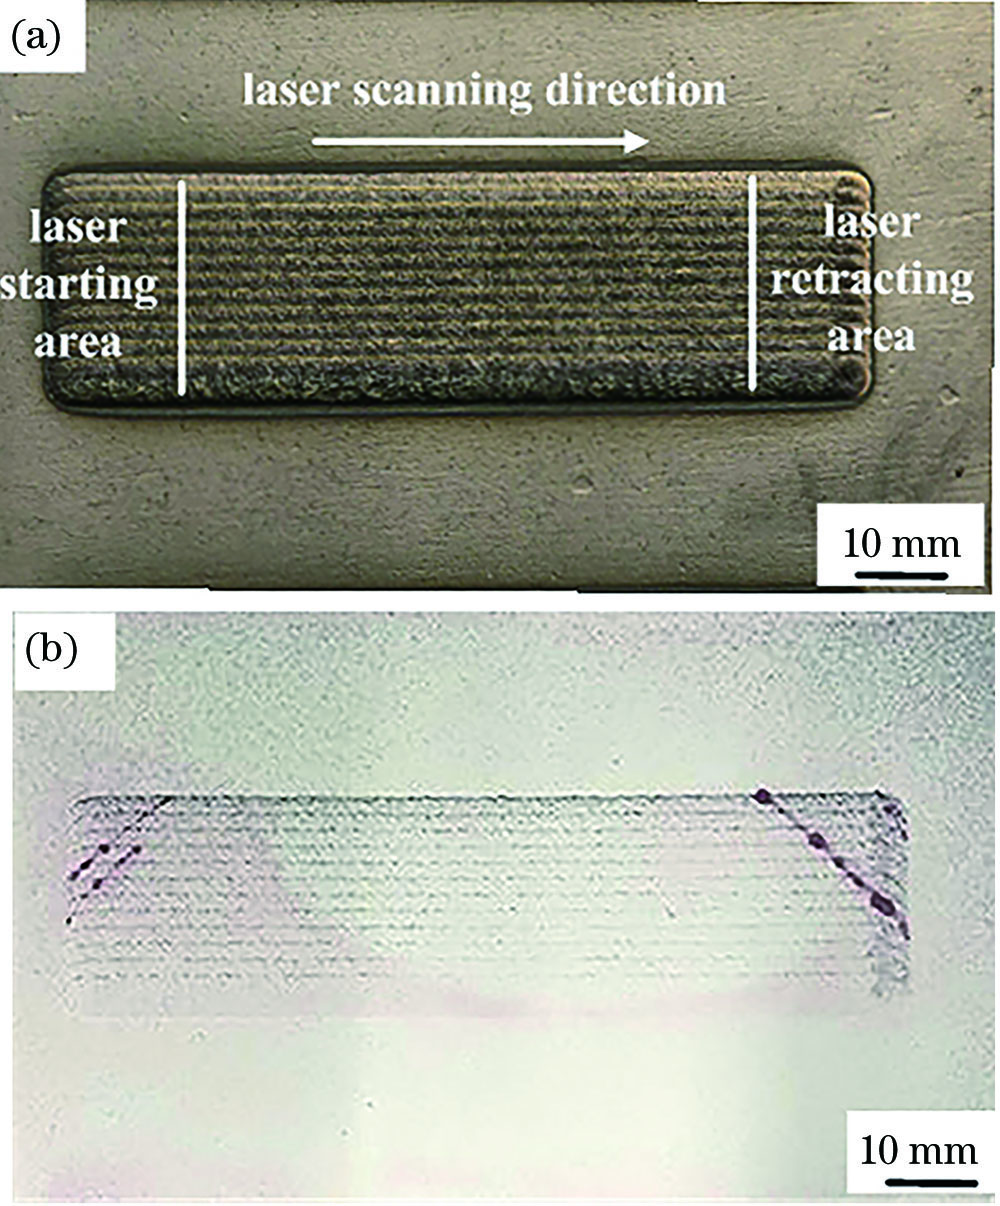
Fig. 2. Surface morphology and penetrant detection of the coating. (a) Surface morphology; (b) penetrant detection
Fig. 3. Cross section SEM of the coating
Fig. 4. XRD analysis results of the coating
Fig. 5. Distribution and morphology of TiC in different positions of the coating.(a)(b)(c) Top region; (d)(e)(f) middle zone; (g)(h)(i) bonding zone
Fig. 6. EDS spectral of each phase in the coating.(a) A1 phase; (b) A2 phase; (c) A3 phase; (d) A4 phase
Fig. 7. EPMA elements distribution of the coating.(a) Ti; (b) C; (c) Al; (d) V; (e) Ni; (f) Cr; (g) BSE; (h) SEM
Fig. 8. Microhardness curve of the coating
Fig. 9. White light interferogram morphology and wear contour curve of the coating wear surface (x, y axis).(a) TC4 substrate; (b) coating
Fig. 10. Morphology of friction and wear. (a) TC4 substrate; (b) coating
Element | Al | V | Fe | N | O | Ti |
---|
Mass fraction | 6.3600 | 4.0600 | 0.0500 | 0.0112 | 0.0770 | Bal. |
|
Table 1. Chemical composition of TC4 alloy unit:%
Element | Ni | C | Cr |
---|
Mass fraction | 18.0-22.0 | 9.2-10.7 | Bal. |
|
Table 2. Chemical composition of NiCr-Cr3C2 powder unit:%
Power /W | Scanning speed /(mm·min-1) | Spot diameter /mm | Feeding rate /(r·min-1) | Focal length / mm | Feeding gas(He) rate /(L·min-1) | Shielding gas(Ar) rate /(L·min-1) | Overlap ratio /% |
---|
1100 | 400 | 3.0 | 1.4 | 16 | 7 | 11 | 50 |
|
Table 3. Process parameters of laser cladding
No. | Test step | Test equipment | Test parameter |
---|
1 | Forming quality | Visual inspectionSurface penetrant inspection | DPT-5 penetrantDPT-5 developer | 2 | Phase composition | D8 ADVANCE X-ray diffraction | ─ | 3 | Microstructure | Hitachi S-3000N SEM | ─ | 4 | Element composition | Oxford INCAPentaFET-X3 energy dispersive spectrometry | ─ | 5 | Region element distribution | JXA-8530F field emission electron probe | ─ | 6 | Microhardness | KB30SR-FA digital microhardness tester | Test load: 500 g; test time: 12 s; test space: 0.2 mm | 7 | Friction and wear | RTEC MFT-5000 tribometer; PTEC UP white-light interferometer | Normal load: 50 N; friction material: WC (diameter is 6 mm); sliding distance: 2 mm; frequency: 15 Hz; test time: 300 s |
|
Table 4. Test methods and equipments of the coating
Ceramic | TiC | Cr7C3 | Cr3C2 |
---|
Melting point temperature | 3345 | 1838 | 2088 |
|
Table 5. Melting point of ceramic phases (TiC, Cr7C3, Cr3C2) unit:K
Phase | Ratio | Ti | C | Al | V | Ni | Cr |
---|
A1(TiC) | Mass fraction | 80.24 | 18.40 | 0.35 | 1.01 | ─ | ─ | Atomic fraction | 50.37 | 48.46 | 0.46 | 0.71 | ─ | ─ | A2(TiC) | Mass fraction | 80.41 | 17.80 | 0.34 | 0.97 | ─ | 0.48 | Atomic fraction | 52.37 | 46.21 | 0.44 | 0.66 | ─ | 0.32 | A3(TiC) | Mass fraction | 78.88 | 18.61 | 0.64 | 1.87 | ─ | ─ | Atomic fraction | 50.46 | 47.46 | 0.86 | 1.22 | ─ | ─ | A4(α-Ti) | Mass fraction | 74.70 | 3.75 | 5.51 | 4.31 | 3.20 | 8.53 | Atomic fraction | 65.54 | 13.13 | 8.59 | 3.56 | 2.29 | 6.89 |
|
Table 6. EDS analysis results of each phase in the coating unit:%
Material | Wear depth /μm | Wear surface /mm2 | Wear volume / (10-3 mm3) | Average friction coefficient |
---|
TC4 substrate | 152.0 | 4.89 | 275.40 | 0.65 | Coating | 131.6 | 4.13 | 200.90 | 0.49 |
|
Table 7. Friction and wear properties parameters of TC4 substrate and the coating