• Journal of Inorganic Materials
  • Vol. 36, Issue 10, 1074 (2021)
Mai YANG1、3, Min ZHU1, Yu CHEN2、*, and Yufang ZHU1、3、*
Author Affiliations
  • 11. School of Materials Science and Engineering, University of Shanghai for Science and Technology, Shanghai 200093, China
  • 22. School of Life Sciences, Shanghai University, Shanghai 200444, China
  • 33. Shanghai Institute of Ceramics, Chinese Academy of Sciences, Shanghai 200050, China
  • show less
    DOI: 10.15541/jim20200751 Cite this Article
    Mai YANG, Min ZHU, Yu CHEN, Yufang ZHU. FePS3 Nanosheets: Preparation and Potential in Photothermal-photodynamic Therapy [J]. Journal of Inorganic Materials, 2021, 36(10): 1074 Copy Citation Text show less
    XRD pattern (a) and SEM image (b) of bulk FePS3
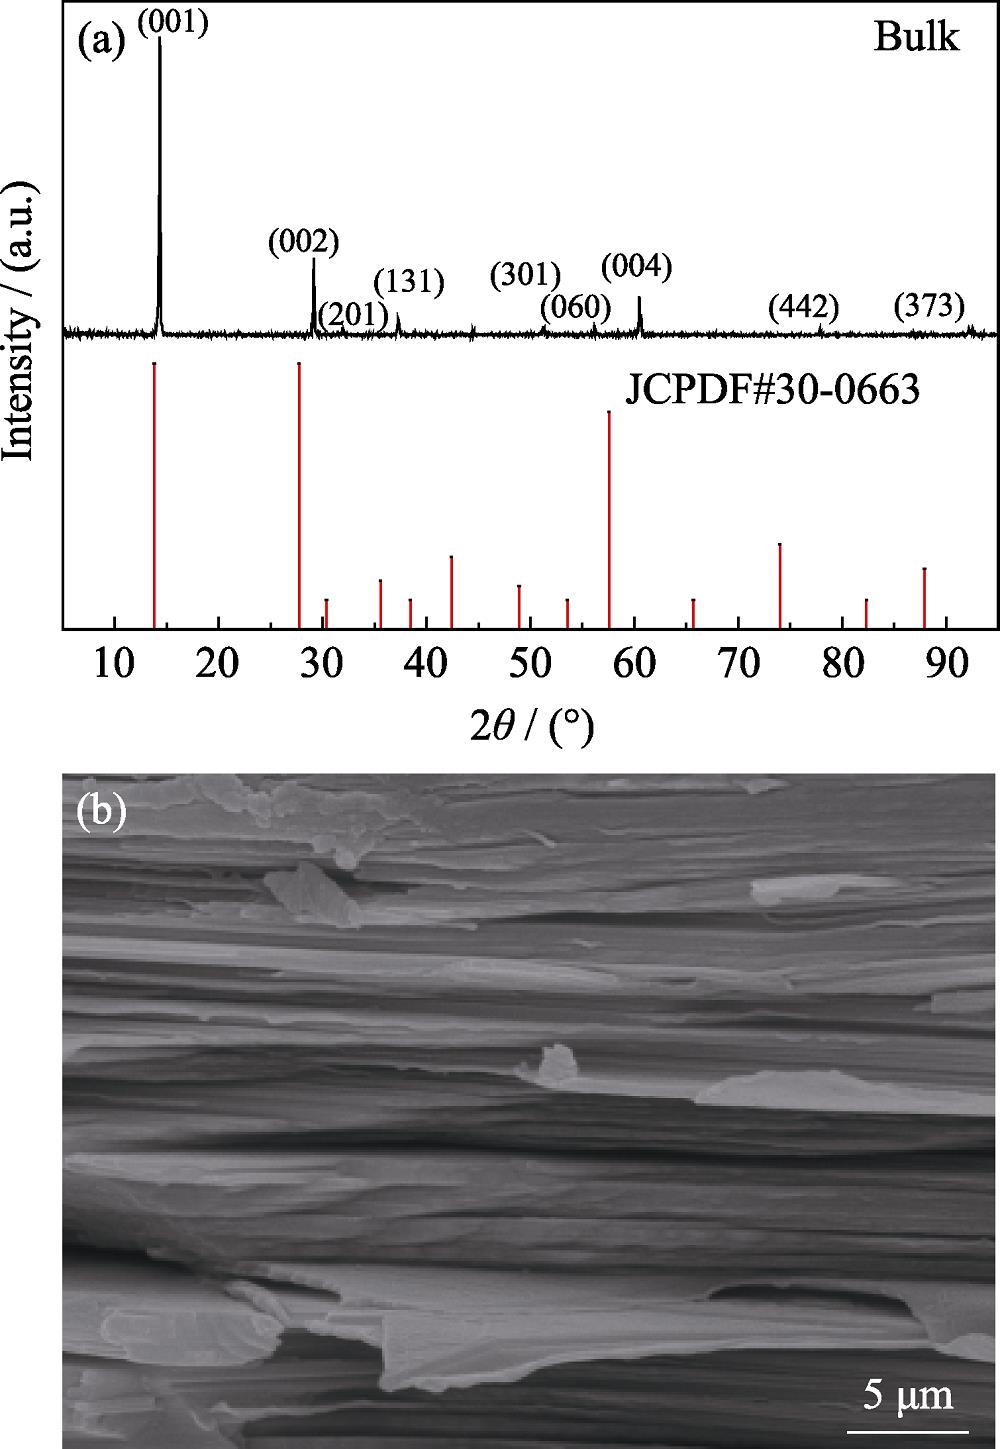
    1. XRD pattern (a) and SEM image (b) of bulk FePS3
    TEM image (a) of FePS3 nanosheets (NSs) and hydrodynamic size of FePS3 nanosheets (NSs) before (b) and after (c) PEGylation with inset showing the picture of FePS3-PEG dispersed in PBS and in DMEM
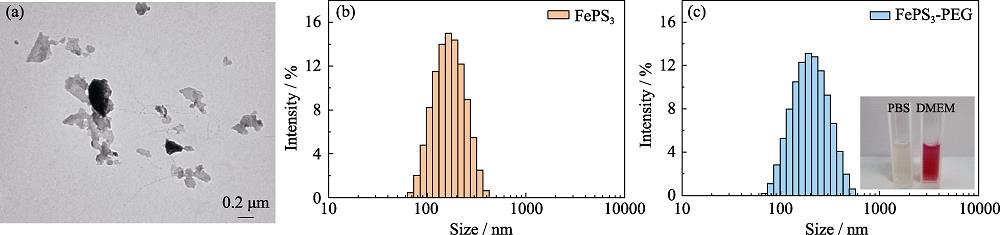
    2. TEM image (a) of FePS3 nanosheets (NSs) and hydrodynamic size of FePS3 nanosheets (NSs) before (b) and after (c) PEGylation with inset showing the picture of FePS3-PEG dispersed in PBS and in DMEM
    UV-Vis-NIR diffuse reflectance spectrum of FePS3 NSs with inset showing the estimated band gap potential
    3. UV-Vis-NIR diffuse reflectance spectrum of FePS3 NSs with inset showing the estimated band gap potential
    UV-Vis absorption spectra of the mixture solution of FePS3 NSs mixed with DPBF (1,3-diphenylisobenzofuran) (a) and DPBF solution (b) under 660 nm laser irradiation, and ESR spectra of different reaction systems (c)TEMP: a reagent used to detect 1O2. DMPO: a reagent used to detect O2•- and ∙OH
    4. UV-Vis absorption spectra of the mixture solution of FePS3 NSs mixed with DPBF (1,3-diphenylisobenzofuran) (a) and DPBF solution (b) under 660 nm laser irradiation, and ESR spectra of different reaction systems (c)TEMP: a reagent used to detect 1O2. DMPO: a reagent used to detect O2•- and ∙OH
    Vis-NIR spectra of FePS3 NSs with different concentrations (a), photothermal heating curves for different time at different concentrations (b), and different laser power densities (1064 nm laser) (c), and photothermal curve of FePS3 NSs under 5 cycles of laser “on-off” (d)
    5. Vis-NIR spectra of FePS3 NSs with different concentrations (a), photothermal heating curves for different time at different concentrations (b), and different laser power densities (1064 nm laser) (c), and photothermal curve of FePS3 NSs under 5 cycles of laser “on-off” (d)
    Thermal images of different concentrations of FePS3 nanosheets heated by 1064 nm laser irradiation for different time
    6. Thermal images of different concentrations of FePS3 nanosheets heated by 1064 nm laser irradiation for different time
    Linear fitting curve between normalized absorption intensity of FePS3 NSs at λ=1064 nm divided by the characteristic length of the sample at corresponding concentration (A/L) and the corresponding concentration (a), linear relationship between -lnθ and time of cooling process of FePS3 NSs after 1064 nm laser irradiation (b), heating and cooling curves of FePS3 NSs under 1064 nm laser irradiation, and linear relationship between -lnθ and time of the cooling process (c) ε, τs and η represent extinction coefficient, time constant in cooling stage, and photothermal conversion efficiency, respectively, of FePS3 NSs under 1064 nm laser irradiation
    7. Linear fitting curve between normalized absorption intensity of FePS3 NSs at λ=1064 nm divided by the characteristic length of the sample at corresponding concentration (A/L) and the corresponding concentration (a), linear relationship between -lnθ and time of cooling process of FePS3 NSs after 1064 nm laser irradiation (b), heating and cooling curves of FePS3 NSs under 1064 nm laser irradiation, and linear relationship between -lnθ and time of the cooling process (c) ε, τs and η represent extinction coefficient, time constant in cooling stage, and photothermal conversion efficiency, respectively, of FePS3 NSs under 1064 nm laser irradiation
    Relative cell viabilities of 4T1 cells after incubation with different concentrations of FePS3-PEG
    8. Relative cell viabilities of 4T1 cells after incubation with different concentrations of FePS3-PEG
    In vitro photodynamic therapy (a) and photothermal therapy (b) treatment of 4T1 cells after incubation with different concentrations of FePS3-PEG
    9. In vitro photodynamic therapy (a) and photothermal therapy (b) treatment of 4T1 cells after incubation with different concentrations of FePS3-PEG
    Confocal laser scanning microscope (CLSM) images of 4T1 cell viabilities (a), reactive oxygen species (ROS) production (b) and changes in mitochondrial membrane potential (c) after different treatments Calcein-AM/PI, DCFH-DA and JC-1 represent methods for detecting cell viability, ROS production, and changes in mitochondrial membrane potential, respectively
    10. Confocal laser scanning microscope (CLSM) images of 4T1 cell viabilities (a), reactive oxygen species (ROS) production (b) and changes in mitochondrial membrane potential (c) after different treatments Calcein-AM/PI, DCFH-DA and JC-1 represent methods for detecting cell viability, ROS production, and changes in mitochondrial membrane potential, respectively
    Mai YANG, Min ZHU, Yu CHEN, Yufang ZHU. FePS3 Nanosheets: Preparation and Potential in Photothermal-photodynamic Therapy [J]. Journal of Inorganic Materials, 2021, 36(10): 1074
    Download Citation