• Acta Optica Sinica
  • Vol. 44, Issue 4, 0405001 (2024)
Junchang Li1、**, Qinghe Song1、2、*, Jinbin Gui1, and Haiting Xia1、2
Author Affiliations
  • 1Department of Physics, Faculty of Science, Kunming University of Science and Technology, Kunming 650500, Yunnan, China
  • 2Yunnan Key Laboratory for Disaster Reduction in Civil Engineering, Kunming 650500, Yunnan, China
  • show less
    DOI: 10.3788/AOS231653 Cite this Article Set citation alerts
    Junchang Li, Qinghe Song, Jinbin Gui, Haiting Xia. Calculation of Coherent Optical Imaging Theory and Ringing Oscillation[J]. Acta Optica Sinica, 2024, 44(4): 0405001 Copy Citation Text show less
    Single lens imaging system
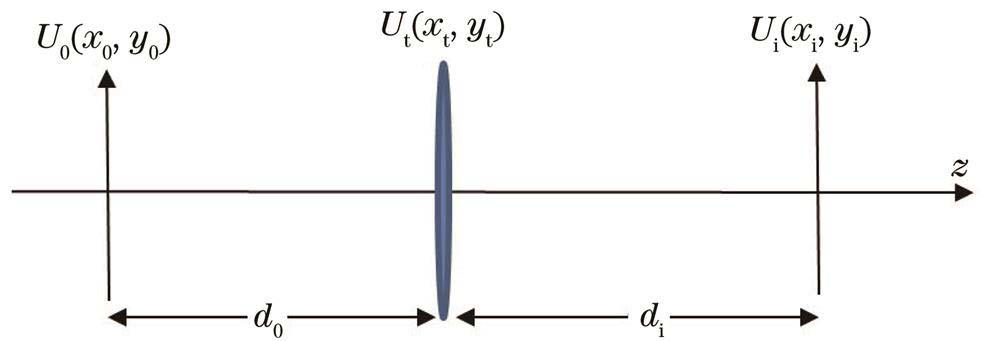
    Fig. 1. Single lens imaging system
    Structure diagram of USAF1951 resolution version
    Fig. 2. Structure diagram of USAF1951 resolution version
    Experiment system of digital holographic microscopy
    Fig. 3. Experiment system of digital holographic microscopy
    Image plane intensity recorded by CCD and amplitude of simulated ideal images (8.32 mm ×8.32 mm). (a) Image plane intensity; (b) simulated ideal image amplitude
    Fig. 4. Image plane intensity recorded by CCD and amplitude of simulated ideal images (8.32 mm ×8.32 mm). (a) Image plane intensity; (b) simulated ideal image amplitude
    Amplitude and phase diagrams of object plane (0.453 mm×0.453 mm). (a) Amplitude of object plane; (b) phase of object plane
    Fig. 5. Amplitude and phase diagrams of object plane (0.453 mm×0.453 mm). (a) Amplitude of object plane; (b) phase of object plane
    Spectral intensity of Fourier transform and circular filtering window image by two equations(1600/8.32 mm-1×1600/8.32 mm-1). (a) Eq. (17); (b) Eq. (6)
    Fig. 6. Spectral intensity of Fourier transform and circular filtering window image by two equations(1600/8.32 mm-1×1600/8.32 mm-1). (a) Eq. (17); (b) Eq. (6)
    Simulated intensity images by two equations. (a) Eq. (17); (b) Eq. (6)
    Fig. 7. Simulated intensity images by two equations. (a) Eq. (17); (b) Eq. (6)
    Image intensity curves obtained by two equations in the negative x-axis direction. (a) Eq. (17); (b) Eq. (6)
    Fig. 8. Image intensity curves obtained by two equations in the negative x-axis direction. (a) Eq. (17); (b) Eq. (6)
    Comparison of locally enlarged image by Eq. (17) and CCD measurement image for reconstructed image intensity. (a) Theoretical simulation result; (b) experimental measurement result
    Fig. 9. Comparison of locally enlarged image by Eq. (17) and CCD measurement image for reconstructed image intensity. (a) Theoretical simulation result; (b) experimental measurement result
    Comparison between locally enlarged image by Eq. (6) and CCD measurement image for reconstructed image intensity. (a) Theoretical simulation result; (b) experimental measurement result
    Fig. 10. Comparison between locally enlarged image by Eq. (6) and CCD measurement image for reconstructed image intensity. (a) Theoretical simulation result; (b) experimental measurement result
    Comparison of amplitude distribution of two types of image spectra. (a) Amplitude of ideal with secondary phase factor; (b) amplitude of digital hologram eliminating 0-order diffraction interference
    Fig. 11. Comparison of amplitude distribution of two types of image spectra. (a) Amplitude of ideal with secondary phase factor; (b) amplitude of digital hologram eliminating 0-order diffraction interference
    Comparison of reconstructed image intensity between theoretical simulation image and experimental reconstruction image. (a) Reconstruction image of theoretical simulation; (b) experimental reconstruction image
    Fig. 12. Comparison of reconstructed image intensity between theoretical simulation image and experimental reconstruction image. (a) Reconstruction image of theoretical simulation; (b) experimental reconstruction image
    Junchang Li, Qinghe Song, Jinbin Gui, Haiting Xia. Calculation of Coherent Optical Imaging Theory and Ringing Oscillation[J]. Acta Optica Sinica, 2024, 44(4): 0405001
    Download Citation